The Changing Landscape of Poverty
COMMUNITY TRENDS | SUMMER 2019
Executive Summary
One in Four Residents Live in Low-Income Neighborhoods or Concentrated Poverty
Poverty has been increasing in the Indianapolis region, as it has in many Midwestern metropolitan areas. In 2017, 14 percent of Central Indiana residents lived below the poverty threshold, compared to 9 percent in 1970.
In many Indianapolis neighborhoods, the poverty rate is much higher. One fifth of the region’s residents live in low-income neighborhoods—census tracts with poverty rates of 20 to 39 percent. 80,000 residents live in areas of concentrated poverty, with poverty rates of at least 40 percent.
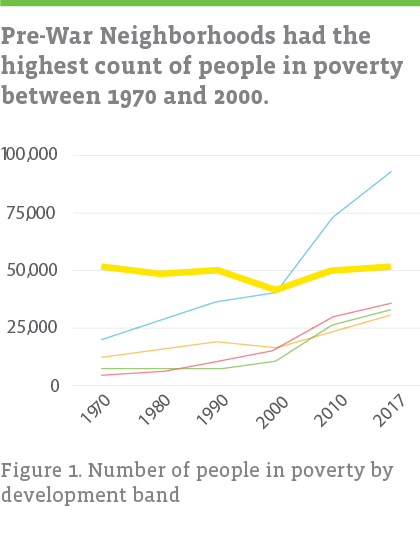
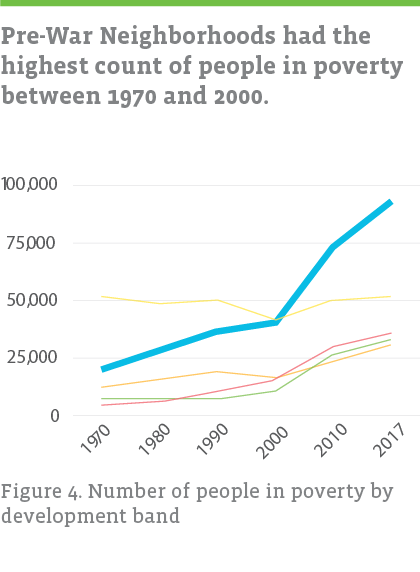
Poverty Highest in Pre-War Neighborhoods, But Climbing Fast in Older Suburbs
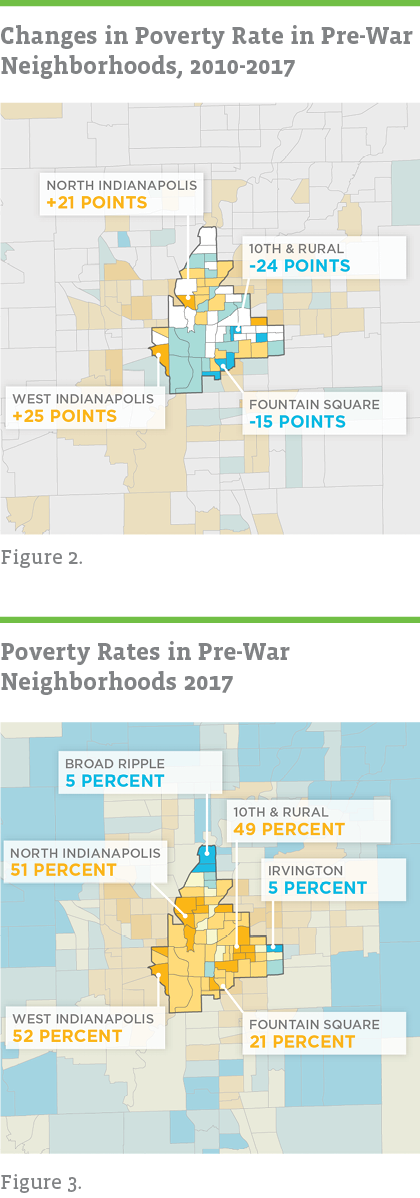
Pre-War Neighborhoods, built largely before 1940, have the highest average poverty rate (29 percent). This rate has stabilized since 2010 as a decades-long decline in the population above poverty subsided. The stable poverty rate masks vastly different circumstances for particular neighborhoods. North Indianapolis and West Indianapolis, two neighborhoods near downtown, experienced double-digit increases in the poverty rate, and neighborhoods near Fountain Square and 10th and Rural experienced double-digit declines.
Meanwhile, Interstate Neighborhoods, built largely in the 1960s and 1970s, have seen a rapid increase in both the number of people in poverty and the poverty rate since 2000. In 2017, there are nearly twice as many people in poverty in Interstate Neighborhoods as in Pre-War Neighborhoods (93,000 compared to 51,000). Poverty rates more than doubled, from 9 percent in 2000 to 20 percent in 2017.
Growth Concentrated in Outer Suburbs
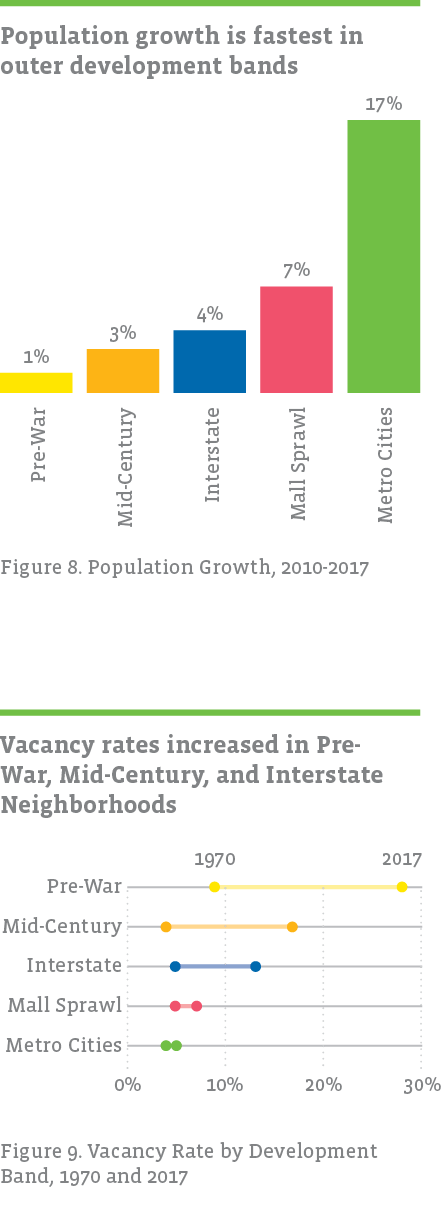
While gentrification and redevelopment may have led to a decrease in poverty in some neighborhoods, there is not a large increase in people above the poverty threshold in Pre-War Neighborhoods overall. Most of the population growth in Central Indiana is actually occurring in outer suburbs. Metro Cities, built largely in the 2000s and 2010s, have added 82,000 residents since 2010, but few of them were people in poverty. The poverty rate here remained low, at 6 percent.
The economy is also growing in the outer suburbs. Jobs in Metro Cities grew by 60 percent between 2002 and 2015. While Metro Cities added 22,000 jobs in sectors that tend to offer moderate or high paying jobs (like healthcare, professional services, and education), Metro Cities also added 31,000 jobs in administrative, retail trade, and accommodation and food service.
In Interstate Neighborhoods, Fewer Workers in High Pay Sectors, More in Low Pay Sectors
The economy of Interstate Neighborhoods has not fared as well. Jobs grew by 2 percent, from 2002 to 2015. The number of workers grew by 1 percent, while the population grew by 4 percent. The mix of sectors where workers are employed shifted in Interstate Neighborhoods, reflecting broad changes in the overall economy. There are fewer manufacturing workers and more transportation, warehousing, and healthcare workers. While the healthcare and transportation sectors still offer jobs with moderate pay, they represent an average decrease in pay compared to manufacturing. Manufacturing workers earn $1,118 per week on average, transportation and warehousing workers earn $954, and healthcare workers earn $924.1
The growing number of workers in low-pay sectors could lead to more households with low incomes or income below the poverty level. From 2002 to 2015, there were 11,000 more workers living in Interstate Neighborhoods who were employed in administration, retail, and food services, where the average weekly pay ranges from $409 to $737.
The economy continues to improve but not all workers enjoy the benefits of economic recovery. Low paying jobs and increasing costs of living contribute to growing poverty throughout the region, and too few resources are available that would mitigate the effects of poverty.
For Families in Poverty, Income Is Far Below Self-Sufficiency Standard
A family of four living in poverty is surviving on an income below $25,500.2 Yet according to the Indiana Institute for Working Families, a four-person family with two school a children in Marion County needs $50,800 to be self-sufficient.3 A single parent with two children living in poverty has an annual income below $20,200, less than half the amount needed to be self-sufficient.
Poverty in Central Indiana: Overall Trends and Geographic Comparison
The federal poverty level is used to determine how many families or individuals lack access to basic necessities. This metric was first calculated by economist Mollie Orshansky in the 1960s, based on the cost of the USDA’s most economically priced food plan for a family, assuming that the family would spend 30 percent of their total income on food.4
During its War on Poverty, the Johnson administration further extended this measure to define “low-income neighborhoods” as census tracts where at least 20 percent of the population fell below the federal poverty line. Tracts with a poverty rate of at least 40 percent were defined as areas of “concentrated poverty.” In Central Indiana in 2017, over 400,000 people, or one in every five residents, lived in low-income neighborhoods. More than 80,000 lived in areas of concentrated poverty.
Poverty is strongly associated with job loss, educational attainment, and age. Young people, especially children, are more likely to be in poverty than older people. Economic recessions tend to drive up the poverty rate. Income, a central component to the definition of poverty, varies widely by race and ethnicity. Poverty rates are much higher among people of color than white Americans.5 Complicating the immediate and intergenerational effects of poverty, poor people are more likely to be incarcerated (which leads to reduced economic opportunity)6 and more likely to suffer from poor health.7
Since 1969, Poverty Steady in U.S., Increasing in Central Indiana
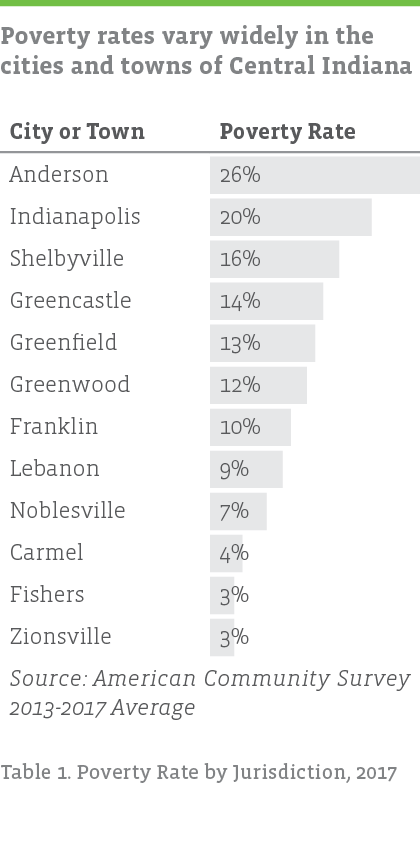
The poverty rate in the United States in 1969 was 12 percent.8 In 2017, it was 13 percent.9 The share of people in poverty is persistent despite consistent economic expansion over the last five decades. The share of people in poverty is persistent despite economic expansion over the last five decades. Across large Midwestern metros, the poverty rate ranges from 16 percent (Detroit, MI) to 11 percent (Kansas City, MO). In the 11-county Indianapolis metropolitan area, the rate grew from 9 percent in 1970 to 14 percent in 2017. But poverty rates vary widely across Central Indiana cities, and especially by neighborhood.
Using Development Bands as Geographic Comparison
Our research began by wondering if poverty was “moving to the suburbs,” but “suburb” is too loose and ill-defined a term to be useful for analysis. Instead of classifying areas as urban or suburban, we sought to develop a less arbitrary, more nuanced classification that accounted for a spectrum of neighborhoods from the urban core to the outer suburbs.
We grouped areas based on when they developed. We classified census tracts based on the two-decade period of time when the most housing was constructed for that census tract and its neighbors. By considering both a tract and its neighbors, we accounted for pockets of development that did not match the general area. For example, some census tracts downtown have more new housing than old, but downtown neighborhoods are still clearly considered established despite having new development. Tracts with fewer than 100 housing units per square mile were considered rural and not included in any development band.
The period in which a neighborhood developed has implications for the built environment, housing, and other factors that impact the people who live there. For example, older neighborhoods tend to have a gridded road network10 with narrower streets compared to neighborhoods built in the 1950s and later. In older neighborhoods, houses and lots tend to be smaller and more affordable,11 there are more rental units,12 and the density is higher.13 These features of the built environment impact people. Density and urban street patterns can make it easier to walk or use public transit, and the availability of affordable rental units provides housing options for low-income families.
What resulted was five development bands that form concentric circles around Indianapolis and other outlying cities and towns. Below, we explore each band’s characteristics in terms of built environment, demographics, and poverty.
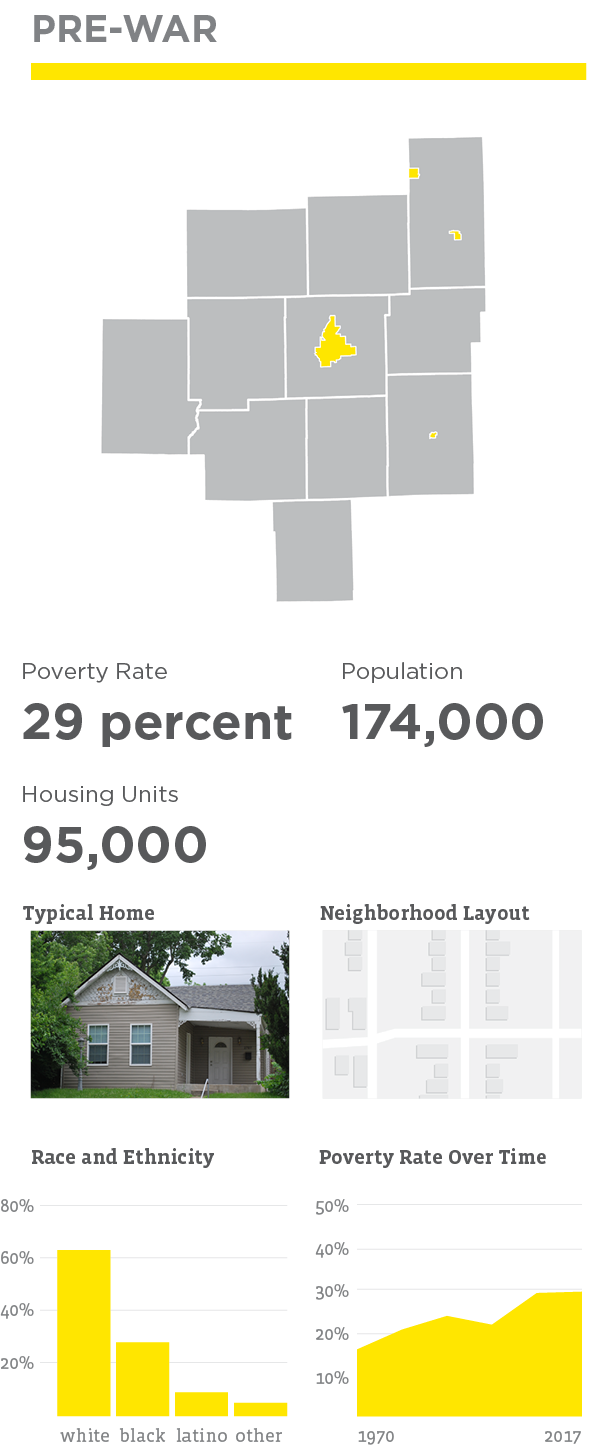
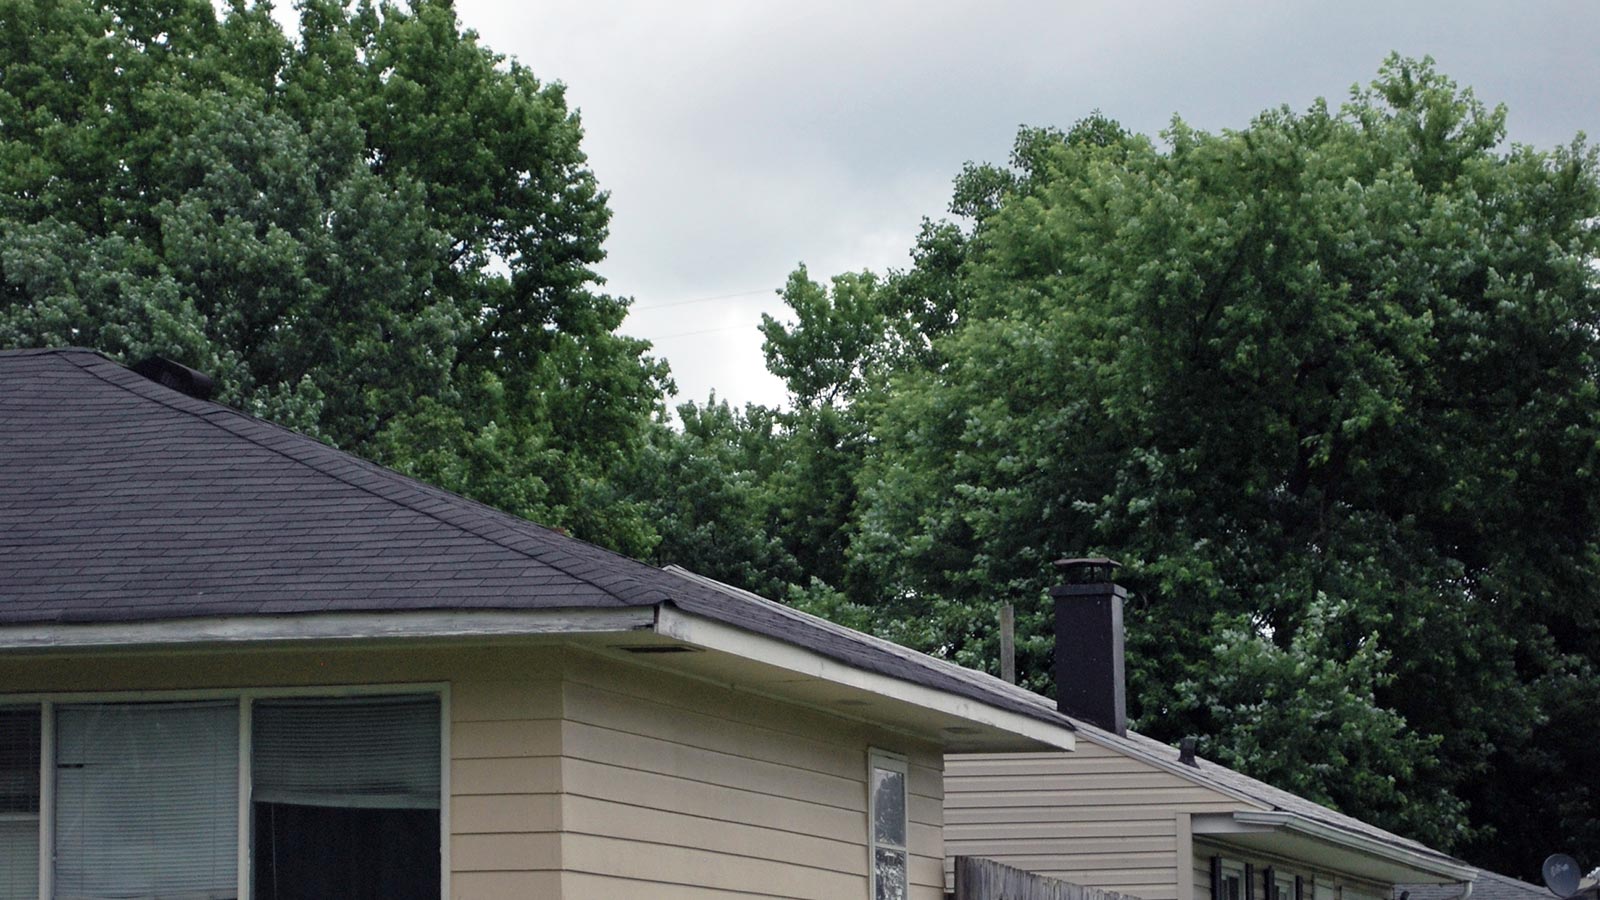
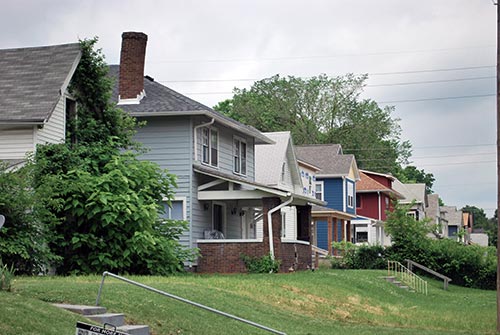
Pre-War Neighborhoods were largely built before 1940. They make up the core of Indianapolis, Shelbyville, and Anderson. These neighborhoods tend to be high density, with an average of three housing units per acre, and have a gridded street network. Homes are typically brick or wood siding. Although the population of these neighborhoods has fallen by 144,000 since 1970, they have remained relatively diverse. As the white and black population fell, the population of other races increased. Population has stabilized since 2010, growing slightly for the first time in decades.
A third of adults in poverty in Pre-War Neighborhoods lack a high school diploma. Of those in poverty who are enrolled in school, 36 percent are in college. More than 16 percent of households in poverty have five or more people. Because transit service in these neighborhoods is reasonably good, 11 percent of workers in poverty commute using transit, compared to three percent of workers above the poverty line who more often choose to drive alone.
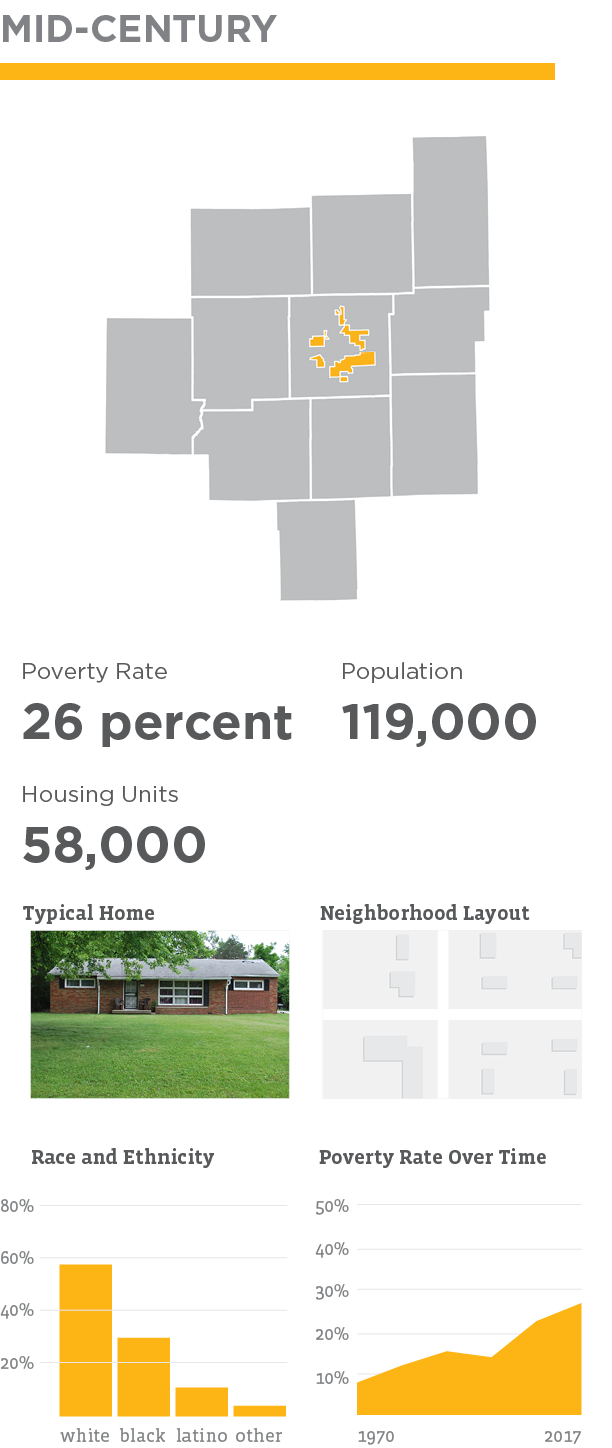
Mid-Century Neighborhoods were built primarily in the 1940s and 1950s. This was a period of slow housing construction, due in part to restrictions on building materials during World War II, which partially explains why this is the smallest development band. Mid-Century Neighborhoods tend to be situated inside I-465 near downtown Indianapolis. They are about half as dense as Pre-War Neighborhoods. Typical home exteriors include brick, limestone, and aluminum siding. In this development band, the population has fallen by 41,000 since 1970.
More than 60 percent of the workforce in poverty in Mid-Century Neighborhoods have been out of work for a year or more, compared to about 53 percent of those in poverty in other development bands. About 40 percent of adults have a high school diploma alone, indicating that fewer jobs may be available nearby that match their educational attainment.
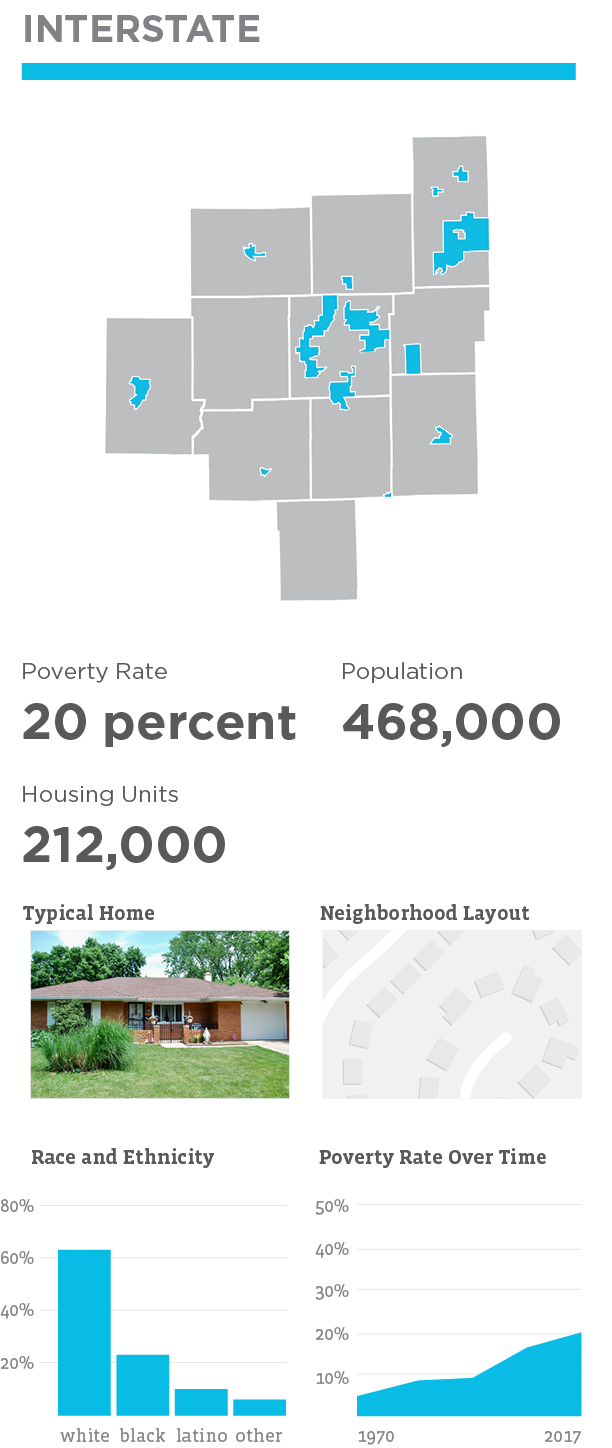
Interstate Neighborhoods were built in the 1960s and 1970s, when the interstates were being constructed. Many of these neighborhoods fall along highways like I-465, I-65, and I-69. The 1960s and 1970s were a time of prolific development, and this is one of the largest development bands. Streets are winding and typically without sidewalks, and the average house is a ranch or split-level clad in brick or vinyl. The population has grown by 76,000 since 1970. Although these neighborhoods were nearly all white in 1970, growth in recent decades has been driven by people of color.
Given the relatively poor transit service available in Interstate Neighborhoods, the share of workers in poverty commuting by transit is only 2 percent, but 15 percent carpool (the highest carpool rate in the region). More than 17 percent of households in poverty speak Spanish at home. According to 2017 data, 18 percent of households in poverty had moved within the county in the past 12 months.
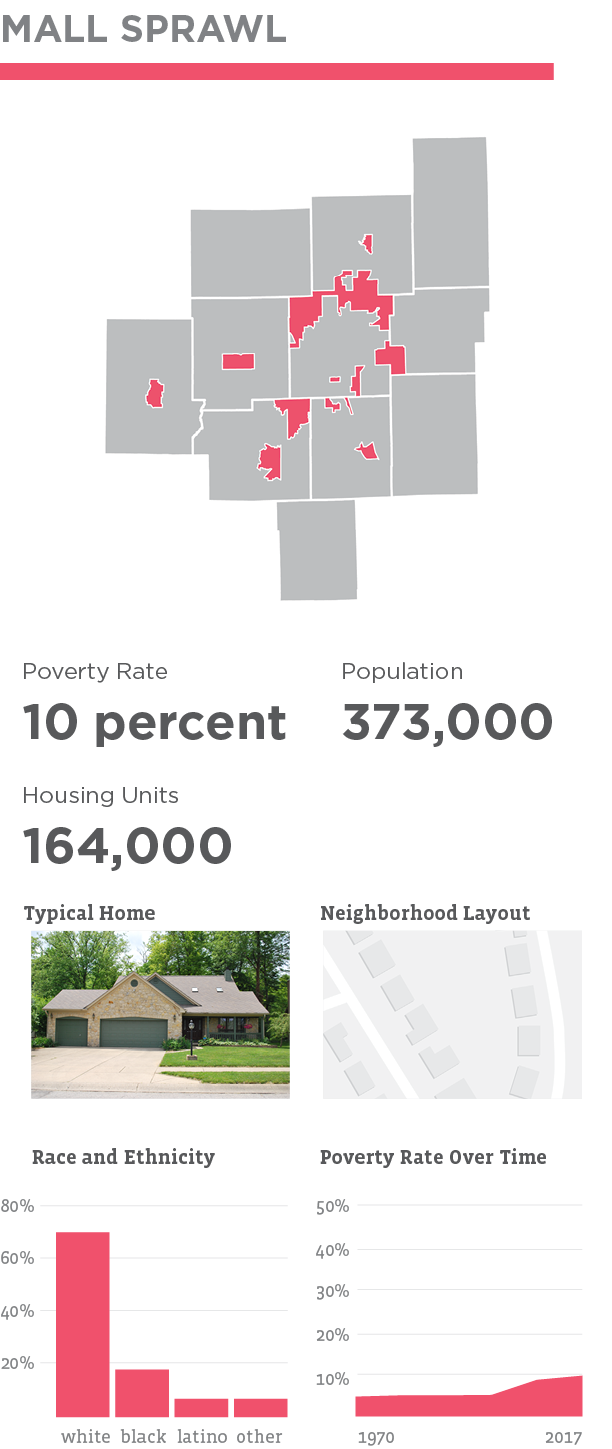
These neighborhoods, built in the 1980s and 1990s, are mostly located on the north side of Indianapolis (near malls like Lafayette Square, Washington Square, Keystone Fashion Mall, and Castleton Square). This area also includes the core of Fishers and Carmel, which began to develop in the 1990s. The average density is about one housing unit per acre, one-third as dense as Pre-War Neighborhoods. These neighborhoods have grown by 264,000 people since 1970. While there was growth among all races and ethnicities, people of color increased the fastest. The area was 99 percent white in 1970, and was 70 percent white in 2017.
Nearly 40 percent of people in poverty in Mall Sprawl are enrolled in school – most of them children enrolled in Pre-K through 12th grade. 11 percent of households in poverty speak Spanish at home, and another 8 percent speak a language other than English or Spanish. Among adults in poverty, 16 percent have a college degree.
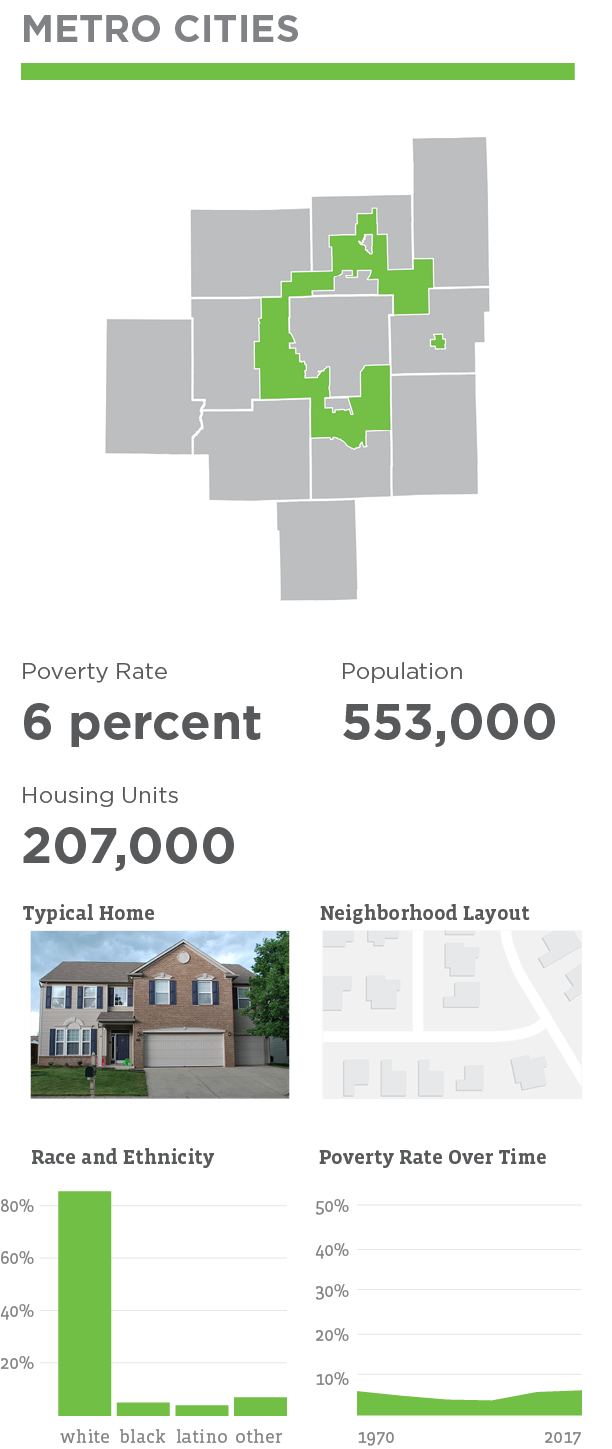
Metro Cities were built after 2000. These fringe areas border rural, mostly agricultural land, but include rapidly-growing cities and towns like Fishers and Westfield. They have curving streets; sidewalks and multi-use paths are more common than in older suburbs. Homes are typically brick, stone veneer, vinyl, or cement board. Many of these towns have historic city centers, but they have been dwarfed by newer housing developments, which is why they are not included in Pre-War Neighborhoods. Population here has grown by 428,000 since 1970. A quarter of the region’s population lives in Metro Cities. Though the number of people of color has increased quickly, the area is still 85 percent white.
Among households in poverty, Metro Cities had the highest share (7 percent) of households who moved from another county. Likely reflecting the size of housing in Metro Cities, 17 percent of households in poverty had more than five people, including 5 percent with more than seven people. Among adults in poverty, 45 percent had some college or more, and 37 percent worked part time.
In Pre-War Neighborhoods, Poverty High but Stable Since 2010
Pre-War Neighborhoods have long had a higher poverty rate than other development bands, and that is still the case. Increased development activity did not lead to an overall decline in the population in poverty. Still, poverty rates have stopped climbing since 2010. And while Pre-War Neighborhoods once had more people in poverty than any other development band, this changed in 2000, when Interstate Neighborhoods became the most populous area in terms of those in poverty.
Historically an Area of High Poverty
Pre-War Neighborhoods were once the second most populous area in the region, housing over a quarter of the population in the 11-county area. In 1970, the poverty rate in Pre-War Neighborhoods (16 percent) was the highest among the five development bands in our analysis, and greater than the national (14 percent), state (10 percent), and regional (9 percent) rates at that time. Of the 108,000 people in poverty living in Central Indiana in 1970, almost half lived in Pre-War Neighborhoods.
As of 2017, 268,000 people lived below the poverty threshold in Central Indiana, and one-fifth of them lived in Pre-War Neighborhoods. The poverty rate has doubled since 1970. Now, almost third of the population in Pre-War Neighborhoods live in poverty.
This is partially explained by population decline in Pre-War Neighborhoods while the region’s population has increased. There are now 145,000 fewer people living in this development band—a net loss of 45 percent. The population above the poverty threshold fell by 144,000 since 1970, but the number of people in poverty has not fallen at all.
Since 2010, the overall population in this category has increased by 3 percent, a signal that new development may be halting the decades-long outflow of population. In this time, poverty rates also stabilized. The 29 percent poverty rate in 2017 is unchanged from 2010.
Variations in Poverty Across Demographics
The burden of poverty in Pre-War Neighborhoods, as elsewhere, falls disproportionately on youth and people of color. Young adults age 18-34 comprise more than a third of the population in poverty. Likewise, two of every five children under age 12 live in poverty. Meanwhile, adults over 65 are more than twice as likely to live above the poverty threshold as children and young adults, largely due to social safety nets that benefit older adults, such as Social Security and Medicare.14 Similarly, non-white residents are twice as likely to live in poverty as white residents.
Trends in Poverty Rates Diverge in Many Neighborhoods
While the overall poverty rate has held steady in Pre-War Neighborhoods since 2010, some specific neighborhoods have experienced a drop in poverty rates while others experienced an increase. One-third of residents in Pre-War Neighborhoods live where the poverty rate has fallen by five percentage points or more. Another one-in-five live in neighborhoods where poverty increased significantly—by nine percentage points or more.15
Gentrification and redevelopment are bringing in higher-income residents and driving poverty down in some neighborhoods, but not in others. In many Pre-War Neighborhoods, poverty is still high and increasing. The poorest tracts tended experience declines in poverty. For tracts where poverty fell since 2010, the average poverty rate was 37 percent in 2010. For tracts where poverty increased, the average rate was 23 percent.
Between 2010 and 2017, the poverty rate fell by nearly 25 percentage points on the Near Eastside (near 10th Street and Rural), but remains at a troubling 49 percent. Poverty also fell steeply in Fountain Square and other neighborhoods on the southeast side, but rose moderately for many tracts in the Mid-North area, and rose steeply in North Indianapolis. On the West Side, tracts near the White River have experienced a decline in poverty, although poverty increased in neighborhoods further west, such as Haughville and part of West Indianapolis.
In Interstate Neighborhoods, Poverty Increasing Since 2000
Interstate Neighborhoods were similar to outlying areas in 1970, with relatively few people in poverty and a low poverty rate. But in 2000, this area surpassed Pre-War Neighborhoods as the development band with the highest number of people in poverty.
Poverty Increased Since 1970
Interstate Neighborhoods were home to 393,000 residents in 1970, with 20,000 (approximately 5 percent) living in poverty. At that time, these neighborhoods had a lower poverty rate than Central Indiana (9 percent), the state (10 percent), and the nation (14 percent). Of the 108,000 people in poverty living in Central Indiana in 1970, one-fifth of them lived in Interstate Neighborhoods.
As of 2017, there were 268,000 people living below the poverty threshold in Central Indiana, and one-third of them lived in Interstate Neighborhoods. In fact, there are more people in poverty in Interstate Neighborhoods than in any other development band. Some of this growth is explained by overall population growth—areas built primarily in the 1960s and 1970s experienced a population increase of 19 percent between 1970 and 2017, adding 76,000 residents. However, the increase in poverty grew significantly more, by 365 percent to 93,000.
Largest Increase in Poverty Came After 2000
Most of this increase occurred between 2000 and 2017. From 1970 to 2000, the population in poverty grew by 21,000. The number of people in poverty has since increased by 52,000.
The poverty rate in Interstate Neighborhoods is 20 percent, but this overall rate masks important differences among age groups, races, and ethnicities. Poverty is highest among children, teens and young adults. Children under age 12 make up 30 percent of the population in poverty in these neighborhoods. Additionally, one-in-four young people age 18-24 live in poverty. Meanwhile, only 11 percent of adults 45 years old or older live in poverty.
Interstate Neighborhoods have more Latino residents than any other development band, and one the highest poverty rates among Latinos in the region (40 percent). In fact, half of all Latinos that are in poverty in Central Indiana live in Interstate Neighborhoods. Four out of every ten people in poverty in Interstate Neighborhoods are white, three-in-ten are black, and two-in-ten are Latino.
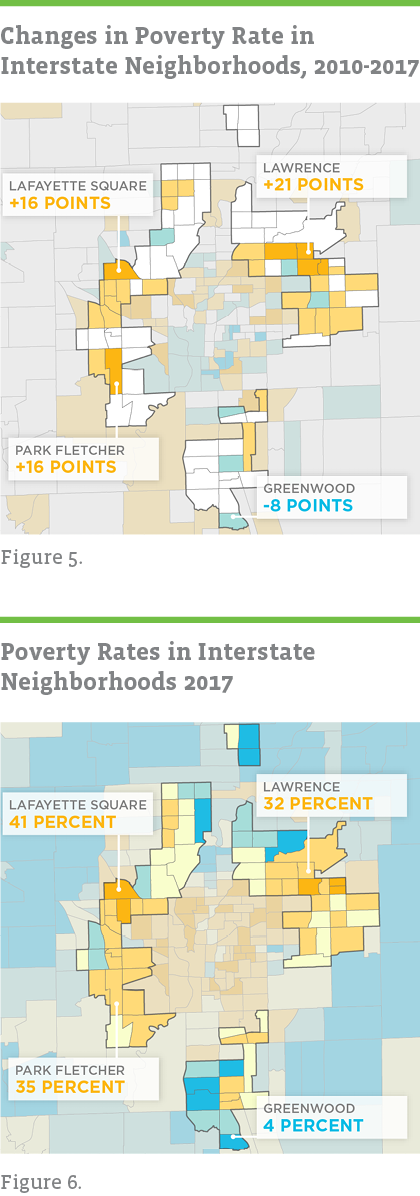
Poverty on the Rise on East and West Side
Poverty is highest in Interstate Neighborhoods on the east and west side of Indianapolis and lowest in north and south side neighborhoods. As of 2017, Lawrence and Lafayette Square both had poverty rates over 30 percent, but in 1970, the poverty rate in these areas was less than 5 percent. In 1970, shortly after those neighborhoods were constructed, most residents were white and the average family was well-off, earning above $70,000 (in 2017 inflation-adjusted dollars). Today, the average family earns about half that amount.16
One in four people living in Interstate Neighborhoods’ reside in a neighborhood where the poverty rate increased by at least nine percentage points since 2010. Poverty is increasing in neighborhoods like Lafayette Square, Lawrence, Speedway, and Park Fletcher.
Far fewer areas experienced declines in poverty; only 8 percent of the population live where the poverty rate fell by at least five percentage points. Some of the areas where poverty declined are near Lawrence and the Far Eastside, and on the south side of Indianapolis near University Heights, Southport, and Greenwood.
The Impact of Housing and Economic Growth
Gentrification, or the “pushing” force of displacement, may cause some of the poverty increase in Interstate Neighborhoods. But if poor residents were being pushed to the suburbs on a large scale, you would expect Pre-War Neighborhoods to experience a decline in poor residents or a growth in non-poor residents. Instead the poverty population of Pre-War Neighborhoods has changed little since 1970. Meanwhile, the “pulling” force of sprawl and suburbanization is still the overwhelming growth pattern in the region. Poor residents can certainly be displaced from specific neighborhoods and housing developments, but may be moving to other Pre-War Neighborhoods.
The Development of Suburbs and the Exclusion of Black Residents
At one point, Interstate Neighborhoods were the vanguard of suburban expansion and the destination of white flight. In 1970, Interstate Neighborhoods were 97 percent white. The white population grew in suburbs in the 1970s while falling by 45,000 in Pre-War Neighborhoods. The new neighborhoods were relatively well off. The typical family earned $88,000 in 2019 USD.17
These suburbs were often built with backing from the Federal Housing Administration (FHA), which would guarantee loans for home buyers and, in doing so, help builders finance suburban developments.18 The FHA loan guarantees typically required that developers would sell only to white home buyers and not build integrated communities.19 This practice was made illegal under the Fair Housing Act of 1968. But the result was that in 1970, black residents had largely been excluded from suburban areas. While most white residents lived outside of Pre-War Neighborhoods, few black residents lived in these newly suburbanized areas. Interstate Neighborhoods, Mall Sprawl, and Metro Cities were all nearly 100 percent white.
In the 1970s, black residents began to move to suburbs in large numbers. Nearly 38,000 black residents lived in Mid-Century Neighborhoods by 1980, and Interstate Neighborhoods were home to some of Indianapolis’ first black suburbs, such as Grandview on the northwest side. Between 1970 and 1980, the black population tripled in Interstate Neighborhoods, from 11,000 to 40,000. It has continued to grow to 110,000 in 2017. At the same time, white households have continued to move farther out. The white population began to decline in Interstate Neighborhoods in the 1970s, and has fallen ever since. Meanwhile, the white population in Metro Cities has grown by 348,000 between 1970 and 2017.
Suburban Growth Is Still Booming
In recent years, growth is still focused in the suburbs. While Pre-War Neighborhoods grew by 1 percent from 2010-2017, halting six decades of population decline, Metro Cities have grown by 17 percent in that period, adding 82,000 residents. Vacancy rates also underscore the strong demand in outer suburbs. Metro Cities have a low vacancy rate of 4 percent, compared to 13 percent in Interstate Neighborhoods and 28 percent in Pre-War Neighborhoods. Some vacancy is desired in a stable housing market (or else there would be no homes available for sale or rent), but vacancy is high Interstate Neighborhoods. This indicates that demand for Interstate Neighborhoods has declined over the decades. That demand has shifted further out to Mall Sprawl and Metro Cities more than it has to Pre-War Neighborhoods. As the metropolitan area continues to sprawl, families with fewer resources move into neighborhoods that were once in vogue.
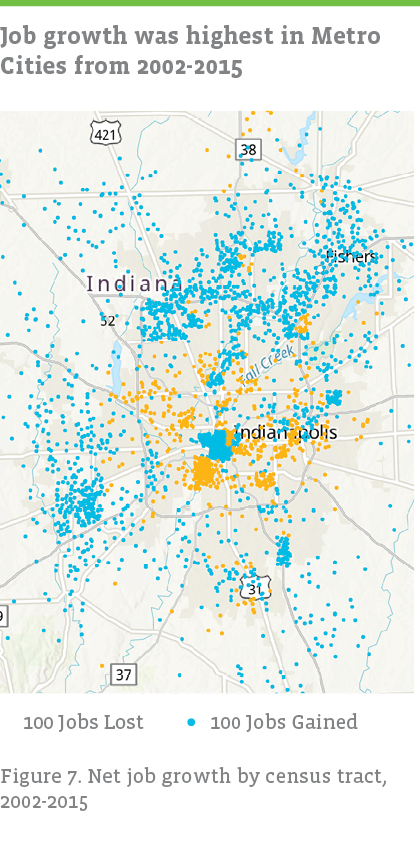
Job Growth Strong in Outer Suburbs, Weak in Mid-Century, Interstate Neighborhoods
Similar to patterns in housing growth, the outer suburbs are booming in terms of job growth. Mall Sprawl and Metro Cities added 318,000 jobs. The regional center also added jobs (18,000 in Pre-War Neighborhoods), but older suburbs did not experience this growth. Mid-Century Neighborhoods lost 13,000 jobs across all sectors, but especially from manufacturing, which lost 5,000 jobs. Interstate Neighborhoods had a net gain of 3,500 jobs, mostly in healthcare, social services, transportation, warehousing, and administration, but lost 7,000 manufacturing jobs.
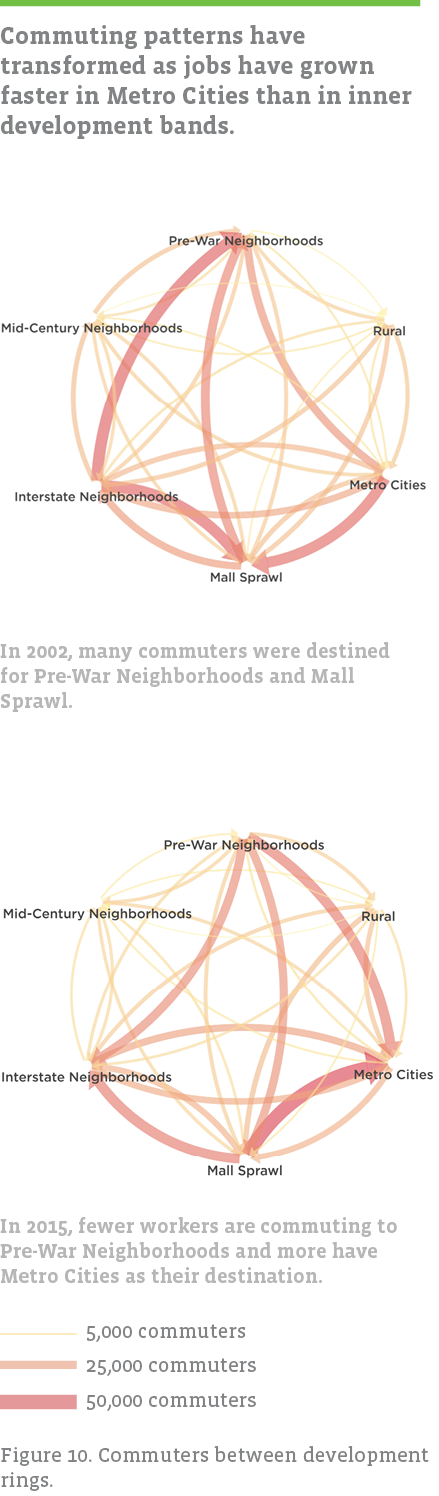
These changes have altered commuting patterns. Fewer workers commute to the city center and many more commute to outer suburbs. The number of workers commuting into Pre-War Neighborhoods from other areas has fallen by 68 percent since 2002. There are nearly two times as many workers commuting to Metro Cities and three times as many commuting to rural areas. Over 50,000 more people now commute from Mall Sprawl to Metro Cities, and 43,000 more from Pre-War Neighborhoods to Metro Cities. There are 35,000 fewer commuters from Interstate to Pre-War Neighborhoods. Over half of Interstate Neighborhood workers commute out to Mall Sprawl, Metro Cities, or rural areas.
In Interstate Neighborhoods, these “reverse commutes” (traveling from the city to the suburbs for employment) exacerbate the transportation difficulties of households without a vehicle. Car-less households are increasing in Interstate Neighborhoods, growing by 29 percent from 2010 to 2017. While a higher share of households in Pre-War Neighborhoods are without a car (17 percent, or 10,800), there are more car-less households in Interstate Neighborhoods than anywhere else (9 percent, or 13,000). This is compounded by the fact that transit service in Interstate Neighborhoods is limited, with less than a third of service compared to Pre-War Neighborhoods (a transit service density of 425 weekly revenue miles per square mile compared to 1407).20 Even the transit infrastructure that does exist is designed to provide access to locations within the city center. It does not serve the commuter seeking to work in outer suburbs.
As Manufacturing Jobs Decline, Healthcare and Administrative Sectors are Growing Fast
In Central Indiana, the mix of jobs has changed drastically since 2002, though the balance of jobs in low, moderate, and high paying sectors21 has stayed relatively constant. Manufacturing jobs declined by 19,000, while healthcare and social service jobs increased by 66,000 and administrative, waste, and cleaning jobs increased by 32,000.
The average pay for workers in both manufacturing and healthcare sectors is moderate. Nationally, production and non-supervisory healthcare employees earn $25 per hour on average and work 32 hours per week. Some occupations earn high wages (healthcare practitioners average $81,000 per year in Central Indiana) and some do not (health support workers earn $33,000 per year in Central Indiana). Three quarters of healthcare workers are in the better-paid practitioner occupation. For manufacturing jobs, the average workers earns $22 per hour and works 42 hours per week.
Therefore, a transfer from manufacturing to healthcare may not represent a decline in income for a worker. But, that assumes a worker has the necessary training and credentials to make the shift. Healthcare jobs often require more education than manufacturing jobs, especially compared to the manufacturing jobs nearly two decades ago. For example, three quarters of licensed practical nurses (LPNs) have at least some college and over 60 percent of registered nurses (RNs) have at least a bachelor’s degree. By contrast, half of machinists and two-thirds of fabricators have only a high school education.22
The growth in administrative jobs does represent a sector that is likely to pay poorly. The average non-supervisory employee earns $19 per hour and works 34 hours per week. The most common occupations in Central Indiana are laborers and freight/material movers (who earn $30,000 per year on average), office clerks ($35,000), and janitors or cleaners ($26,000). These jobs are also more accessible to those without any secondary education. For a single-earner household with children, these jobs represent poverty or near-poverty wages. There are 132,000 single-parent families with children in Central Indiana.
Mid-Century and Interstate Neighborhoods Losing Workers in High Paying Sectors
Inner rings are losing workers employed in high paying sectors and gaining workers in low paying sectors. These trends are mostly modest in scale, though Interstate Neighborhoods have seen workers in low-wage sectors grow by 9 percent and high paying sectors decline by 7 percent. In Mid-Century Neighborhoods, workers in high paying sectors fell by 11 percent. The biggest growth is occurring in outer development bands, where there are more workers in all sectors. Metro Cities have seen workers in low, moderate, and high paying sectors all grow by about 50 percent.
Unemployment and Labor Force
After discussing these changes in workers and job opportunities, it should be noted that, while these changes affect the financial stability of individuals, many people in poverty are unemployed or not in the labor force. While estimated 2013-2017 average unemployment rate for people above poverty is 4 percent, it is 27 percent for people in poverty. And while 71 percent of working age people above poverty are in the labor force, less than half of individuals in poverty are. There are various reasons why an individual may not participate in the labor force, such as performing unpaid work for the household, a disability, or long-term unemployment due to mismatched job skills.
Discussion
In June 2019, the current administration proposed a revision to the way poverty thresholds are calculated. These proposed guidelines would modify the way inflation rates are used to calculate the cost of food.23 This would result in hundreds of thousands fewer low-income people being eligible for SNAP, Medicaid, HeadStart, and other social programs designed to alleviate some of the burden of living in poverty.24 25 With more than 400,000 people in Central Indiana living on wages too low to support a household, this proposed policy would jeopardize the limited subsidized resources available and place an increased burden on local governments and organizations to help provide basic necessities to these individuals.
However, limited programming intended to be an expedient solution for those in poverty are often and unfortunately needed for extended periods of time. Short term cash assistance will not pull a family out of poverty, nor will a gas card, a bus pass, or emergency shelter. Yet these housing and transportation needs, alongside long-term objectives to improve education and employment, are interrelated. Intentional policies designed to address the intersections of these needs are critical to reducing poverty.
At the local level, improving access to transit, affordable fares, and connecting transit service to employment centers beyond downtown Indianapolis could help improve the economic livelihoods of workers in poverty, particularly those living in Interstate Suburbs.26 27 Encouraging more multi-family and affordable housing options in Metro Cities may help move workers closer to jobs and therefore reduce the costs associated with a burdensome commute.
Policies at the state and federal levels are key to reducing poverty – especially intergenerational poverty. In fact, a landmark, 600-page report commissioned by Congress modeled several scenarios for reducing youth poverty and concluded that work-based programs alone are not sufficient to reduce poverty. Cash assistance for children are most effective, especially when coupled with expanded food and housing assistance programs.
28 Raising the wages of the lowest paid workers has also been found to reduce poverty.29 This is important in light of the growing sectors with low-wage jobs.
To be clear, policies intended to reduce the poverty rate should acknowledge the people who live in poverty and what they need in order to become economically self-sufficient.
Children cannot earn their own money, so helping parents in poverty is necessary to reduce youth poverty and improve educational and health outcomes for children. College students often live in poverty, and benefit from policies providing food, subsidizing housing, and reducing the cost of transportation as they work towards an education that may help their overall economic outcomes.
Individuals who are justice-involved face extremely difficult barriers to re-entry, and can benefit from specialized housing and education or employment efforts, in addition to other social services, that help mitigate the stigma of their involvement.
It is impossible to consider poverty without regard to race in the United States. Ultimately, if poverty is to be reduced in any meaningful way, the intentional dismantling of structural inequity that has prevented large swaths of the population, especially black people, from building inter-generational wealth—racist zoning practices, school segregation, and widespread incarceration are a few examples—must lie at the core of anti-poverty policy.
The Polis Center thanks WFYI, United Way of Central Indiana, IUPUI, and the IUPUI School of Liberal Arts for their support of SAVI Community Trends Reports and SAVI Talks.
Find more interactive content from our series on neighborhood change.
No Results Found
The page you requested could not be found. Try refining your search, or use the navigation above to locate the post.
- Bureau of Labor Statistics Current Employment Statistics
- 2018 Census Bureau Historic Poverty Thresholds
- Indiana Institute for Working Families Self-Sufficiency Calculator
- Poverty in the United States: 50-Year Trends and Safety Net Impacts (U.S. Dept. of Health and Human Services, 2016)
- Income and Poverty in the United States: 2016 (U.S. Census Bureau, 2017
- 5 facts about prisoners and work, before and after incarceration (Looney, 2018)
- Interventions and Resources: Poverty (U.S. Dept. of Health and Human Services)
- Historical Poverty Tables (U.S. Census Bureau)
- American Community Survey, 2017, 1-year estimates, Table S1701 (U.S. Census Bureau)
- According to the EPA’s Smart Location Database, Pre-War Neighborhoods have a weighted intersection density of 21.7 intersections per square mile. Intersec-tion density is 14.7 in Interstate Neighborhoods and only 9.7 in Metro Cities. Intersection density is higher in gridded street patterns and lower in winding street patterns (see EPA’s
- In Pre-War Neighborhoods, 54 percent of homes have five rooms or less (2017 American Community Survey). In Metro Cities, only 29 percent of houses have five rooms or less. 71 percent have six or more rooms. The average residential parcel is one seventh of an acre in Pre-War Neighborhoods, one third of an acre in Interstate Neighborhoods, and half an acre in Metro Cities Neighborhoods. The aver-age assessed value of a home is $89,000 in Pre-War Neighborhoods, $106,000 in Interstate Neighborhoods, and $195,000 in Metro Cities.
- Apartments are relatively common in the inner rings, making up about 28-30 percent of the housing stock in Pre-War Neighborhoods, Interstate Neighborhoods, and Mall Sprawl, but in Metro Cities only 13 percent of housing units are apartments.
- Pre-War Neighborhoods average 3.0 housing units per acre, while Interstate Neighborhoods average 1.3 and Metro Cities average 0.6. Higher density neigh-borhoods are better suited for multi-modal transit and mixed-use development (the provision of retail and services nearby residential areas).
- The Supplemental Poverty Measure: 2017 (U.S. Census Bureau, 2018)
- “Significant” in this case represents one standard de-viation above or below the mean. An increase in the poverty rate of 9 percentage points is one standard deviation above the average change in a census tract. A decrease of 5 percentage points is one standard de-viation below the average change in a census tract.
- Neighborhood Change 1970-2016: Suburbanization, Gentrification, and Suburban Redevelopment (Nowlin, Davila, Miguel Andres, 2018)
- Neighborhood Change 1970-2016: Suburbanization, Gentrification, and Suburban Redevelopment (Nowlin, Davila, Miguel Andres, 2018)
- Building Suburbia, pp. 151-153 (Delores Hayden, 2003)
- The Color of Law, pp. 93-100 (Richard Rothstein, 2017)
- Who Rides the Bus (Davila, Nowlin, Miguel Andres, Hollon, 2017)
- We categorized jobs by the average weekly pay in each sector. Weekly pay incorporates both wages and hours worked, so in sectors like retail, pay represents the limited number of hours employees typically work. We annualized this weekly pay by multiplying by 52, then compared these annual estimates the median house-hold income for Central Indiana ($54,000). Where the average annual earnings were above 120 percent of the median household income ($65,000) we called this a high paying sector. Sectors paying an average of $43,300-$65,000 were moderate paying sectors, and sectors with average pay below $43,300 were low paying sectors. (BLS Current Employment Statistics
- Bureau of Labor Statistics Employment Projections
- Request for Comment on the Consumer Inflation Measures Produced by Federal Statistical Agencies (Federal Register)
- Proposed Changes to the Poverty Line Would Reduce SNAP Participation over Time (Gregory Acs,Laura Wheaton, 2019)
- Administration’s Poverty Line Proposal Would Cut Health, Food Assistance for Millions Over Time (Center on Budget and Policy Priorities, 2019)
- How Low-income Transit Riders in Boston
Respond to Discounted Fares: A Randomized Controlled Evaluation (Rosenblum, 2019) - The State of Latino Housing, Transportation, and Green Space: A Research Review (Ramirez, 2019)
- A Roadmap to Reducing Child Poverty (National Academies of Sciences, Engineering, and Medicine. 2019)
- Minimum Wages and the Distribution of Family Incomes (Dube, 2017)