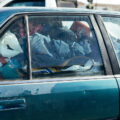
1 out of 5 people in Marion County are in poverty. For a family of 4, that means an annual income of $23,500 or less.
Last week, the US Census Bureau released the 2012 poverty rates for all counties across the nation. While the data show there was no significant change in the poverty rate since 2011, we cannot lose sight of the fact that the rate has nearly doubled over the past decade in Marion County. And its impacts are far reaching. Poverty disproportionately effects some demographics more than others, and as a community, we must consider the implications of those disparities on service delivery and planning.
Our new Trends in Poverty report digs into the 2012 poverty data to explore the disparities that exist in Marion County by age, race, gender, education levels, and neighborhoods – and how that has changed since 2000.

Below are 5 key findings about Marion County, Indiana from the report:
1. The poverty rate is increasing faster in Marion County than in the US and Indiana.
In 2000, the poverty rate in Marion County was behind the US rate, now it is 5.5 percentage points above it. Poverty is increasing for all education levels, even those with a college degree.
2. At 4 out of 10 in poverty, Hispanics are much more affected by poverty than Non-Hispanics, and the situation is worsening.
The poverty rate for Hispanics doubled from 20% in 2000 to 42% in 2012. At 3 out of 10 in poverty, African Americans in Marion County also are disproportionately affected by poverty.
3. One out of 3 children under 18 in Marion County are in poverty – that is 74,401 children in poverty.
At 32.8% in 2012, the child poverty rate in Marion County has doubled since 2000, a rate that is growing faster than the state and US. The Marion County child poverty rate is triple that of seniors (10.9%) and 1.7 times that of people age 18 to 64 (18.9%).
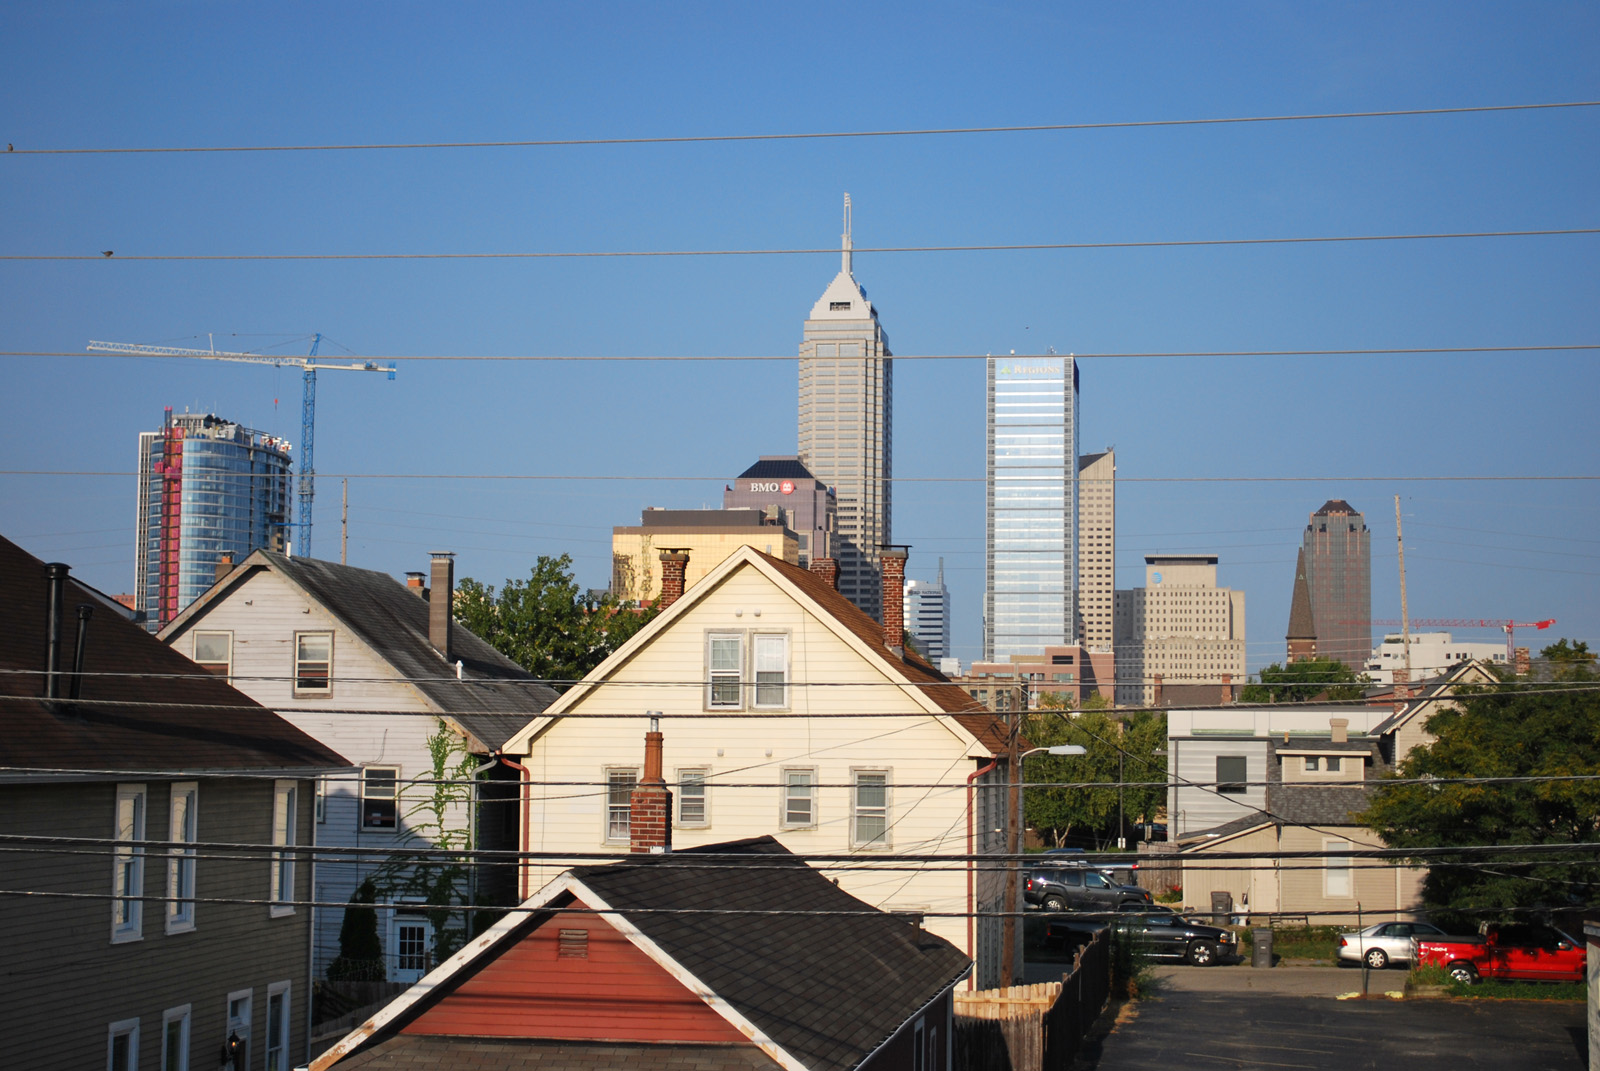
4. Poverty differences by neighborhood are extreme.
High-poverty neighborhoods have a poverty rate of 33%, which is 7 times higher than the rate for low-poverty neighborhoods. The Near Eastside, Downtown, and Martindale Brightwood are the hardest hit areas in the county with rates from 33.4 to 36.9 percent. Crime rates are 5 times higher in high-poverty neighborhoods than in the low-poverty neighborhoods.
5. Education is key. Getting a high school diploma cuts your chance of being in poverty by half.
The Poverty rate for people with no high school diploma is 37%, but with a diploma it drops to 17% and further drops to 5.6% with a bachelor’s degree.
Local Poverty Data Helps Service Providers Target Resources
Poverty often is used as a measure of a community’s economic health. SAVI uses the poverty data to help nonprofits be more strategic and effective in planning their services. The poverty rates helps nonprofits target services where the need is greatest – both geographically and demographically. Nonprofits want to know, where can we make the biggest difference?
Geographic Disparities
By focusing on the neighborhoods that are hardest hit by poverty and that have the greatest lack of existing services, nonprofits can ensure their efforts will make the biggest impact.
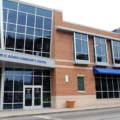
SAVI used the poverty data as the foundation of its analysis, along with other variables, when Marion County Commission on Youth sought to find the best place to locate a one-stop-shop of social services to help prevent children in a high-needs neighborhood from entering the juvenile and welfare systems. Read MCCOY’s story here.
Demographic Disparities
Understanding which demographics are most effected by poverty helps nonprofits understand the implications on their services. For example, the fact that the poverty rate for Hispanics in Marion County has doubled since 2000 combined with the fact that the Hispanic population in general is increasing, is forcing nonprofits to adapt quickly to the changing needs that are unique to this population, such as the need for Spanish-speaking staff.
Read the complete Trends in Poverty report here.
And by the way…
If you want to be a part of the solution and help design strategies to address issues related to poverty, then join us at the Governor’s Conference on Service and Nonprofit Capacity Building Oct. 3 at the Westin for capacity building workshops to learn how to target your resources and Oct. 4 for a state-wide Human Needs Summit to develop strategies to address the issues of education, health, housing, and hunger. Registration ends Friday, September 27!
Next Up
 The People and Places Poverty Impacts the Most
This is part of our IndyVitals blog series, exploring the data behind IndyVitals.org. Poverty does not affect all populations equally. Unfortunately, women, people of color, and people with less education […]
- Income, Unemployment, and Health Insurance in Indianapolis
This is part of our IndyVitals blog series, exploring the data behind IndyVitals.org. You may be aware that the U.S. has a disproportionately large uninsured population when compared to countries […]
- The Rich Live Longer Everywhere. For the Poor, Geography Matters.
Article You May Have Missed: The April 11, 2016 issue of the The New York Times featured the article, “The Rich Live Longer Everywhere. For the Poor, Geography Matters.” This […]
 A Model to Mitigate Hunger
By Sharon Kandris It’s clear that hunger and food insecurity are growing problems in Central Indiana. We’ve recently partnered with two Central Indiana organizations (Northside Mission Ministry of Second Presbyterian […]