
The 18th annual Spirit & Place Festival, a long-time project of The Polis Center, explored the 2013 theme of Risk through 30 community programs that toed the line between safety and danger, ease and discomfort, and security and uncertainty. For example, the opening event, $20K: A Competition about Race, featured four innovators who presented their daring ideas for reshaping the notions of race in Central Indiana. Find out who won the $20,000 prize here.
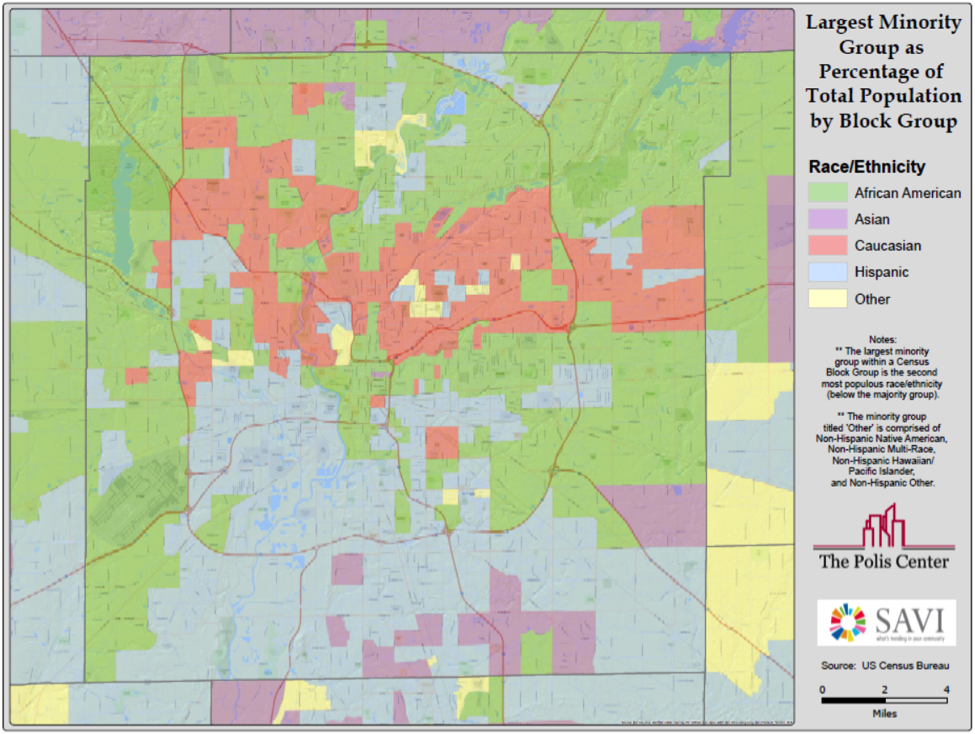
As the Spirit & Place team prepared for the big event, we had to wonder: what does the demographic breakdown look like in Central Indiana? We know that, overall, the majority race in Central Indiana is Caucasian. And it’s fairly common to see demographic data mapped to highlight which race is dominant in a particular geography, e.g. a block group. But we wanted to visualize the data a little differently. So instead of mapping the dominant race by block group, we mapped the second most dominant race…or in other words…the most dominant minority.
Here’s what it looks like.

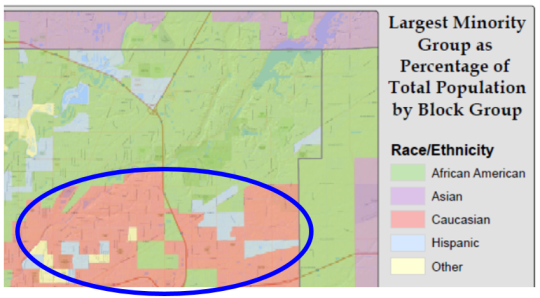
To further clarify, I’ll give a specific example. The red areas of the map show that in this area, just north of downtown Indianapolis, Caucasian is not the majority race; it is the second most dominant race, or the largest minority group.
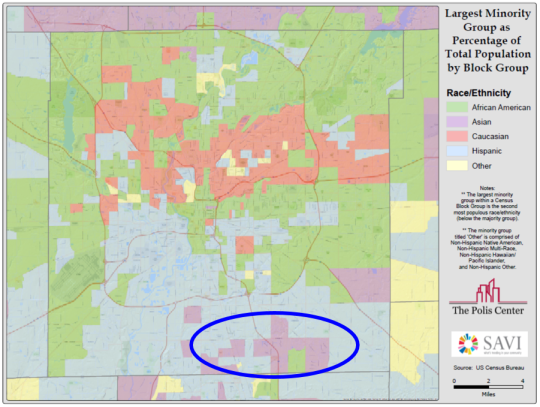
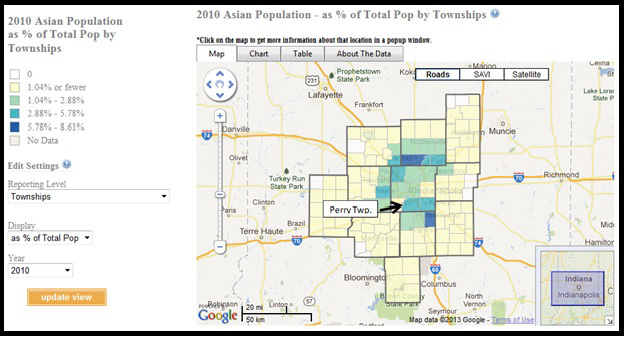
Here’s another interesting pattern that emerged. Note the pockets of Asian population in the south central part of Marion County. While Caucasian is still the majority race here, the second most dominant race is Asian, a trend likely caused by the recent growing Burmese refugee population that has settled in Perry Township.
Next Up
 An Update on Domestic Violence in the Criminal Justice System: Marion County, IN
Read the Report Report published in November 2014 Overview Up until the April 2014 report on Domestic Violence in the Criminal Justice System, it had been very difficult to generate […]
- Domestic Violence in the Criminal Justice System: Marion County, IN
 New Demographic Trends Emerge in Marion County’s Growing Population
By Jay Colbert In celebration of Asian-Pacific American Heritage Month, I thought I’d explore some of the changing population trends in Indianapolis with regards to this demographic. Auch der Verband Pro […]
 Changing Diversity in Marion County (1990-2010)