Greenspace Assessment for Marion County
A special thank you to Keep Indianapolis Beautiful (KIB) and the Environmental Resilience Institute (ERI) at IU Bloomington for their help in compiling data1 used in this report.
Matthew Dietrich, Danielle Lafever, Asger Ali, Aaron Olson
What is greenspace?
Greenspace is a term used in many different contexts, and while generally meaning the same thing (natural, outdoor space containing some sort of vegetation), there are many subtle differences in how it is defined. These differences occur in everyday discourse as well as in academic papers—there really is a lack of consensus. For example, some may consider a simple roadway median to be greenspace, while others expect a median to have trees or vegetation other than grass if to be considered greenspace. Green roofs are another example—if a particular green roof cannot be used or even seen, some may not consider it greenspace. However, the positive environmental effects of a green roof may lead others to consider a green roof as greenspace worth documenting.
Regardless of how one defines greenspace, there are many important benefits for communities, particularly in urban settings.
Why is greenspace important for communities?
While relationships between greenspace and human and environmental health can be complex, in general greenspace has been associated with beneficial effects for human health and the environment. For example, research has found greenspace to be related to a reduction in incidence of all-cause mortality, Type II diabetes, preterm birth, and cardiovascular mortality. Additionally, greenspace can reduce the negative influence of urban areas on the environment by reducing overall atmospheric particulate matter pollution and mitigating the urban heat island effect.2 Indianapolis is known to have a significant urban heat island effect due to its large, sprawling metropolitan area. Check out the figure below illustrating how nearly every census tract in Marion County experiences a significant daily increase in temperature due to the urban heat island effect.
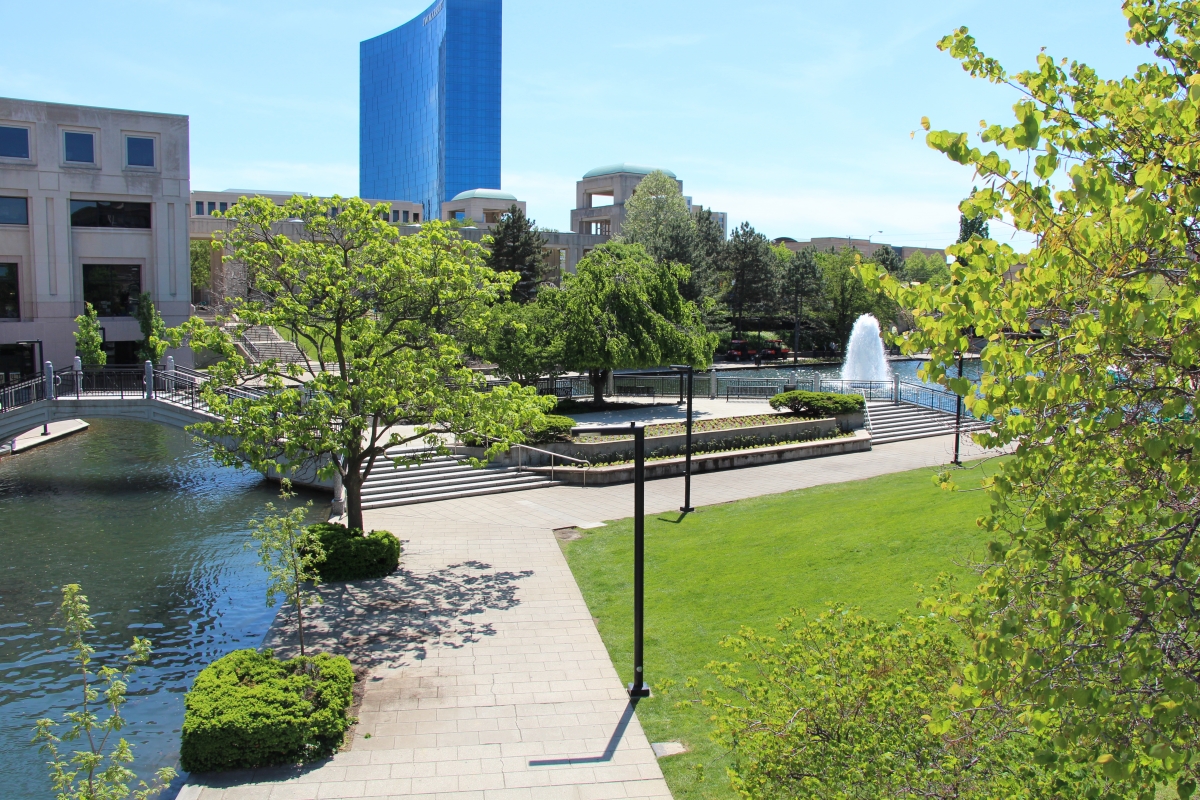
Common examples of what is considered greenspace
Parks
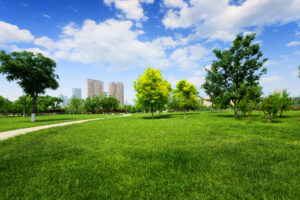
Green trees and grass field in park
Gardens
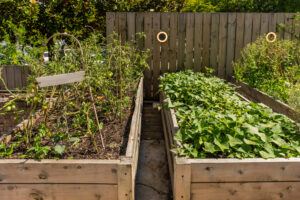
Edible courtyard garden
Areas providing an ecosystem service (such as a habitat for pollinators)
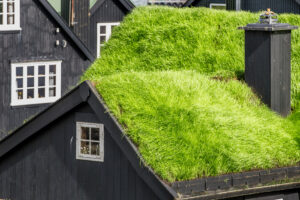
Green roofs lessen stormwater runoff
Vegetated areas
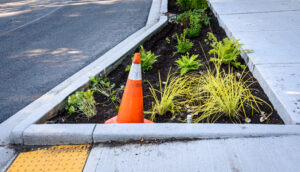
Vegetation in traffic median
Recreational areas

Playing Frisbee in a recreational area
Undeveloped land
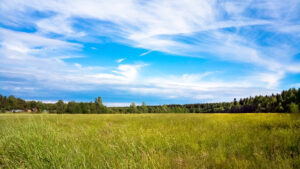
An undeveloped field

While heat waves exacerbated by the urban heat island effect and climate change have led to excess mortality in many cities in recent years (i.e., thousands of deaths in Europe in 2022), air pollution has led to millions of deaths throughout the world each year, with an estimated 6.7 million deaths in 2019. Fortunately, ambient outdoor particulate matter, a major air pollution culprit, can be reduced through both green roofs and trees in many urban settings. Explore the interactive chart below to see how annual deaths from outdoor particulate matter pollution have changed across the globe over the last several decades.
How did we measure greenspace needs and priorities for Marion County?
Quantifying greenspace is a challenge, as data is difficult to come by and often tedious and time-consuming to analyze. To inform decisions on which census tracts should be prioritized for greenspace development in Marion County, we developed a “greenspace priorities index” using several different human, environmental, and physical factors.
Greenspace community need
The overall greenspace priority index is comprised of three sub-indices. The first sub-index is greenspace community need (GCN)3, which includes variables such as amount of small particulate matter (PM2.5) and prevalence of diabetes within a census tract. The greater the greenspace community need, the greater the expected impact of additional greenspace within a community.4 Unlike similar indices, such as the ParkServe park priorities map, we elected not to include race or income as metrics, so we could compare those metrics separately with our GCN sub-index and the overall greenspace priorities index to identify equity issues throughout the community. As we discuss later, this is important to assess because greenspace access has an inherent equity component. Recent research suggests that greenspace tends to have greater protective health effects for those with lower socioeconomic status relative to those with higher socioeconomic status.
Greenspace land development potential
The second sub-index that went into our overall greenspace priority index was the greenspace land development potential (GLDP). This essentially estimates the amount of land that is not already greenspace and could be potentially turned into greenspace. This is difficult to estimate at the census tract level, but we compared the share of land that was not an impervious or agricultural surface with land that was already being utilized as greenspace to make assumptions about tracts that still had greenspace development potential. The higher the GLDP, the greater the amount of land theoretically available for greenspace.
Current greenspace
The last sub-index in our overall greenspace priority assessment is current greenspace (CG) within each census tract. While not inclusive of every form of greenspace, it encapsulates the primary sources of greenspace within Marion County, such as tree canopy cover, native planting areas, and parks. Unfortunately, greenspace data is difficult to compile at a granular level and is time-intensive to update. Thus, while our CG assessment is likely a good first-order estimate, there are likely discrepancies and updates that have occurred to greenspace in Marion County since data compilation. For example, the tree canopy cover data is from 2013, and has likely changed within the last decade. Each of the individual variables that went into the CG calculation were normalized to a percentage of land cover within each census tract, done by Geographical Information System (GIS) techniques.5 Unlike the ParkServe park priorities map, we elected to not limit our measurements of greenspace to parks, because of the many beneficial services that greenspaces other than parks may have, such as native planting areas.
Final greenspace priority index
The total composite greenspace priority index (GPI) was calculated by combining the three component sub-indices: greenspace community need, greenspace land development potential, and current greenspace. Greenspace community need and greenspace land development potential were added together, then current greenspace was subtracted because areas with a large amount of current greenspace should not be prioritized as heavily for new greenspace development. The final GPI ranged from possible values of –1 to 2. The higher the value, the more a census tract area should theoretically be prioritized for greenspace development.
Spatial and demographic trends with greenspace priority index
Upon mapping the greenspace priority index values, nuance and variability in greenspace needs throughout Marion County became apparent. For instance, where there are large state parks, e.g., Eagle Creek and Fort Harrison, there is little greenspace priority. However, in some tracts near these parks, there is high greenspace priority based on access to greenspace and community needs within those tracts. Importantly, we kept analyses of data focused within a tract when determining greenspace priority, because we did not want to assume that those within a tract could simply travel to other locations within the county with greater greenspace access. Additionally, many health benefits of greenspace are more localized.
Greenspace indices and socioeconomic variables
Use the >> button on the top left of the interactive map below to toggle between different layers.6
As mentioned previously, it is also important to assess greenspace priority in the context of socioeconomic variables, such as race and income. Due to historical inequities related to practices such as redlining, access to modern greenspace and the associated benefits may be less for low-income residents and/or individuals from minority groups. When examining the final greenspace priority index side-by-side with median household income and percentage of the Black population7 by census tract, there are several areas within Marion County where there is both greenspace need and a high proportion of low income and/or Black individuals. One area with high greenspace priority, low average household incomes, and a high proportion of Black residents is the Far Eastside/Arlington Woods/Lawrence neighborhoods south of Fort Harrison State Park. The West Indianapolis area and portions of the Mars Hill neighborhood have a high proportion of lower median household income individuals and high greenspace priority, while Pike township in NW Marion County has a high greenspace priority index where there are census tracts with high proportions of Black residents.
Compare greenspace need and race/income simultaneously
However, there is a nuance in the associations of our greenspace priority index and household income and race when looking at the entire county. For example, when looking at all census tracts in Marion County, there are weak to no relationships between our greenspace priority index and the percentage of the Black population or median household income. This is because there are several areas within Marion County where we calculated a high greenspace priority index, but the areas also contained either a lower proportion of Black residents and/or a higher median household income. For example, the Pike township area of NW Marion County has a higher proportion of Black residents than many other areas within Marion County, but also generally has greater median household incomes. Another area leading to the lack in overall county trends is the high greenspace priority tracts within southern Marion County, around Southport, where median household incomes are slightly higher on average, and the percentage of Black residents is quite low.
Collectively, the complexity and nuance between spatial associations of greenspace priority and socioeconomic characteristics such as race and income point to the need to have more localized insight on greenspace needs and priorities from communities that live in these spaces. However, areas that are low-income with proportionally higher Black populations in tracts with high greenspace priority might be prioritized because of inequities stemming from practices such as redlining.
How can our greenspace priority index be utilized—next steps
While our index provides a reasonable first order estimate into greenspace needs at the census tract level in Marion County, it is just that—an estimate. While we considered many different factors to make as holistic an assessment as possible, there are several limitations to our approach, such as the granularity of the data, missing greenspace data, semi-quantitatively assigning weights to variables in our index calculations, and physical changes in greenspace (i.e., tree cover) that have occurred since we obtained the data.
These limitations and the fact that there are estimated greenspace needs in many different parts of Marion County illustrate the need to ground truth the data in areas flagged for potential greenspace development priority. This means working with local communities to see if they want greenspace, how they want it, and where they would want it. An example would be something like AES Indiana Project GreenSpace, where neighborhoods can apply for grants to work with Keep Indianapolis Beautiful (KIB) and landscape architects to develop appropriate greenspace that best suits their neighborhood. Thus, organizations can theoretically use our greenspace index to help narrow in on census tracts where focus may be needed.
It is important to keep in mind the additional equity component mentioned earlier—that there are clearly several areas in Marion County with a high proportion of low-income and/or Black individuals with poorer greenspace access. These areas should be targeted for further greenspace development and community engagement due to the health and economic disparities already existing in these areas that better greenspace access could help address.
Plans with greenspace index and SAVI moving forward
Our greenspace priorities index will soon be incorporated into the SAVI infrastructure within the “Environmental Topic Profile” page. Here, it will exist as an interactive layer much like the current environmental layers such as tree canopy cover and access to parks and greenways. Like all components of SAVI, it will be freely and publicly available to utilize for both visualization and data download.
Although greenspace data is less frequently collected and difficult to come by, our hope is to update the greenspace priorities index every 2-3 years based on data availability and access. While data from sources such as the American Community Survey and Climate Economic Justice Screening Tool are more regularly updated and easy to access, actual greenspace data such as tree canopy cover and native planting areas takes longer to collect, update, and make publicly available.
Moving forward, the calculations and inputs for our greenspace priority index will also likely change based on community input, access to data, and computing capacity. More data analyses of other important factors associated with greenspace such as crime may also be incorporated over time.

Conclusions
Greenspace is an important component of urban centers and can have many beneficial effects for both humans and the environment. However, greenspace is not equal across an entire urban center, nor can it be developed in the same ways throughout a city. Based on a holistic and comprehensive assessment of greenspace needs in Marion County, we made estimates on where further greenspace development should be prioritized. While there is spatial variability in greenspace priorities throughout the city of Indianapolis, there are areas that clearly require attention, particularly lower income minority areas that are still experiencing the effects of historic inequities. Our greenspace priorities index will hopefully provide a starting point for deeper community assessment and engagement for neighborhoods needing more greenspace development and prioritization.
- Data in the report obtained from ERI’s Green City Mapper is available here.
- The urban heat island effect refers to urban areas having higher temperatures on average than more rural surrounding areas, because human-made structures such as buildings and roads absorb and re-emit the sun’s heat more so than green, vegetated areas. (https://www.epa.gov/heatislands)
- Each variable was chosen based on data availability at the census tract level for Marion County, significant negative or positive association with greenspace based on the peer-reviewed literature, or clear impacts on community access to greenspace, such as having a car for transportation to access parks possibly in other tracts. Weights were semi-quantitatively based off documented relationships in the literature, but variables for the GCN were generally given equal weights.
- Need for all sub-indices calculated is relative to Marion County. Each variable included in each sub-index calculation was normalized as a percentile relative to its rank in Marion County. The index calculations are based on weights multiplied by the percentile of each variable.
- In ArcGIS, our analyst team calculated the area each current greenspace variable’s shapefile took up within the total land area within a census tract. These proportions were then normalized to percentiles based on how each greenspace measurement ranked within Marion County before multiplying by a weighting factor and summing into the total sub-index value.
- Income and racial data are from the 2019 5YR ACS survey to keep consistent census tract boundaries for data gathered from the Climate and Economic Justice Screening tool.
- The percent Hispanic population was also examined, but due to large margins of error and thus high uncertainty in the data from the American Community Survey, it was not included. Oftentimes, the 90% confidence interval of Hispanic population estimates ranged the entire estimated average population within a census tract.