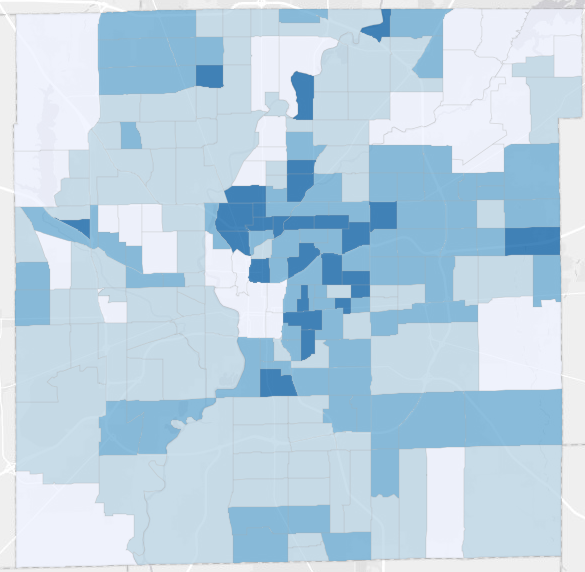
We added two new maps to the Coronavirus Data Hub. One looks at Marion County COVID-19 Cases by Zip Code . The zip codes with the highest rates include 62 percent of Black residents. Zip codes with low rates include only 26 percent of Black residents. The other looks at Marion County Neighborhood Unemployment Claims. This map shows total new and continuing unemployment claims from March 14-May 30, 2020 divided by the population age 16-64. Unemployment increased in all areas of Marion County, but mid-north, northeast, and eastside neighborhoods experienced the most unemployment claims compared to their population size. The corridor along 30th Street from Crown Hill to Martindale/Brightwood is particularly hard-hit by unemployment
SAVI Coronavirus Data Hub Looks at Neighborhood Unemployment Claims