Every spring and fall, SAVI staff attends the National Neighborhood Indicators Partnership (NNIP) meeting, which was held in Pittsburgh this year. It’s a great opportunity to collaborate with and learn from the NNIP’s diverse and extensive group of partners in 35 cities that developing neighborhood information systems like SAVI.
This year, Sharon Kandris, Director of SAVI, and Jay Colbert, SAVI Project Manager, share with you their top takeaways from the event.
Sharon’s top 4 takeaways:

-
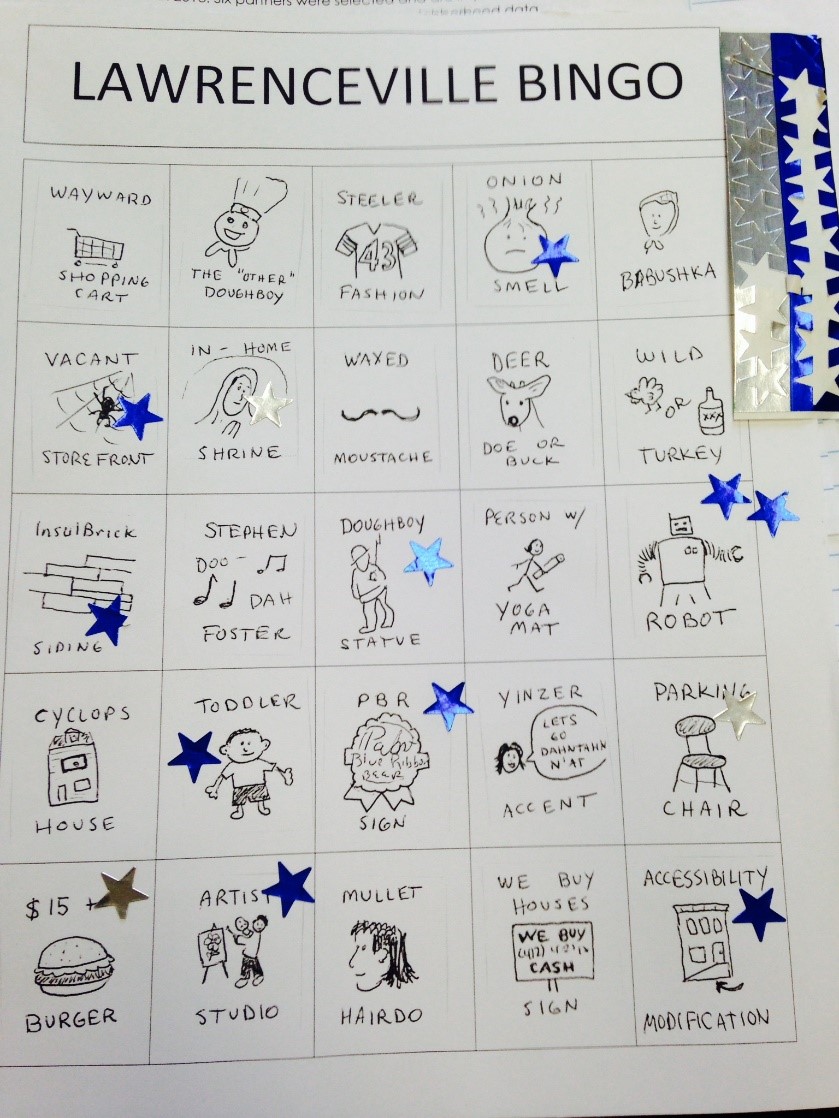
Neighborhood Bingo:
…is an awesome way to learn about a neighborhood! I toured the Lawrenceville neighborhood in Pittsburg and discovered its history and culture and learned some new terms:
- Parking chair: any kind of chair placed on the road to reserve a parking spot.
- Cyclops house: a house with one giant window in the front.
- Yinzer accent: an American English dialect also known as Pittsburghese
- BINGO!
-
Open Data:
While there was not a session specifically around Open Data, the topic kept emerging throughout the conference. Many of partner cities are finding ways to open the data in their neighborhood information system to make it easily downloadable.
What does Open Data mean? According to the Open Data Handbook: “Open data is data that can be freely used, reused and redistributed by anyone – subject only, at most, to the requirement to attribute and share alike.”
SAVI is an avenue for making government and nonprofit data accessible to anyone. We use special procedures to make otherwise confidential data available in a format that’s sharable and geographically specific to your community or service area.
For those already using ArcGIS Server, ESRI has an open data platform that makes opening your data fairly easy.
![]()
-
Community Health Assessments:
Many NNIP partners are making significant progress helping their local hospitals fulfill the requirements of the Affordable Care Act (ACA) to develop community health needs assessments (CHNA).
However, they are figuring out that it’s not just about using their neighborhood information system to support the hospitals, but it also is an opportunity to engage hospitals in improving neighborhoods.
To learn how SAVI is being used to support CHNA Indiana, read “Local Health Maps: When Funding Follows Illness” in our online magazine.
-
Integrated Data Systems (IDS):
IDS link together data about individuals from government and other sources to gain a better understanding of service delivery. For example, Case Western Reserve University in Cleveland is linking data from the school system, juvenile system, foster care, homeless system, and others to better understand early adult outcomes for 9th grade cohorts in the Cleveland public school.
Other examples of uses:
- Tracking children through the education system to see where they stop out and what factors might be related.
- How individual, family, school, and neighborhood factors effect student absenteeism over elementary and middle school. (Pinellas County, FL)
- How housing and neighborhood characteristics and involvement in human service systems impact chronic absenteeism. (Pittsburgh)
Jay’s top 4 takeaways:

- NNIP Partners have access to GeoLytics National Change Database (NCDB) software. This software includes a myriad of census variables from 1970 – 2010. But the neat part of the software is that all of these variables are aggregated to 2010 Census tracts. We all know that census tracts change significantly each 10 years, making time-series analysis challenging, but this tool can take a lot of the pain out and allow for much improved results.
- Sharon and I shared some of our newest SAVI tools with the NNIP membership. Every NNIP meeting includes a rapid-fire “IGNITE” presentation where each presenter has 5 minutes to present a subject. Often it is a new tool that a partner city is using or has developed. I gave a presentation on our new SAVI Indices tool and SAVI Advanced.
NOTE: We are teaching free classes on these tools, so SIGN UP TODAY.
- All NNIP partners are interested in jobs data which can take many forms. There is data on where “workers” live which is easily obtained from Census data. There is also data on where “jobs” are which can also be obtained from a different set of Census data. But NNIP members are in search of a new dataset that links the two together by measuring workers access to jobs. The New York Times recently cited a Harvard study that suggests that the most important key to lifting people out of poverty is commuting time. Reliable transportation is important whether it’s private or public transportation.
- There is a lot of neat history in Pittsburgh. I walked to Point State Park which includes a museum and original footprints of Fort Duquesne and Fort Pitt. Known as the Three Rivers, the forts stood at the confluence of the Allegheny, Monongahela, and Ohio rivers. The French built Fort Duquesne in 1754 at the beginning of the French and Indian War. In 1758, the French abandoned and burned Fort Duquesne and the next day the British arrived and started building Fort Pitt around which grew the settlement of Pittsburgh.
Next Up
 The Crucial Role of Data in Improving Public Health
It’s a common question: Where should public health departments allocate their limited resources to address the most pressing health issues? The Polis Center, the Regenstrief Institute, the IU Richard M. […]
 Worlds Apart: Gaps in Life Expectancy in the Indianapolis Metro Area
 Binford Redevelopment and Growth, Inc. (BRAG)
 Maps Show Need for Suite Dreams Project Play Garden near Riley Hospital for Children
In an effort to re-develop the once abandoned Ball Nurses’ Sunken Garden and Convalescent Park, The IU Foundation proposed The Suite Dreams Project Play Garden, which would restore the sunken […]