Our research is focused on equity in the economy, housing, criminal justice, health, race, age, gender, and more.
Indianapolis Racial Equity Report Card
On June 20, in partnership with WFYI Public Media, The Polis Center presented SAVI Talks: The Indianapolis Racial Equity Report Card webinar. The effort identifies racial disparities and inequities in several key areas affecting quality of life and our economy.
This baseline report shines a light on areas for improvement and will allow us to track how we are doing as a community moving forward. These important data can be used to shape programming, inform policy and planning, justify grants, and educate stakeholders working together to address the underlying drivers of these inequities and disparities.

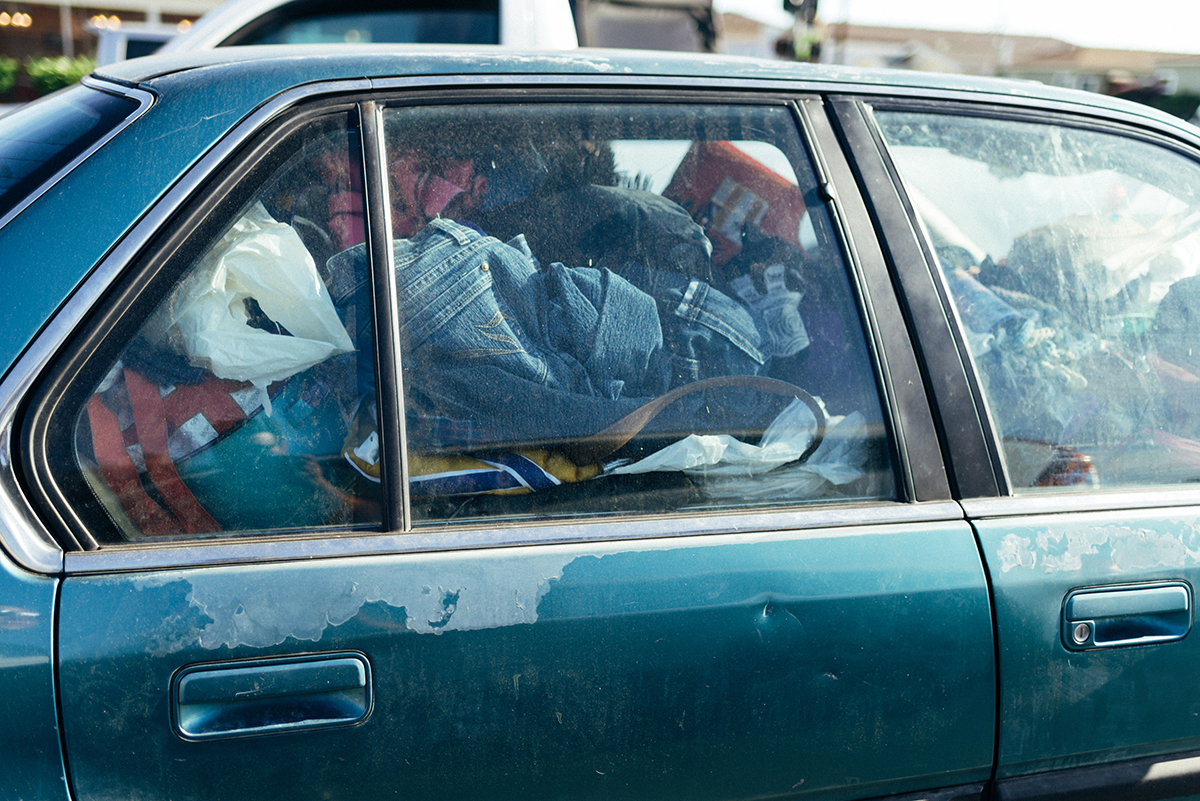
Empowering Indiana Communities with Evictions & Foreclosure Data
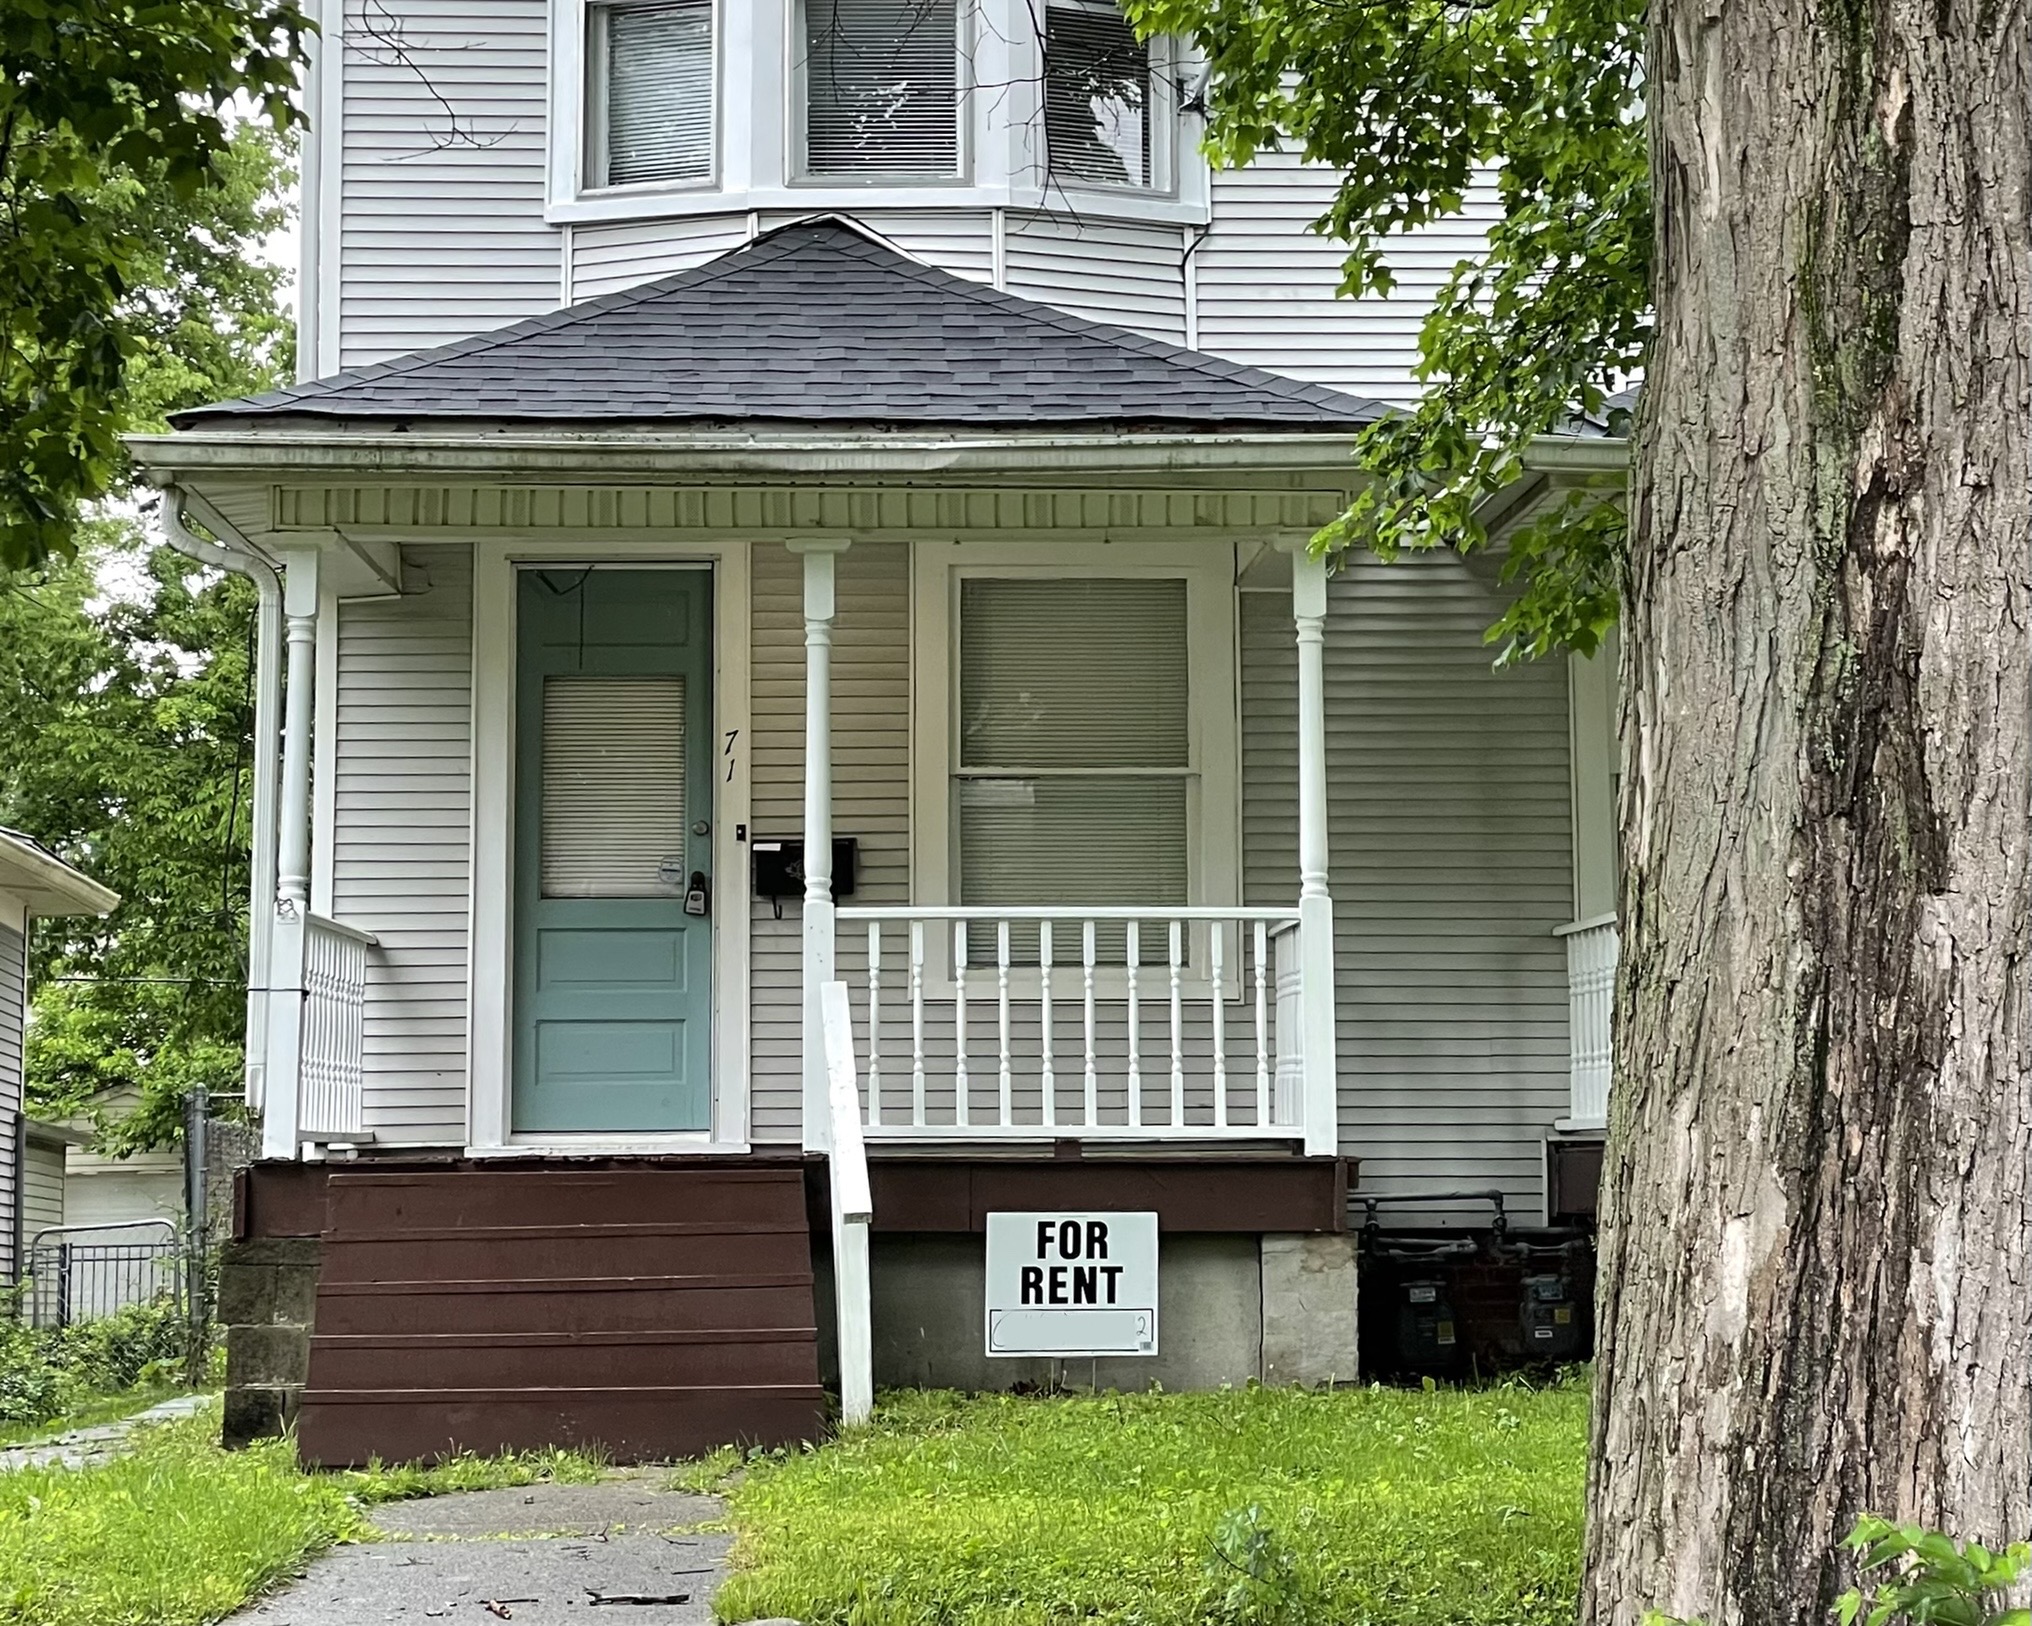
Using its expertise in research, data integration, analysis, and visualizations, The Polis Center developed a new statewide tool to help users better understand trends and relationships between evictions and societal factors. The goal is to raise awareness of evictions in Indiana and provide an easy-to-use online resource to empower communities to instill change. The dashboard features many resources for tenants, researchers, and stakeholders. Real stories of people experiencing evictions have been captured to give context to the data. The dashboard was presented during the Dec 7 SAVI Talks event. The evictions dashboard is available here.

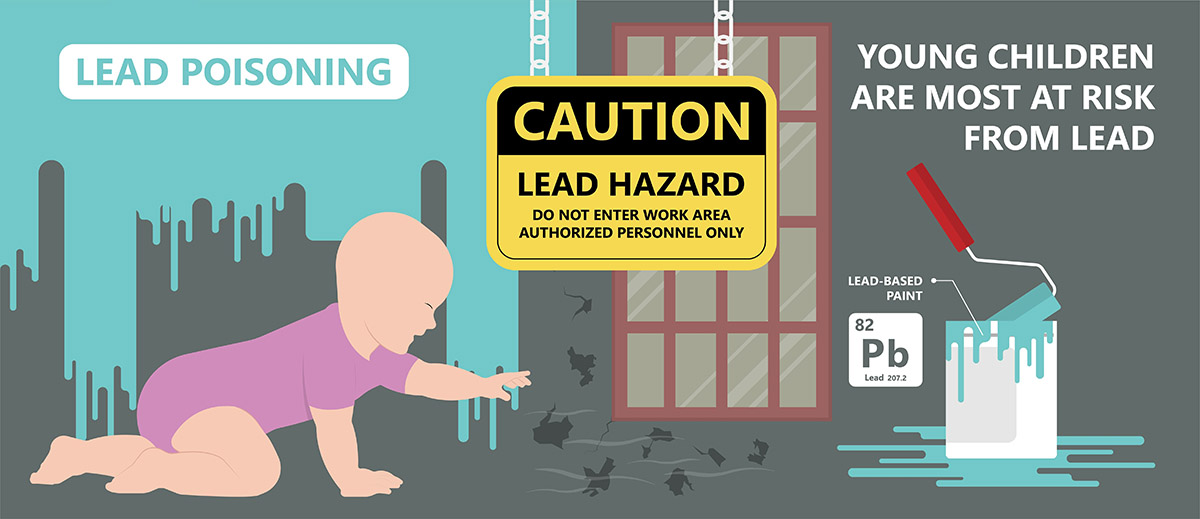
Lead exposure in the Indy East Promise Neighborhood
At the August 24 Data & Drafts event, cosponsored by IndyPL, WFYI Public Media, and Bier Brewery, we presented findings from our analysis of the state of childhood blood levels in Marion County. We looked at childhood lead exposure in Marion County, its impacts, and what can be done, with a particular focus on the neighborhoods of Martindale Brightwood and the Near Eastside. You can check out the presentation slides and read our analysis of lead exposure in the Indy East Promise Neighborhood.

Academic Standardized Test Scores for the Hearing Aid Assistance Program of Indiana (HAAPI) Participants and Applicants
Hear Indiana is partnering with the Polis Center to investigate educational outcomes for deaf or hard of hearing (DHH) children in Indiana who use hearing aids and communicate through spoken language.
This report summarizes our findings related to academic standardized test scores (IREAD, ISTEP) for DHH children who use hearing aids and communicate through spoken language as identified by HAAPI applicant data between 2014 and 2021. We find that these children have test scores comparable to or exceeding statewide averages in Math and English Language Arts (ELA). The findings provide evidence that DHH children who use hearing aids and communicate through spoken language can excel academically.

Equity in Criminal Prosecutions: Analyzing Case Filings from the Marion County Prosecutor’s Office
The Kheprw Institute and The Polis Center are partnering to better understand the criminal justice system in Marion County and investigate potential disparities. This report is the next step in several prior analyses and reports examining the local criminal justice system.
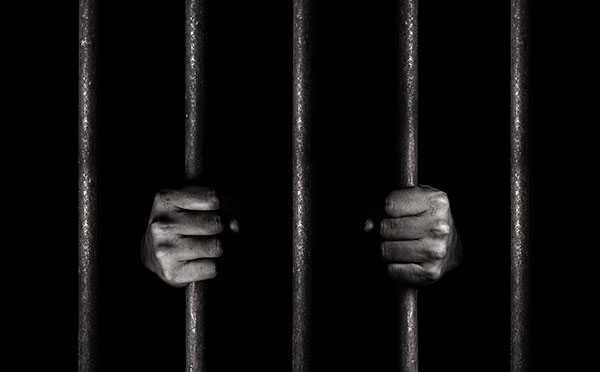
Previous research from the Polis Center estimated that Black residents of Marion County were 2.7 times more likely to be jailed than their white counterparts in 2018 and 4.4 times more likely to be imprisoned in 2016. Significant progress has been made to narrow the racial gaps in both the prison and jail population, but that has slowed in recent years. Building off this research, Polis examined more than 283,000 bookings in Marion County jails between 2013 and 2021 to understand the jail population. Despite a significant drop in the jail population during the COVID-19 pandemic, jail levels have mostly returned to pre-pandemic numbers.

Transportation Equity and the Older Adult Population
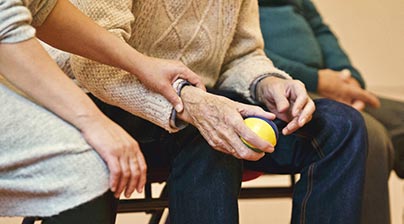
Access to transportation is important because it empowers older adults to maintain their independence. Transportation opportunities for older adults may take different forms, including driving, public transportation, ride-share service, or shuttle buses. This report discusses public transportation access and perceived transportation barriers. Key findings include in Indianapolis, approximately 76,000 people age 65 or older live too far away from an IndyGo stop to likely use transit. That represents nearly two thirds of people age 65 or older in Indianapolis. This partnership includes The Polis Center, and the Central Indiana Senior Fund, a fund of the Central Indiana Community Foundation.

Indianapolis Racial Equity Report Card
Community Feedback Draft
We are developing an annual report card to hold ourselves and our community accountable for addressing equity gaps in the economy, health, education, and more. We need your input to understand what to measure and what solutions your neighborhood or community has undertaken.

Follow the Money: Indianapolis Evictions in 2022
Eviction filings are on the rise compared to last year, but still lower than before the pandemic. Most evictions are from large owners of big apartment complexes. This article is part of our Data and Drafts series in partnership with WFYI and Indianapolis Public Library

A Decade of Decline: College-Going Rates in Central Indiana
An analysis of Central Indiana high schools shows that declines in college-going rates impact everyone, from affluent suburban communities to economically disadvantaged neighborhoods. This article is part of our Data and Drafts series in partnership with WFYI and Indianapolis Public Library

Who is in the Marion County Jail? Exploring Length of Stay through an Equity Lens
We analyzed more than 283,000 bookings into Marion County’s jails between 2013 and 2021. We used this data to discover how many people are in jail, the characteristics of those in jail, and how long people remain in jail.

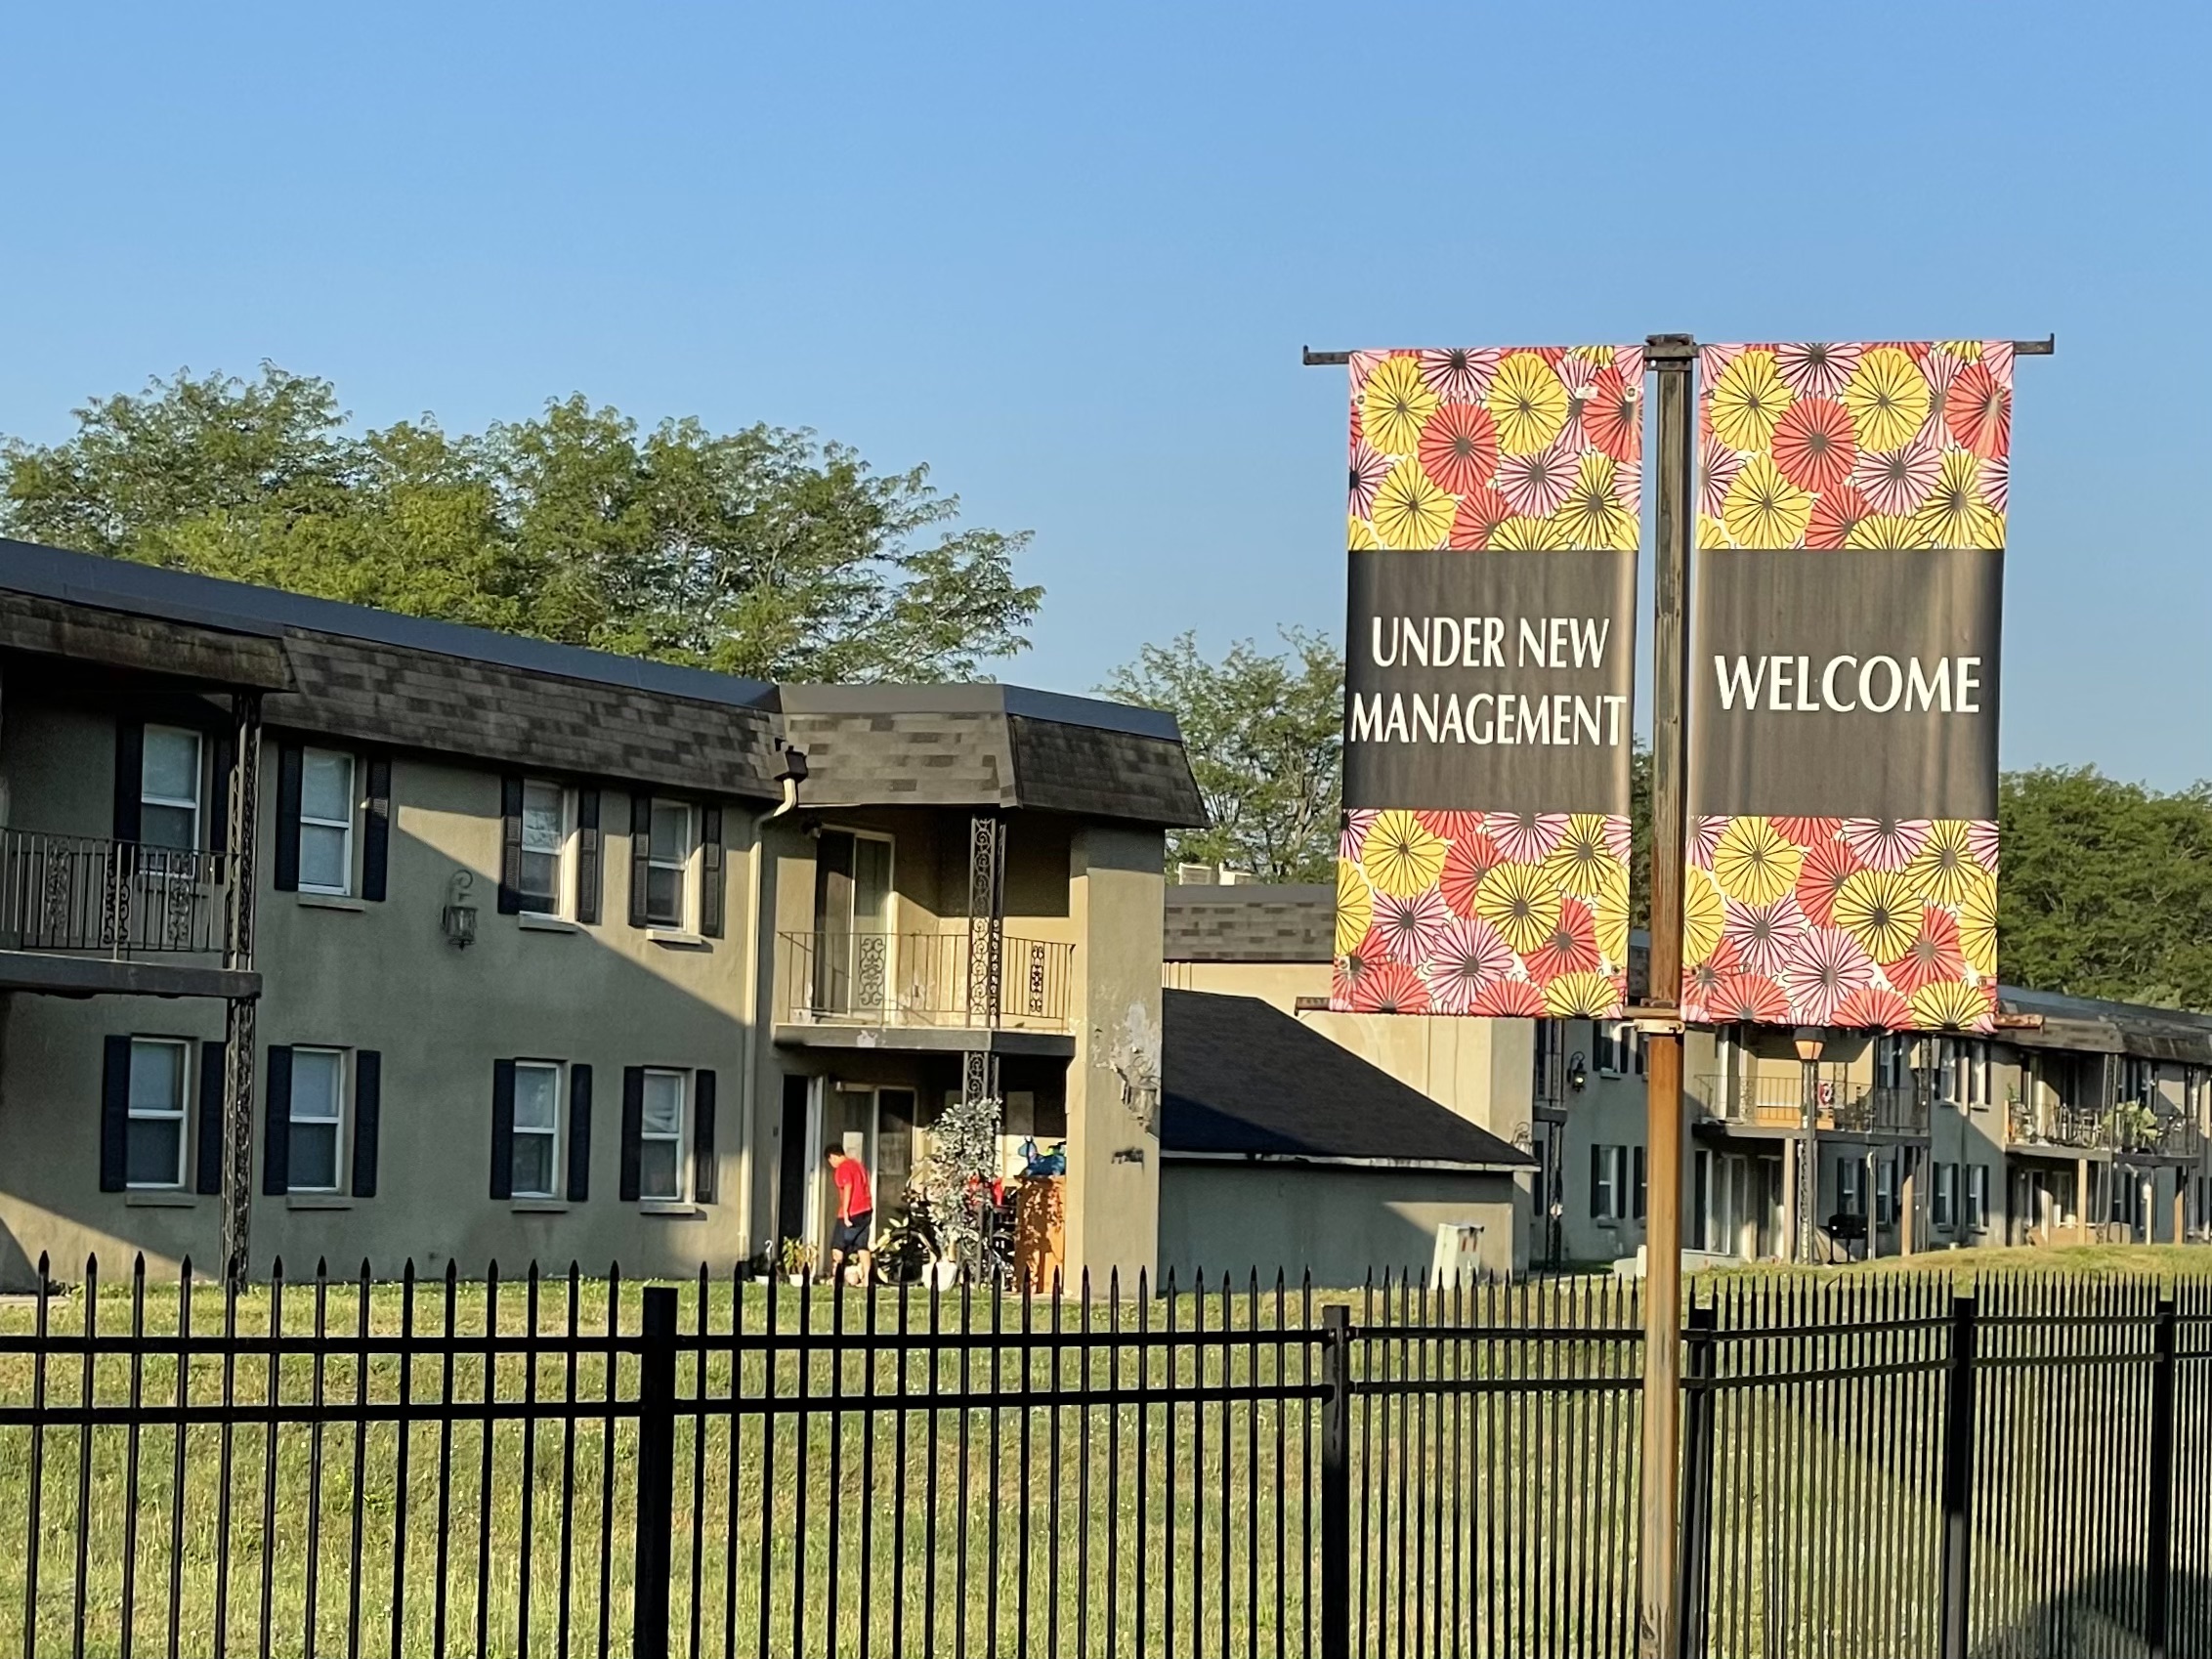
The State of Tenants in Central Indiana
Indiana Senate Bill 230 would have required landlords to make necessary repairs to their properties. We examine the renters impacted by the bill’s failure.

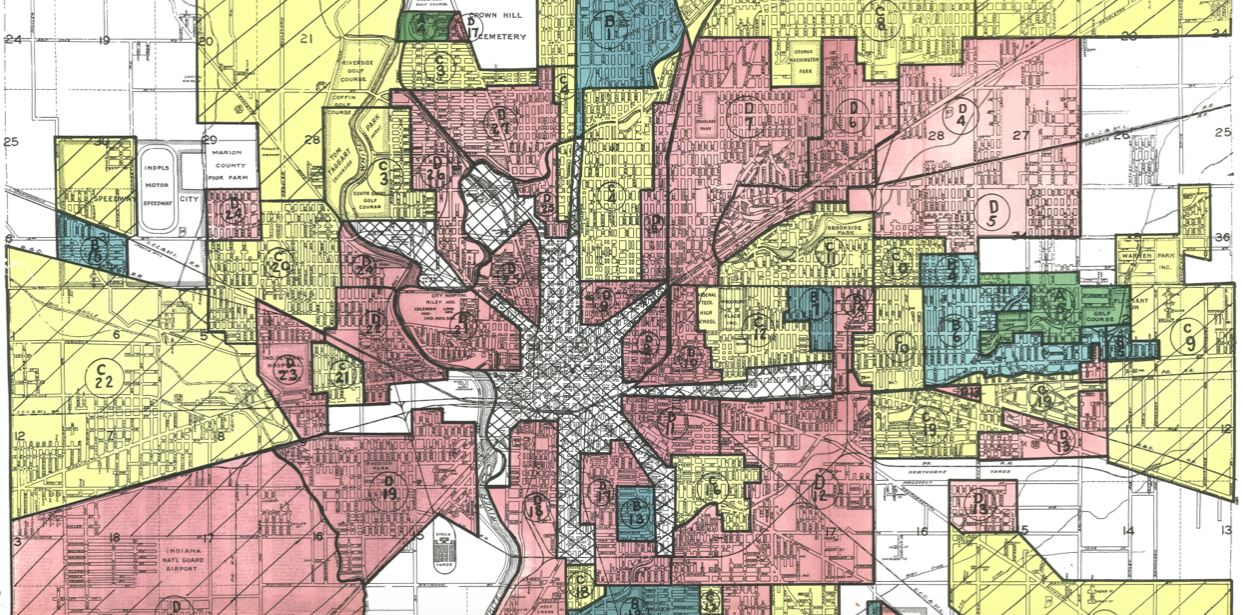
Modern Redlining in Indianapolis?
Our analysis of one million loan applications since 2007 shows that, even when income and debt are the same, Black applicants have 2-3X higher odds of being denied than White applicants, and applying for a loan in a historically redlined neighborhood increases the odds of denial by 50 percent.

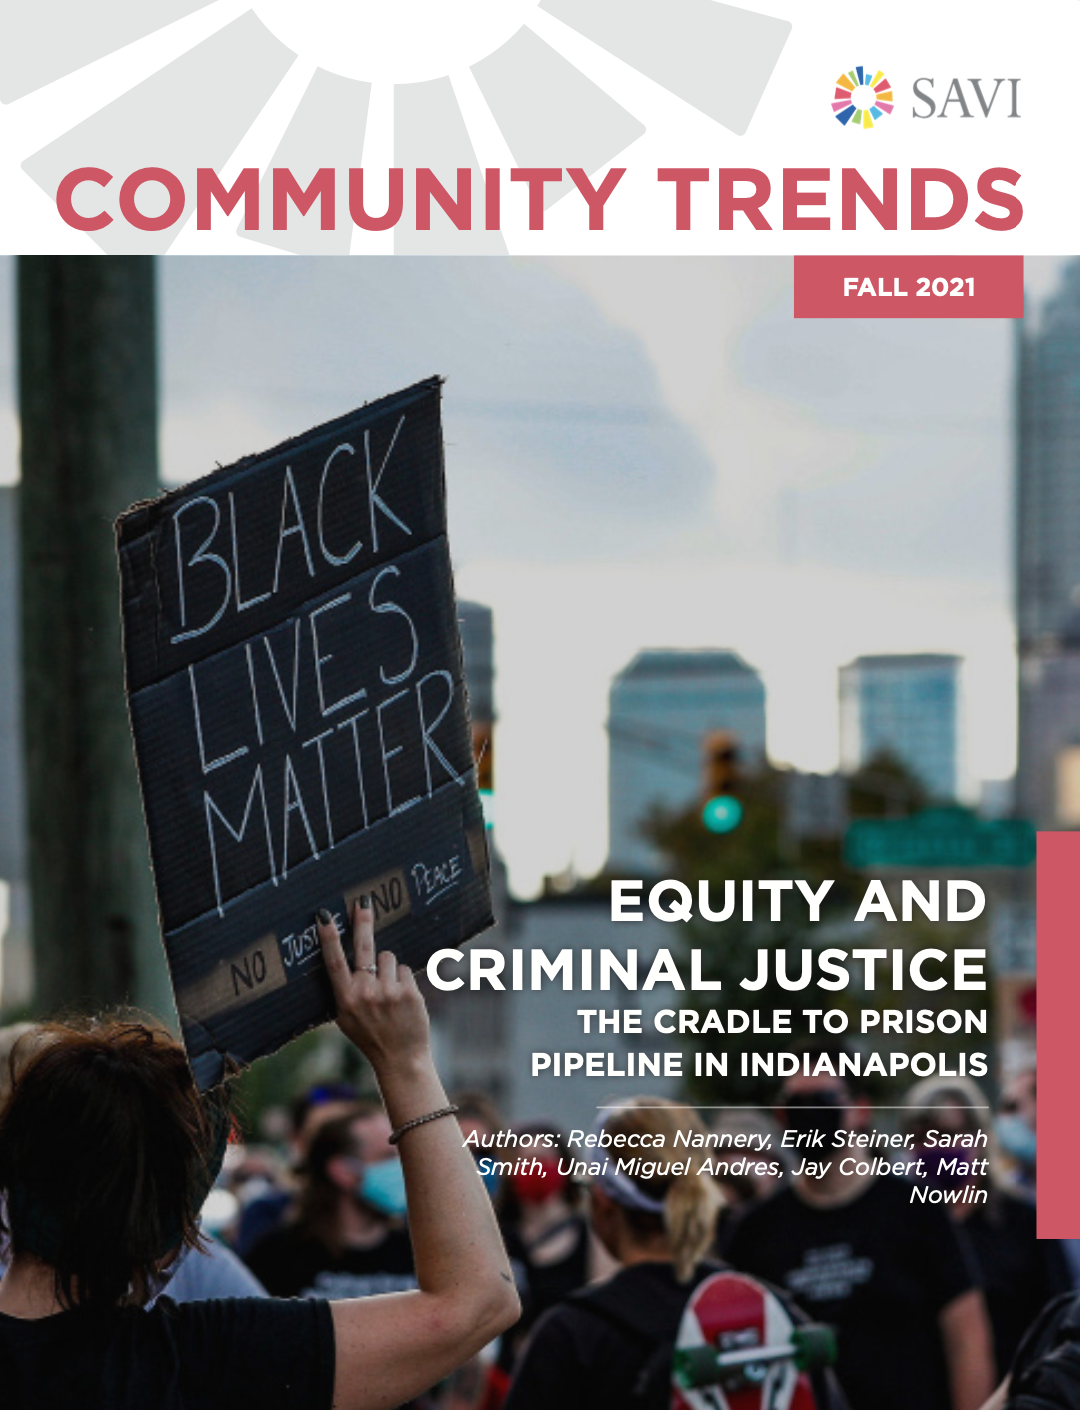
Equity and Criminal Justice
Black Hoosiers are twice as likely to be jailed and 4.5 times as likely to be imprisoned as their white peers. However, these disparities exist long before an individual is imprisoned. From the place and situation into which a child is born, to the discipline and juvenile justice policies in their school and community, a person’s childhood experience influences their likelihood of being involved in the criminal justice system.

Worlds Further Apart
Since 2015, the gap in life expectancy between the ZIP codes with the longest and shortest lifespan has increased by 24 percent. ZIP codes with the highest and lowest lifespans are 17 miles apart and half a 17-year gap in life expectancy.
The Lasting Impacts of Segregation and Redlining
80 years after the federal government encouraged lenders to consider “neighborhood characteristics” like race in their lending decisions, redlining and segregation have a measurable impact on economic opportunity, health outcomes, the environment, and violence.

Equity in Economic Opportunity
How race, place, and class impact opportunity in Indianapolis
Children born to low-income families in Indianapolis have worse economic outcomes than almost any other large city, and there are stark disparities for Black children and children who grew up in low-income neighborhoods.

How are you using these data? What other data would be useful for you?

Events
Who is in the Marion County Jail? Exploring Length of Stay
June 16
We examine inmate and booking data obtained from the Marion County Sheriff’s Officem exploring length of stay and the presence of mental health and substance use among Marion County Jail inmates, drawing attention to the characteristics of those with longer lengths of stay or charges that might merit alternative responses in the community or reduced jail time. We also examine racial disproportionalities within the jail, as half of inmate bookings in recent years are from the Black community, in comparison to the racial composition of Marion County, which is only 30% Black.
SAVI Talks: Equity in Criminal Justice
November 18
This SAVI Talk will apply the Cradle to Prison Pipeline framework to the criminal justice landscape of Marion County. We will use it to interpret snapshots of local place-based data that highlight inequities faced by subpopulations from childhood to adulthood, and how policy impacts these inequities.
SAVI Talks: Life Expectancy
August 26
IU Fairbanks School of Public Health is partnering with The Polis Center to analyze gaps in life expectancy across communities.
SAVI Talks: Equity in Aging
April 22
Older adults face issues of equity on a daily basis. The Polis Center, IU Public Policy Institute, and the IU Center for Public Policy Research partner with Central Indiana Senior Fund to highlight these issues and solutions.
SAVI Talks: Equality of Opportunity
March 25
SAVI analysts will present the team’s latest research and WFYI will moderate a panel discussion.

Research Under Development
More equity research is in development, including the following projects.
Revisiting gentrification trends with 2020 Census data
With a full decade of data about block-by-block demographic changes, we can better understand gentrification and displacement.
A neighborhood model of economic opportunity
What drove opportunity in neighborhoods of the 1980s, and what can predict economic mobility for children growing up today?

Measures of Equity
Our equity research agenda will incorporate a community conversation on the key indicators of equity. Until then, here are just a few examples of community-level measures of equity across race, gender, and neighborhoods. For more equity data, visit the SAVI Equity Profile.
Racial Equity
Mortgage denial rate by race
Gender Equity
Median earnings by gender
Neighborhood Equity
Broadband access by census tract

More Equity Research
Reports and articles from 2020 and earlier.
Empowering Indiana Communities with Evictions & Foreclosure Data
More than 3.5 million U.S. households are threatened with eviction each year, a poignant illustration of rising housing costs. And, evictions have been rising steadily across Indiana since the end of COVID-19 eviction protections. The causes of eviction can be...
Empowering Indiana Communities with Evictions & Foreclosure Data
More than 3.5 million U.S. households are threatened with eviction each year, a poignant illustration of rising housing costs. The causes of eviction can be complex, following a synergy of poverty and low wages, rising rent costs, inflation, and drug and mental health...
Greenspace Assessment for Marion County
Greenspace is an important component of urban centers and can have many beneficial effects for both humans and the environment. However, greenspace is not equal across an entire urban center, nor can it be developed in the same ways throughout a city. Based on a...
Equity in Criminal Prosecutions: Analyzing Case Filings from the Marion County Prosecutor’s Office
The Kheprw Institute and The Polis Center are partnering to better understand the criminal justice system in Marion County and investigate potential disparities. Previous research from the Polis Center estimated that Black residents of Marion County were 2.7 times...
2022 Midterm Election Voter Turnout in Marion County
Key points Voter turnout in Marion County is low relative to Indiana and the U.S. Within Marion County, there is great variation in voter turnout between precincts Lower voter turnout in Marion County tends to occur in areas that are less affluent, have lower...
Transportation Equity and the Older Adult Population
Access to transportation is important because it empowers older adults to maintain their independence. Transportation opportunities for older adults may take different forms, including driving, public transportation, ride-share service, or shuttle buses. This report...
Follow the Money: Indianapolis Evictions in 2022
Eviction filings are on the rise compared to last year, but still lower than before the pandemic. Most evictions are from large owners of big apartment complexes.
Who is in the Marion County Jail? Exploring Length of Stay through an Equity Lens
We analyzed more than 283,000 bookings into Marion County’s jails between 2013 and 2021 to discover how many people are in jail, the characteristics of those in jail, and how long people remain in jail. This dataset spans nine years. In that time, state laws changed...
The State of Tenants in Central Indiana
Indiana Senate Bill 230 would have required landlords to make necessary repairs to their properties. We examine the renters impacted by the bill’s failure.
Modern Redlining in Indianapolis?
Our analysis of one million loan applications since 2007 shows that, even when income and debt are the same, having a Black applicant on the loan increases the odds of being denied by 2-3X, and applying for a loan in a historically redlined neighborhood increases the odds of denial by 50 percent.


