Jun 24, 2021 | Equity, Equity Hub

Jan 15, 2020 | Equity, Health
Oct 9, 2019 | Infrastructure
Apr 25, 2018 | Education, Equity
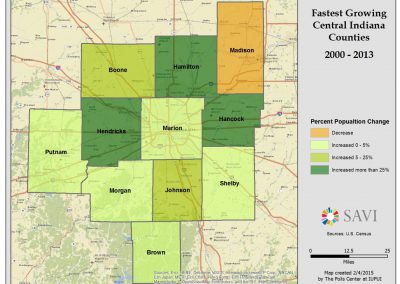
Apr 14, 2018 | Demographics

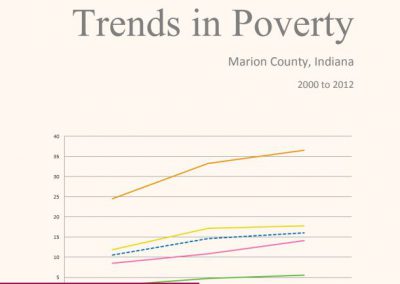
Mar 8, 2018 | Economy
Jan 26, 2018 | Equity, Health

Oct 3, 2017 | Education

Sep 15, 2017 | Infrastructure

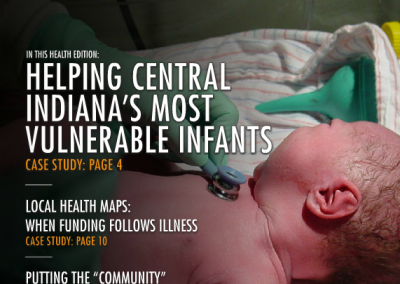
Jul 14, 2017 | Health

Jul 14, 2017 | Health
Jul 14, 2017 | Health
Jun 30, 2017 | Equity, Health
May 6, 2017 | Equity, Health
Apr 27, 2017 | Environment

Apr 7, 2017 | SAVI Tools
Aug 5, 2016 | Infrastructure
May 2, 2016 | Equity, Health
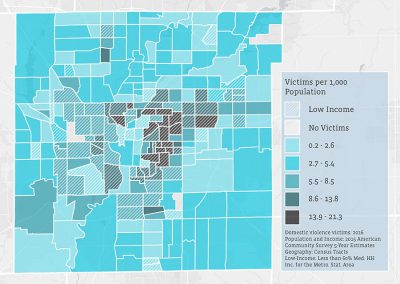
Sep 16, 2015 | Crime & Safety

Jul 15, 2015 | Equity, Health
May 27, 2015 | SAVI Tools
Apr 28, 2015 | SAVI Tools
Mar 11, 2015 | Health, SAVI Tools
Feb 23, 2015 | Demographics
Sep 3, 2014 | SAVI Tools
Jun 5, 2014 | Demographics
Jan 22, 2014 | Economy, Education

Sep 11, 2013 | Demographics

Aug 8, 2011 | Demographics
Jun 8, 2005 | Demographics