Health and Economic Impacts of Covid-19 on Neighborhoods
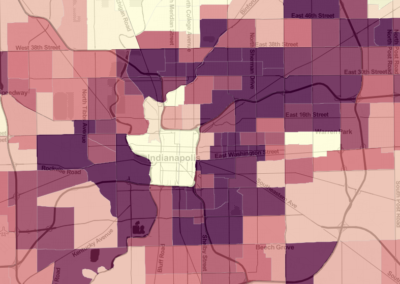
SAVI Talks - October 2020SAVI created a COVID-19 Impact Index. This describes the impact in a ZIP code and its underlying risk in terms of health and the economy. We used indicators like confirmed Covid-19 cases, unemployment claims, and rental assistance applications to measure the impact of the pandemic on neighborhoods. We used the presence of underlying health conditions and socioeconomic conditions to measure a neighborhood’s vulnerability.
The results show that the hardest hit ZIP codes were 46222 on the west side, 46218 near Martindale Brightwood, and 46226 on the northeast side. Some groups are more likely to live in a high-impact ZIP code, including people of color, people living in poverty, and people with a disability.

Percent of residents who are people of color in ZIP codes where Covid-19 impact score is...
Percent of residents with a disability in ZIP codes where Covid-19 impact score is...
Percent of residents living in poverty in ZIP codes where Covid-19 impact score is...
Community Trends Report

SAVI Talks Presentation


Articles and Story Maps
Explore other research and interactive content we have developed about the Coronavirus pandemic.

How is Indianapolis Doing?
A monthly look at how the Indianapolis metro area is recovering and emerging from the Covid-19 pandemic
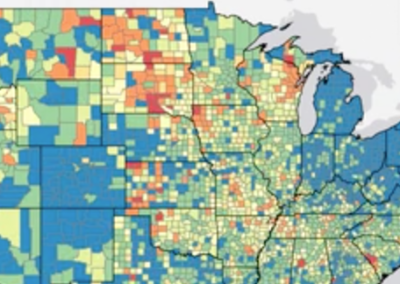
Animated Map of New U.S. COVID-19 Cases Over Time
The incidence of new COVID-19 cases has not been the same over time throughout the country. This animated map shows the 7-day average of new COVID-19 cases per 100,000 people. This allows us to view the spread and incidence of the virus regardless of population ...
Indy Evictions May Reach 34,000 or More in 2020
An increase in unemployment claims could drive the eviction rate from 7 percent in 2016 to 20 percent in 2020, and informal evictions may be twice that.
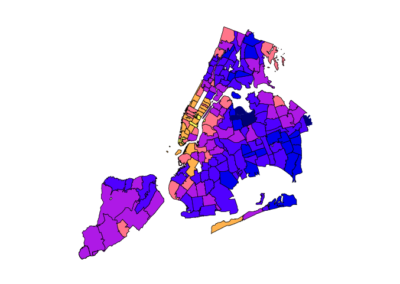
Socioeconomic factors explain why some New York ZIP codes were hit hardest by COVID-19
By comparing New York's COVID-19 test results with demographic and socioeconomic factors by ZIP code, we found that low education levels, crowded housing, and a lack of health insurance are some of the strongest predictors of high COVID-19 positivity rates.
The Inequalities Behind COVID-19 Disparities for African Americans in Indianapolis
COVID-19 positivity rate is 1.8 times higher for blacks than for whites. We explore how systemic inequities put many black individuals at higher risk for getting the virus, having a serious case, and suffering from the economic impacts compared to white residents.
Three Ways to Visualize COVID-19 Race and Gender Disparities
In Indiana, black individuals are 2.4 times more likely to test positive than whites. We look at three different ways to visualize COVID-19 disparities like this.
Authors
Sharon Kandris
Associate Director,
The Polis Center
Jay Colbert,
Data Manager,
The Polis Center
Jeramy Townsley,
Visiting Research Analyst,
The Polis Center
Matt Nowlin,
Research Analyst,
The Polis Center
Event Partners