Where Schools Are Changing: Regional and Neighborhood Dynamics from 2010 to 2016
SAVI Talks - November 2018Schools experiencing similar change tend to be grouped geographically, with rapidly changing schools in more urban areas, and those holding steady in racial and income change located in more suburban and rural areas.
Explore Changing Schools
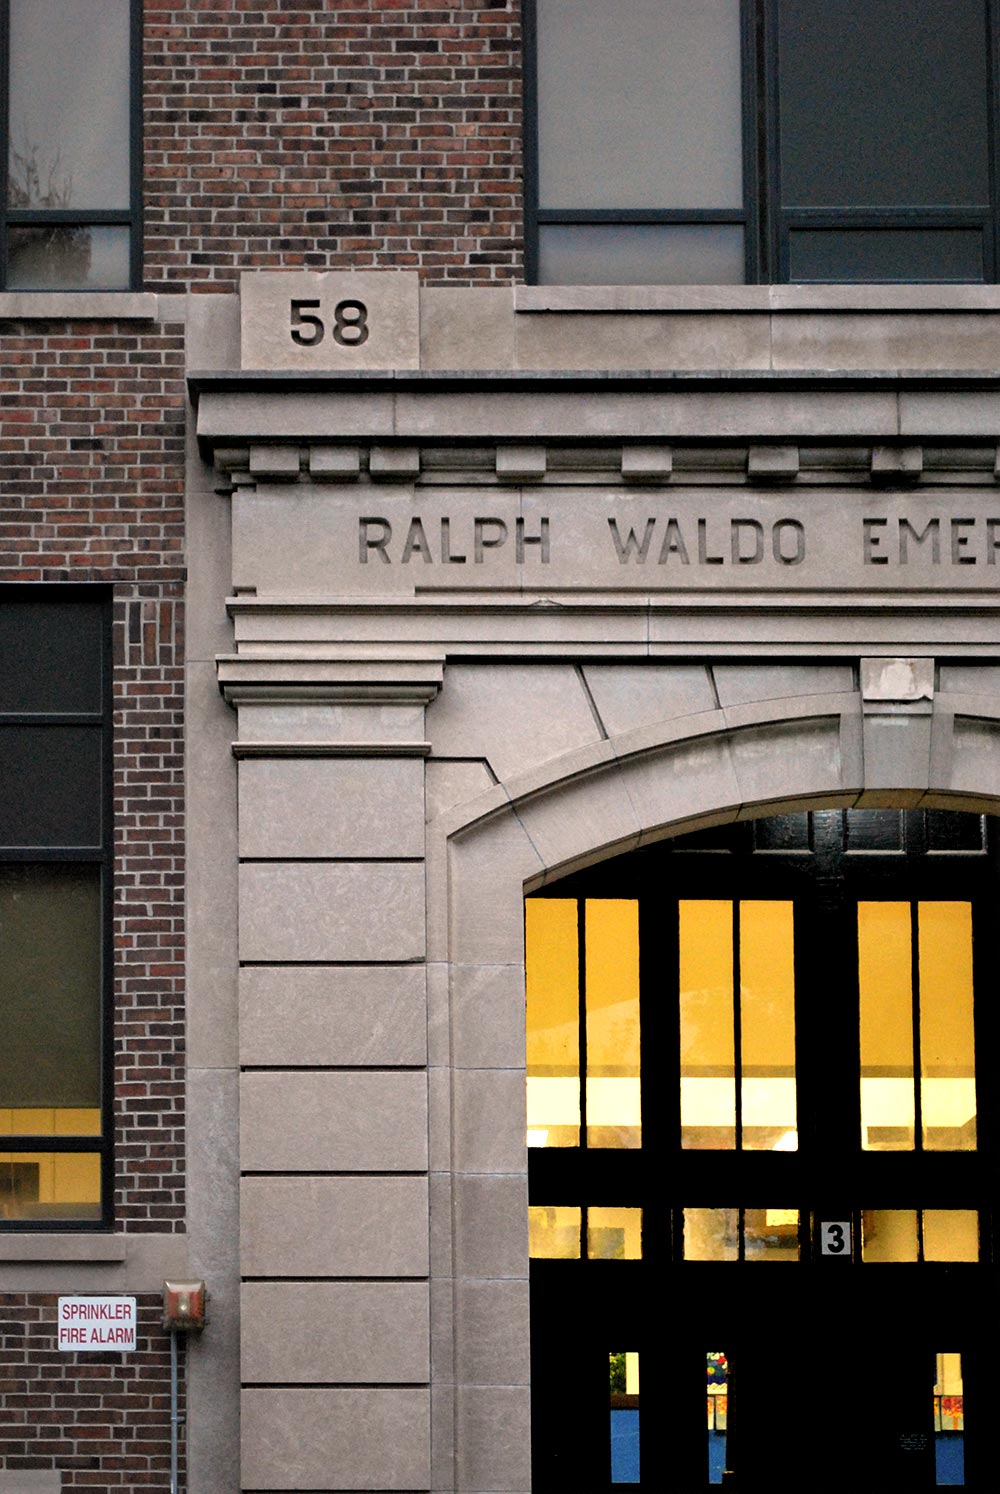
Families often choose where to live based on neighborhood characteristics, especially the quality and reputation of nearby schools. But we live in a highly mobile society, in a rapidly changing region, and many of Central Indiana’s neighborhoods have seen significant change in their residents and their schools.
We used state-reported data from the 2009-2010 and 2015-2016 academic years to interpret these trends in the Indianapolis region. We performed analyses from three perspectives, 1) finding demographic changes at the school level that are indicative of neighborhood changes, 2) viewing regional trends that cut across district lines, and 3) analyzing the spatial characteristics of school change.
Key findings from this report include:
- Regionally, schools are becoming more racially diverse, have a growing share of low-income students, and have increasing graduation rates.
- Low-income student population is falling in central Indianapolis and growing in Marion County’s townships, pointing to a growing number of low-income families living in first-ring suburbs.
- Schools experiencing similar change tend to be grouped geographically, with rapidly changing schools in more urban areas, and those holding steady in racial and income change located in more suburban and rural areas.
Articles and Story Maps
Explore interactive content built on our neighborhood change research.

Animated Map of New U.S. COVID-19 Cases Over Time
The incidence of new COVID-19 cases has not been the same over time throughout the country. This animated map shows the 7-day average of new COVID-19 cases per 100,000 people. This allows us to view the spread and incidence of the virus regardless of population density. The

Indy Evictions May Reach 34,000 or More in 2020
An increase in unemployment claims could drive the eviction rate from 7 percent in 2016 to 20 percent in 2020, and informal evictions may be twice that.

Police Used Force on 1.3 Percent of Black Residents Since 2015
Police used force over 1,600 times in 2019. Officers use force on black residents at a rate 2.6 times higher than white residents.

Socioeconomic factors explain why some New York ZIP codes were hit hardest by COVID-19
By comparing New York's COVID-19 test results with demographic and socioeconomic factors by ZIP code, we found that low education levels, crowded housing, and a lack of health insurance are some of the strongest predictors of high COVID-19 positivity rates.

The Inequalities Behind COVID-19 Disparities for African Americans in Indianapolis
COVID-19 positivity rate is 1.8 times higher for blacks than for whites. We explore how systemic inequities put many black individuals at higher risk for getting the virus, having a serious case, and suffering from the economic impacts compared to white residents.

Three Ways to Visualize COVID-19 Race and Gender Disparities
In Indiana, black individuals are 2.4 times more likely to test positive than whites. We look at three different ways to visualize COVID-19 disparities like this.

How long does it take to get to a grocery in each neighborhood?
This past November, we released the report Getting Groceries: Food Access Across Groups, Neighborhoods, and Time. Expanding on this report, we created an interactive map to display food access information for each block group in Marion County. Click on a block group to view

Michigan Street a Century Ago: A Neighborhood Node
Two miles east of downtown, Michigan Street is largely vacant. But in the early 20th century was a bustling corridor for the Willard Park and St. Clair neighborhoods. Discover the history and demographics of these blocks.

Candidate’s Housing Proposal Calls Attention to How We Measure Vacancy Rates
It's hard to know exactly how many vacant units are in Indianapolis, but it's clear that many neighborhoods struggle with hypervacancy.

Increasing Mortgage Values
Mortgage values are increasing across the county, indicating an increase in housing prices. We explore the fastest changing areas, as well as places with very little little mortgage activity.

Indy’s Poverty Increased over 50 Years, What about Peers?
The Indy region's poverty rate increased over the past 50 years, mostly between 2000 and 2010. We looked at peer cities from Cincinnati to Austin to see if they experienced similar trends.

In Christian Park, a Postwar Neighborhood Experiences 21st Century Changes
Christian Park was subdivided in the 1920s, but mostly built after World War II. Once an all-white neighborhood with high home ownership, the area has become part of a Latino community on the southeast side, and home ownership has fallen.
Authors
Kelly Davila,
Senior Research Analyst,
The Polis Center
Matt Nowlin,
Research Analyst,
The Polis Center
Unai Miquel Andres,
GIS and Data Analyst,
The Polis Center
Event Partners