The Polis Center (polis.iupui.edu) is working diligently to develop information that will help practitioners and policy makers during the COVID-19 public health crisis. Our geoinformatics, health informatics, and community informatics teams are building maps, dashboards, and datasets to help you. Check back often as we update this information.

How Is Indianapolis Doing?
A monthly look at how the Indianapolis metro area is recovering and emerging from the Covid-19 pandemic

Health and Economic Impact of COVID-19 in Neighborhoods
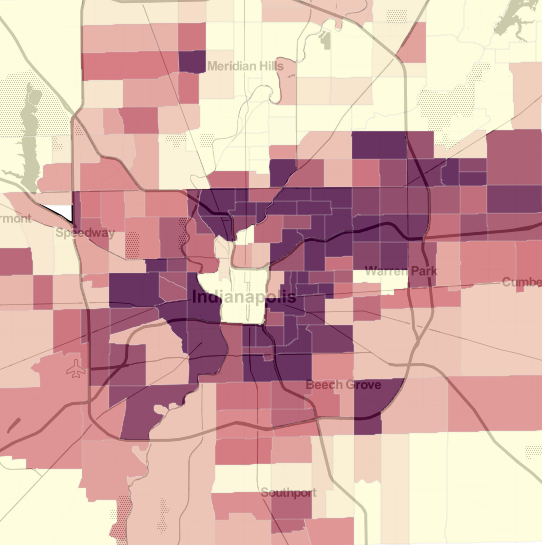
SAVI’s COVID-19 Impact Index simultaneously describes the health and economic impact in each Indianapolis ZIP code, as well as the health and socioeconomic vulnerabilities present before this crisis struck.

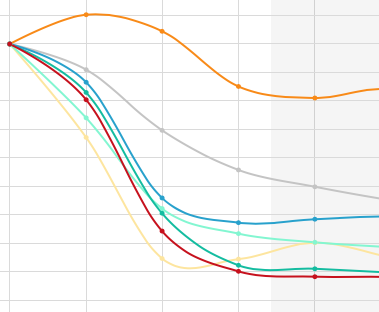
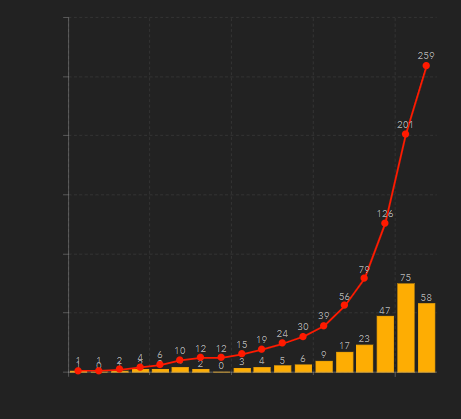
Animated map shows COVID-19 hotspots since March
First in New York City, then in the South, and now in the Midwest, severe rates of new COVID-19 cases have reverberated across the country. This video shows those hotspots grow and subside over time.

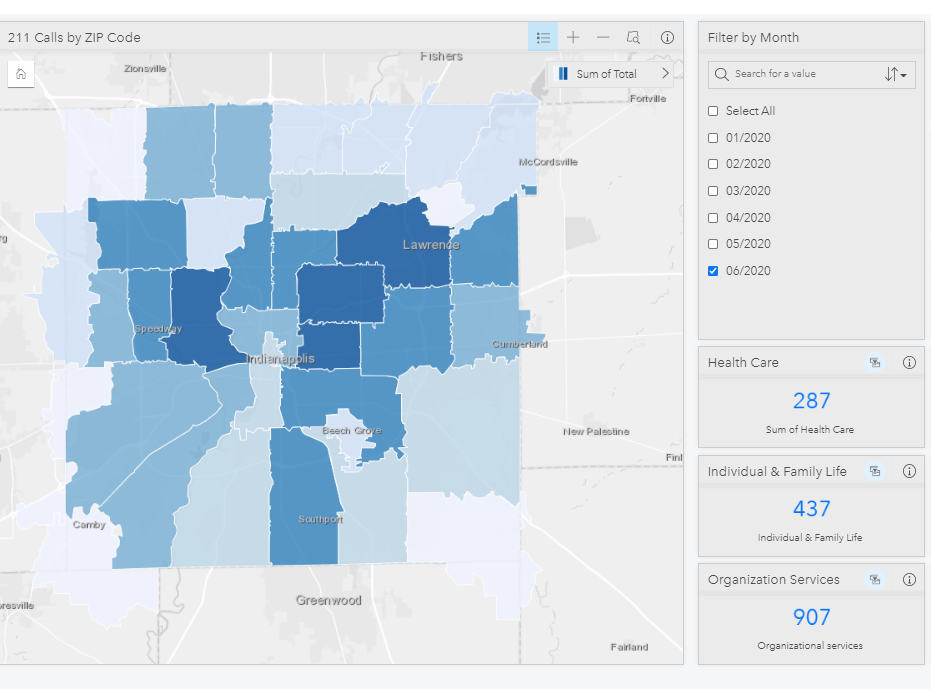
Where are 2-1-1 calls for need coming from?
2-1-1 is a free and confidential service that helps Hoosiers across Indiana find the local resources they need. This dashboard allows you to see where within Marion County callers are calling from and type of needs they have.
Marion County Evictions May Reach 34,000 or More in 2020
An increase in unemployment claims could drive the eviction rate from 7 percent in 2016 to 20 percent in 2020, and informal evictions may be twice that.
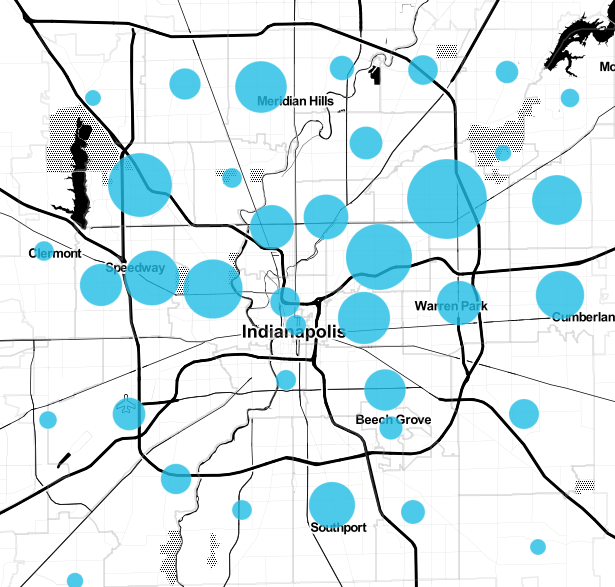
What can we learn from rental assistance applicants?
The City of Indianapolis launched a rental assistance program on July 13. A total of 10,130 applications were received before the application closed on July 15 at 6 pm. This can serve as an indicator of places where housing stability is most at risk.

Marion County Community Centers and Service Boundaries
This interactive map shows locations of community centers and the boundaries that they serve, in addition to details about each community center.
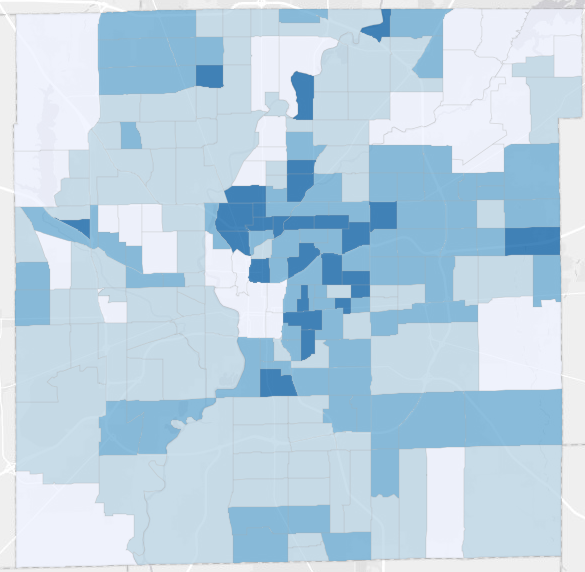
Marion County Neighborhood Unemployment Claims
Total weekly new and continuing claims from March 14 to May 30 by census tracts.
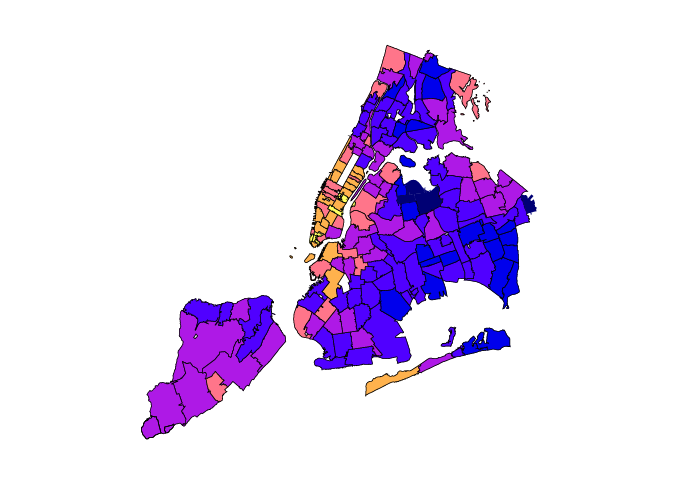
Socioeconomic factors explain why some New York ZIP codes were hit hardest by COVID-19
By comparing New York’s COVID-19 test results with demographic and socioeconomic factors by ZIP code, we found that low education levels, crowded housing, and a lack of health insurance are some of the strongest predictors of high COVID-19 positivity rates.
COVID-19 Impact on Indiana Businesses
Location data from mobile phones reveals that visits to businesses fell dramatically in March and April, but has slowly increased since the week of April 12.
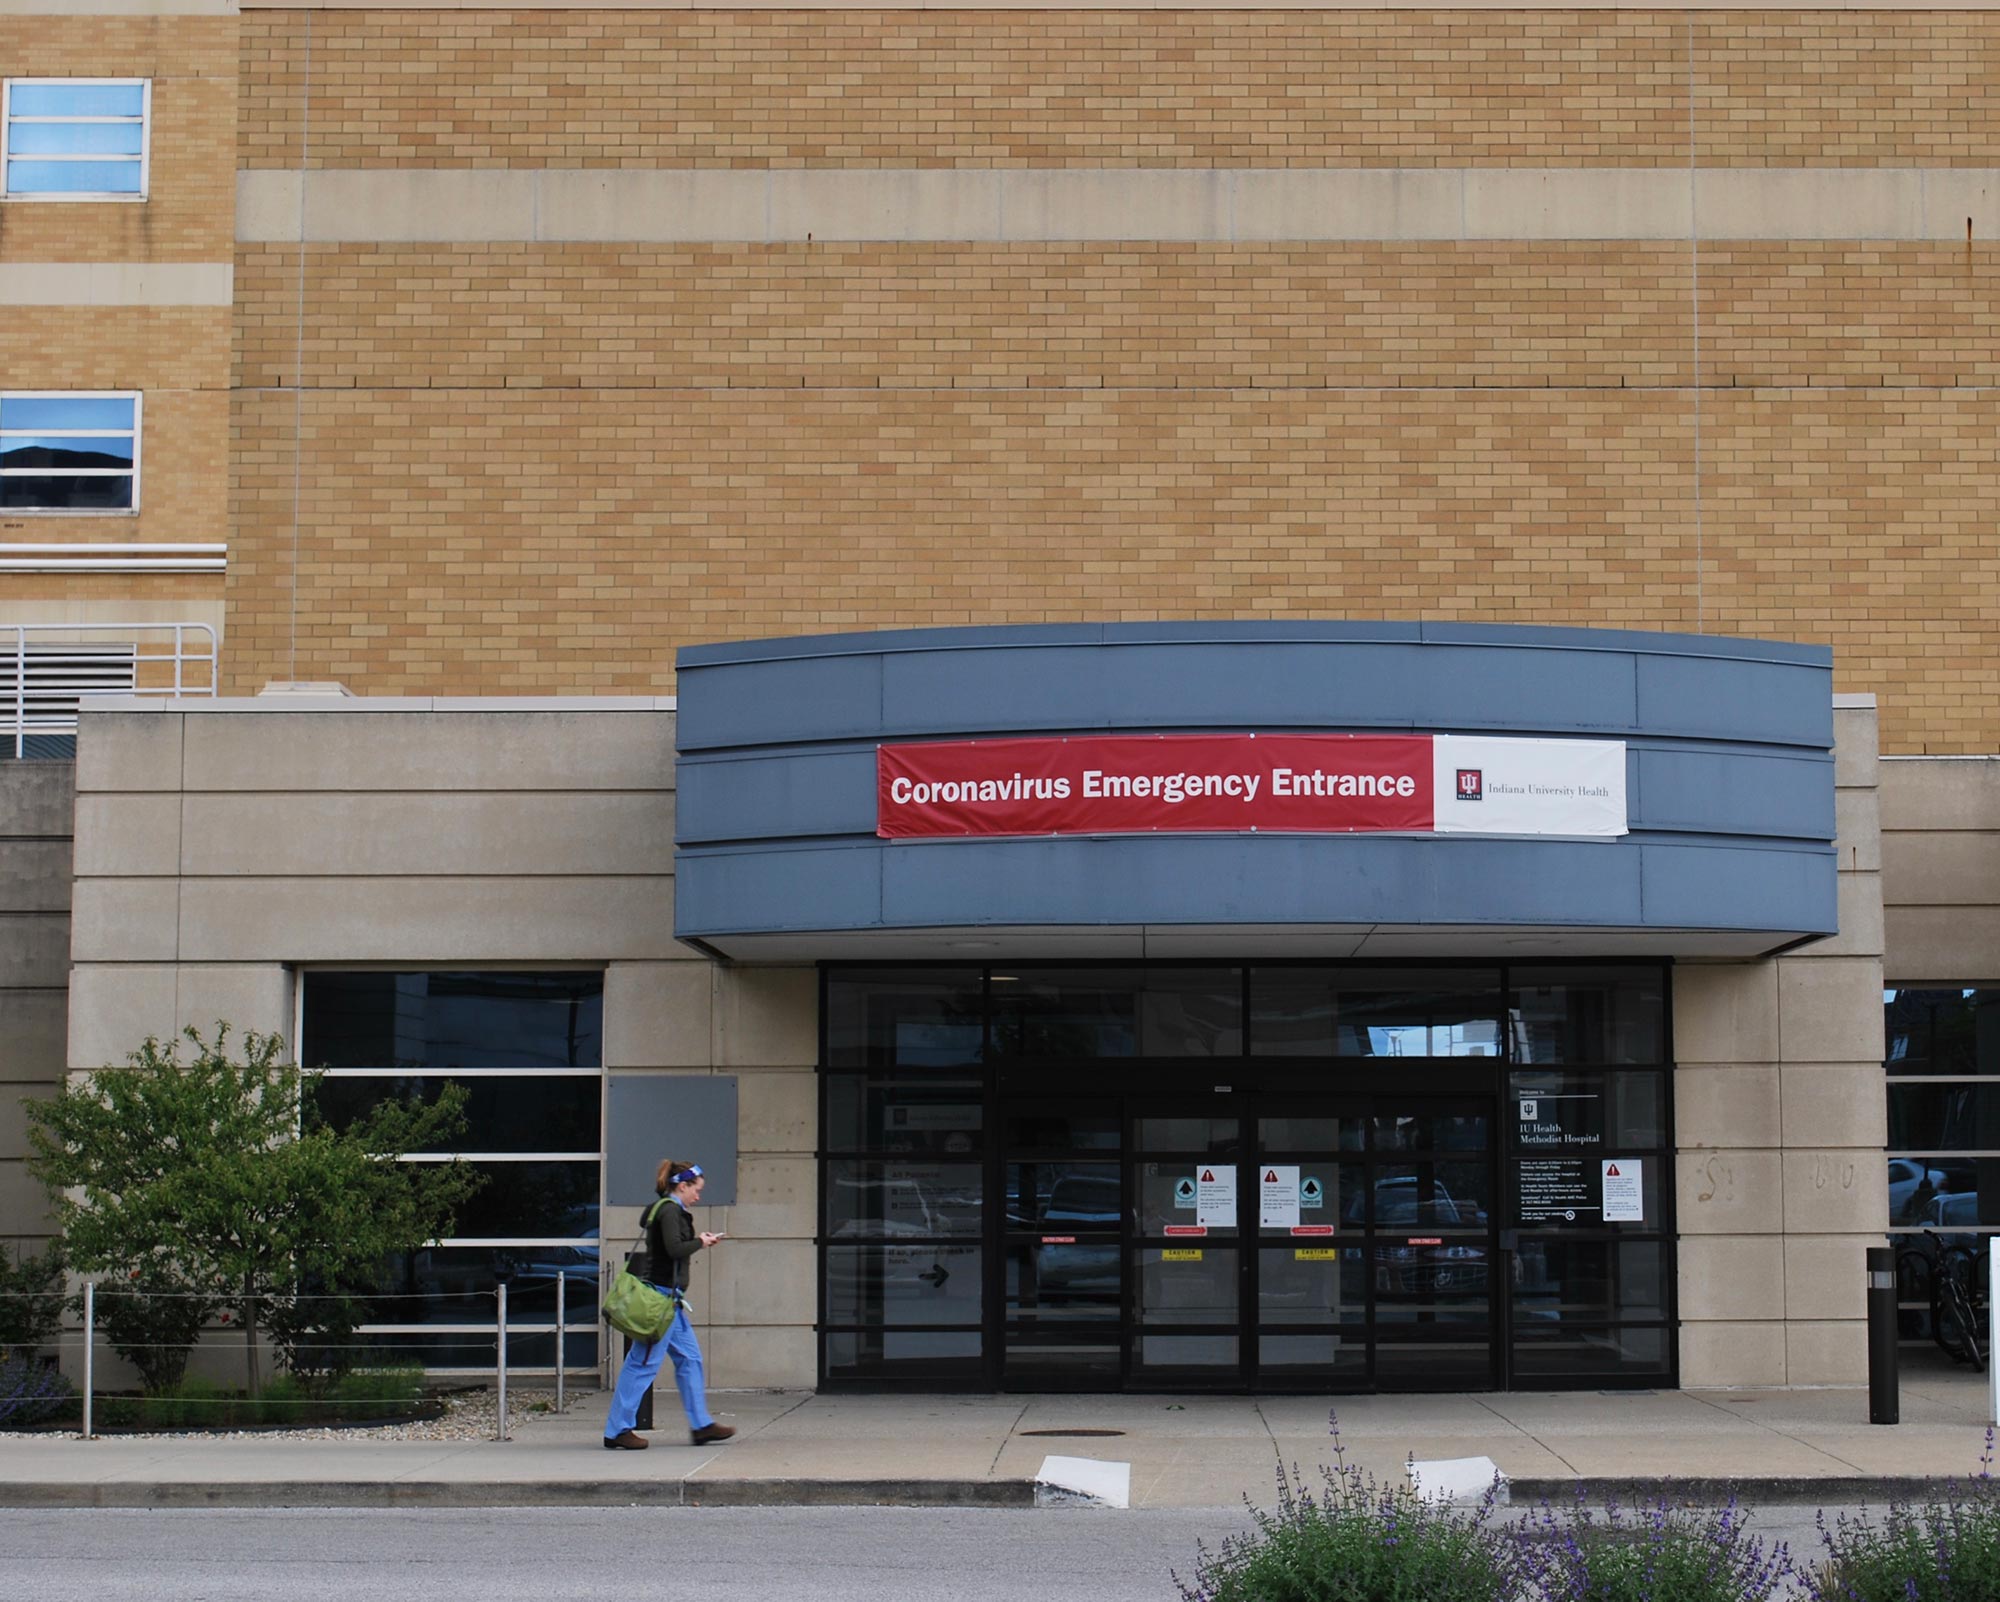
The Inequalities Behind COVID-19 Disparities for African Americans in Indianapolis
The COVID-19 positivity rate is 1.8 times higher for blacks than for whites. We explore how systemic inequities put many black individuals at higher risk for getting the virus, having a serious case, and suffering from the economic impacts compared to white residents.
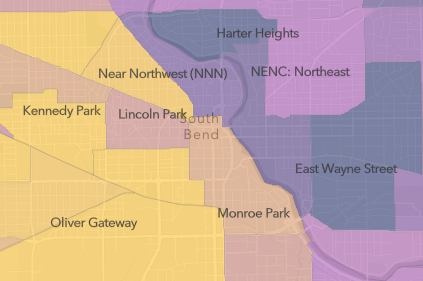
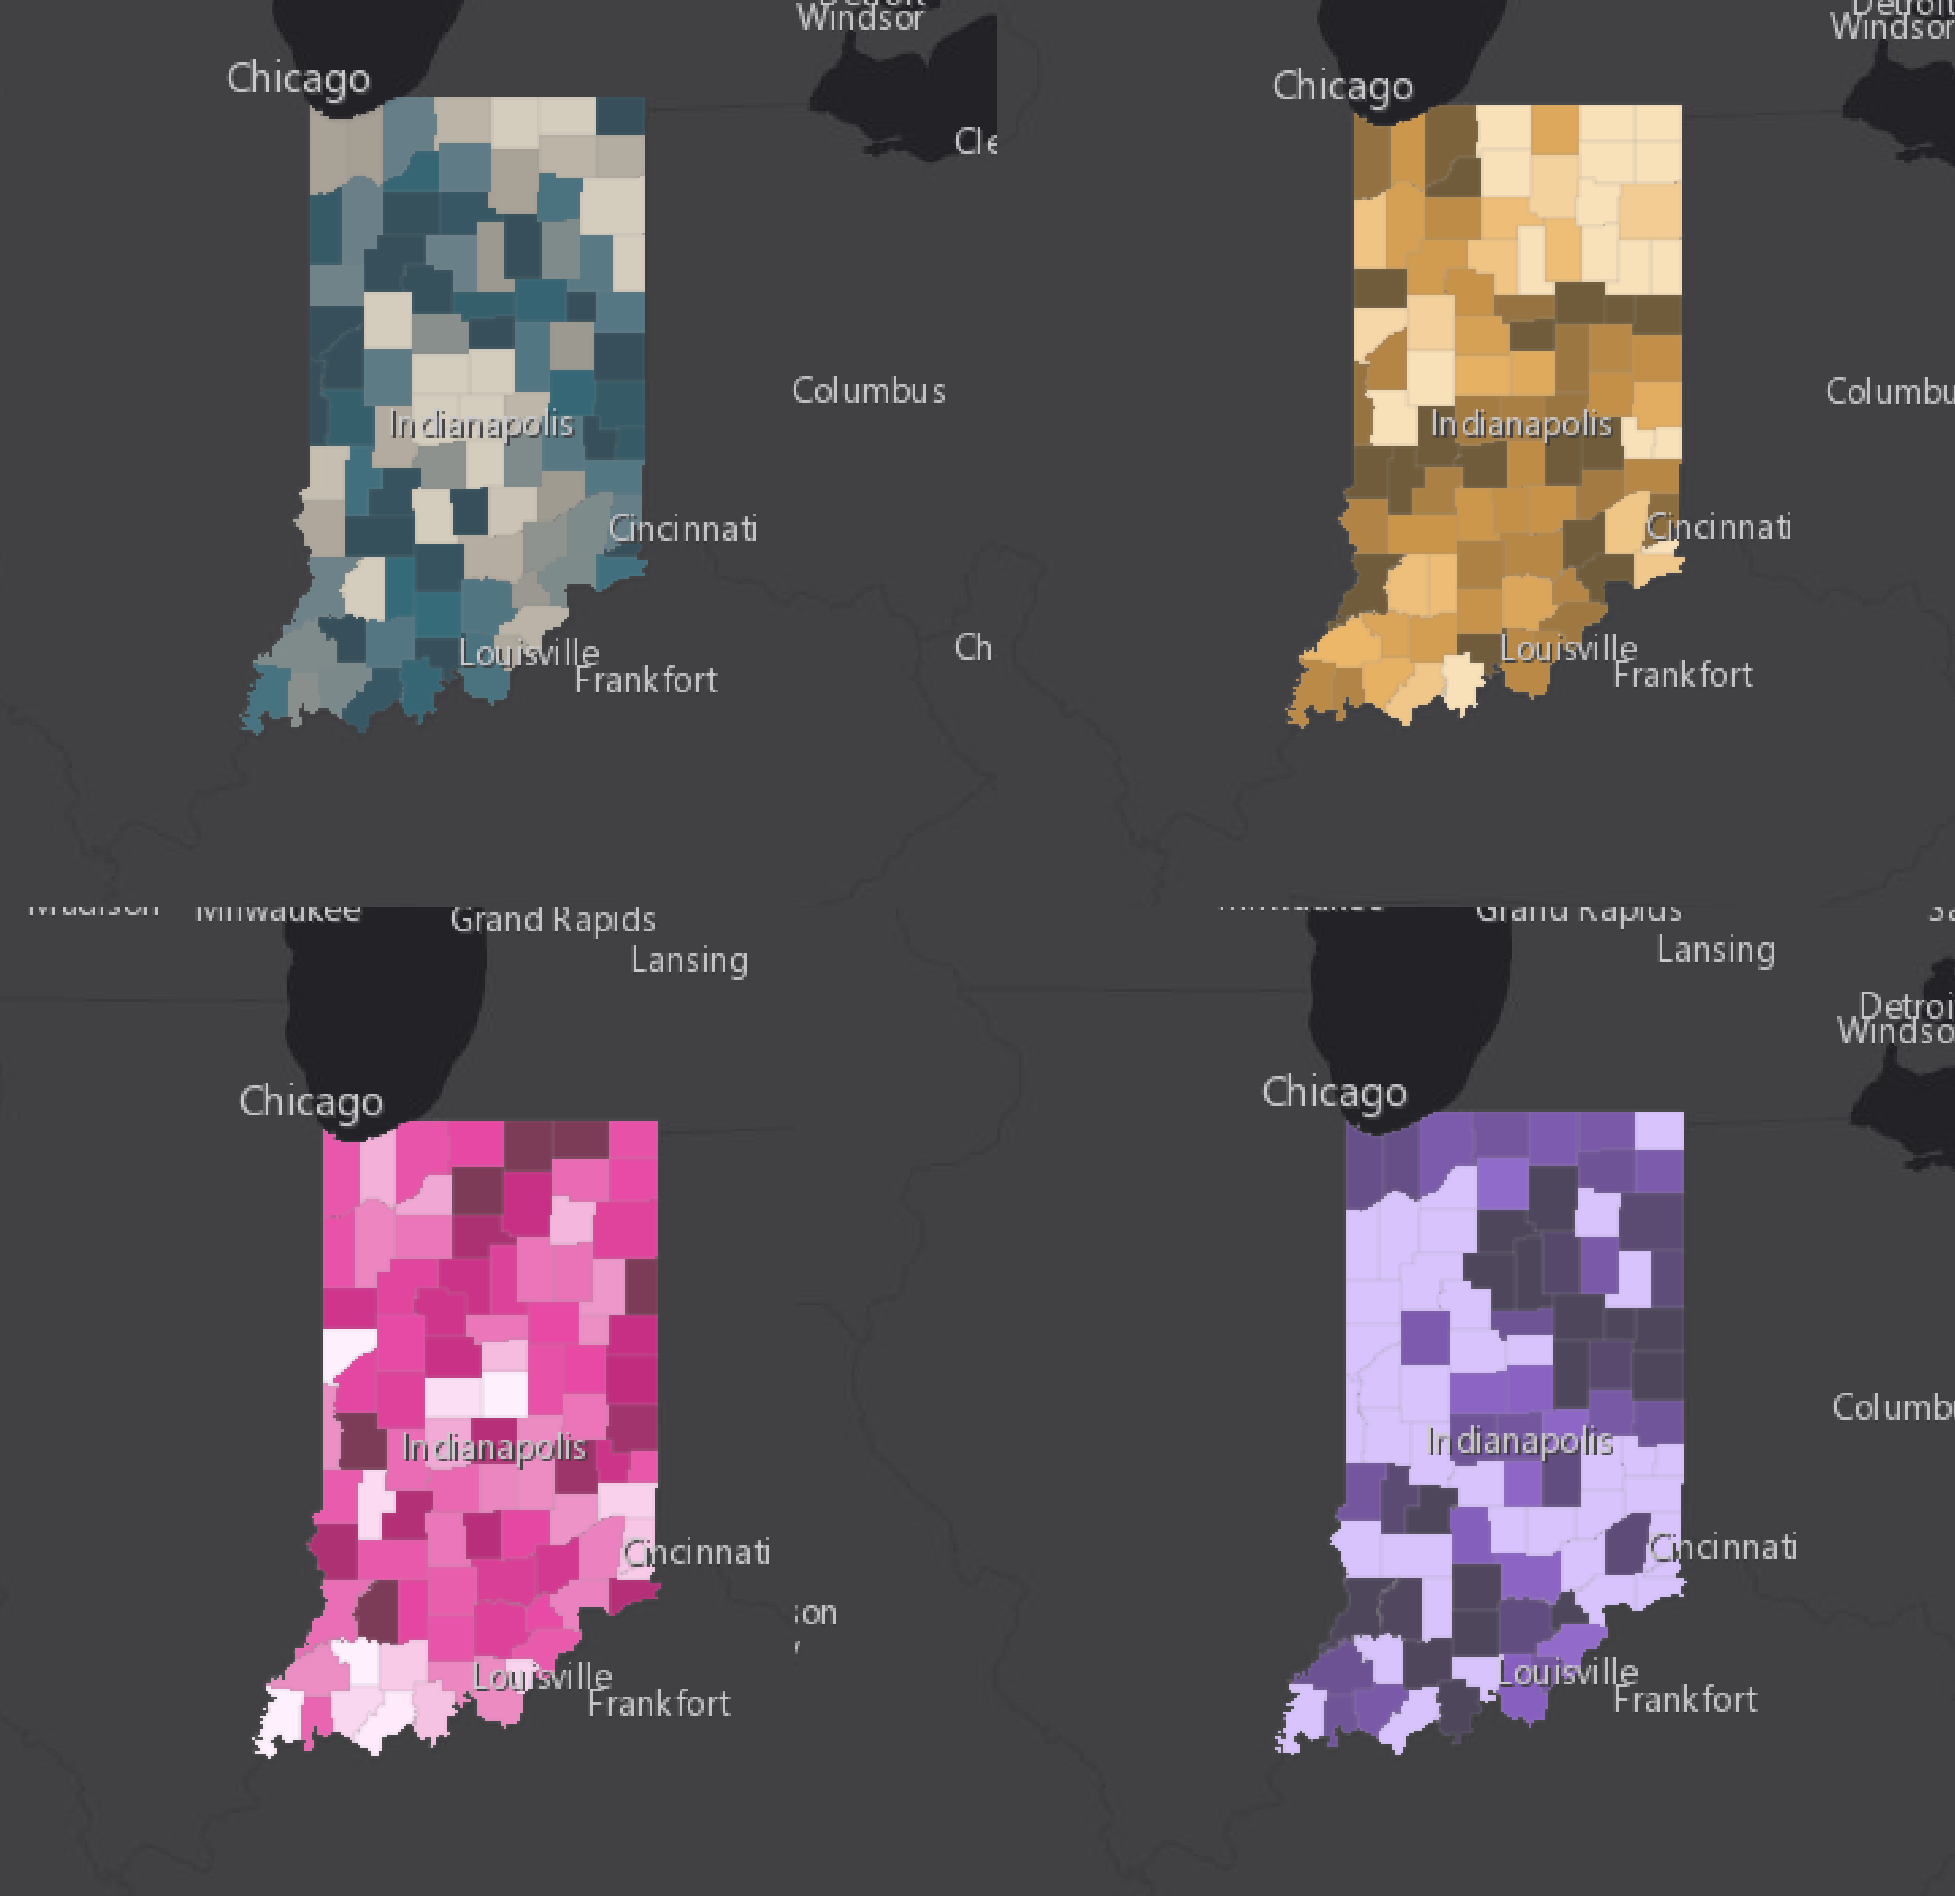
Neighborhood Coronavirus Risk in South Bend
Models of which South Bend neighborhoods are at higher risk of severe and deadly cases, based on demographic data and health estimates.


Three Ways to Visualize COVID-19 Race and Gender Disparities
In Indiana, black individuals are 2.4 times more likely to test positive than whites. We look at three different ways to visualize COVID-19 disparities like this.
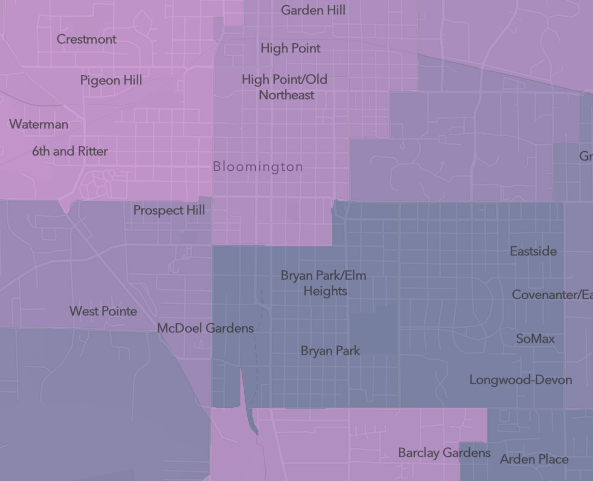
Neighborhood Coronavirus Risk in Bloomington
Models of which Bloomington neighborhoods are at higher risk of severe and deadly cases, based on demographic data and health estimates.
How are you using these data? What other data would be useful for you?
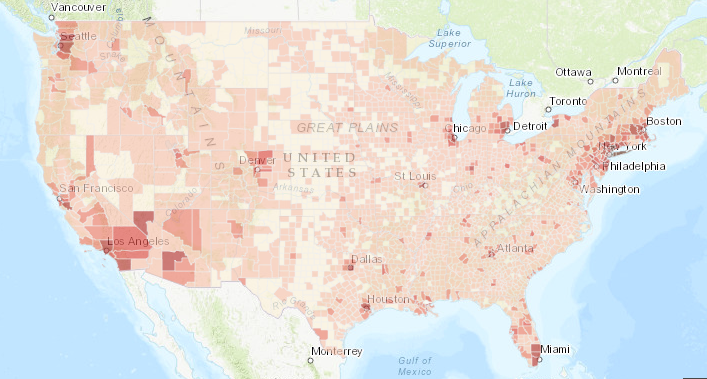
Tracking National COVID-19 Cases
A dashboard tracking U.S. Coronavirus cases at the county level on a daily basis. Click each county to see trends over time.
Updates suspended. Last updated April 29, 2021.
Tracking National COVID-19 Cases
A dashboard tracking U.S. Coronavirus cases at the county level on a daily basis. Click each county to see trends over time.
Updates suspended. Last updated April 29, 2021.

Risk of Social Isolation in Older Adults
This statewide StoryMap uses four indicators for adults over 65—poverty, marriage status, living alone, and disability—to indicate areas where more seniors may be at risk of social isolation.
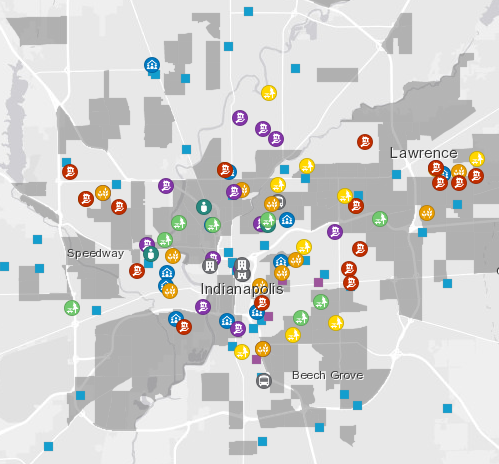
Marion County Food and Meal Resources
Map the location of open food pantries and soup kitchens as well as locations where meals and lunch boxes are being provided during the COVID-19 pandemic. View these data along with food deserts and COVID-19 risk maps.

Tracking Indiana COVID-19 Cases
Live dashboard of Indiana’s confirmed COVID-19 cases, testing levels, and deaths, along with a county map showing the location of cases.
Updates suspended. Last updated April 29, 2021.
Tracking Indiana COVID-19 Cases
Live dashboard of Indiana’s confirmed COVID-19 cases, testing levels, and deaths, along with a county map showing the location of cases.
Updates suspended. Last updated April 29, 2021.
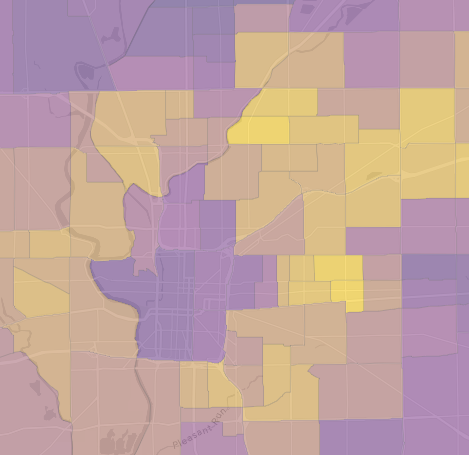
Neighborhood-Level Risk Estimates in Marion County
Models of which Central Indiana neighborhoods are at higher risk of severe and deadly cases, based on demographic data and health estimates.
County-Level Cases and Risks
Real-time updates of county-level COVID-19 case data alongside indicators of high-risk populations.
Updates suspended. Last updated April 29, 2021.
County-Level Cases and Risks
Real-time updates of county-level COVID-19 case data alongside indicators of high-risk populations.
Updates suspended. Last updated April 29, 2021.