Looking for SAVI’s latest food desert report? We’ve updated food access statistics for 2019, and they’re available in Getting Groceries: Food Access Across Groups, Neighborhoods, and Time
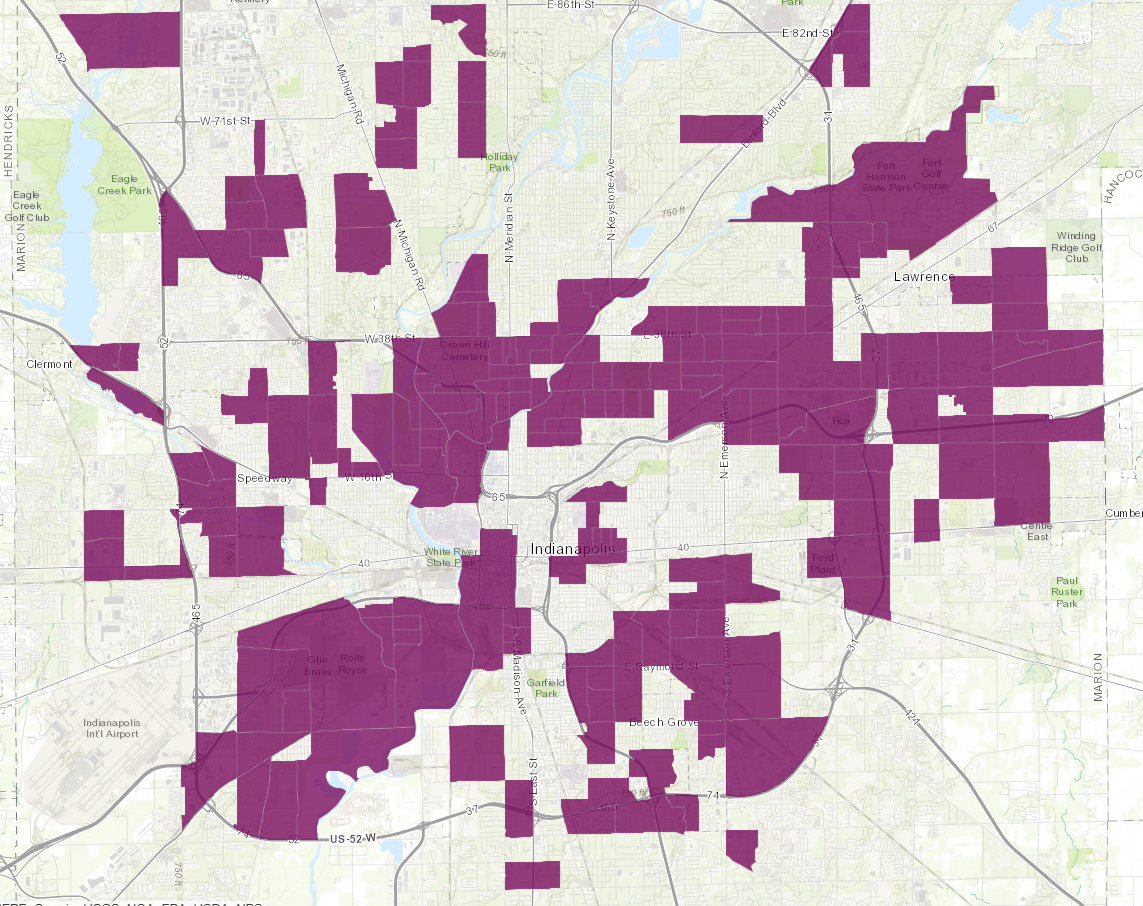
This map shows block groups that are food deserts (purple areas) in Indianapolis. Explore the interactive version here.
Using recent, local data to improve on food access measures, we find that an estimated 200,000 Indianapolis residents have low food access and live in low income areas. The largest food deserts are located on the city’s near northwest and northeast areas, southwest and southeast areas, and the Far Eastside.
The USDA Food Access Research Atlas is a great resource to quickly identify possible food deserts across the country. However, there are two ways it could be improved using local data. First, it measures distance from a grocery “as the crow flies” (using linear distance). Using local street data, we can calculate the driving distance from groceries. Second, the USDA uses two national listings of groceries and supermarkets that are both from 2015. We use local data from the Marion County Health Department for 2018, so we can get a more timely and accurate picture of food access (including the closures of Marsh and Double Eight).
Explore the newly available grocery and supermarket layers available now in SAVI Community Profiles.
Pct. of tracts and block groups with low food access
Using this local methodology, we found that 71 percent of Marion County census tracts have low food access. However, when looking at the block group level (which are smaller than census tracts), 61 percent have low food access. The USDA’s data found that 40 percent of tracts had low food access. By reducing the travel distance to actual driving distance and using updated grocery store data, we find that food deserts are about twice as common as the USDA shows.
Food access is most critical in low income areas. For example, many middle class areas in Franklin Township have low food access, and this may be inconvenient for the residents. But the assumption is that residents with the resources to choose to live in those neighborhoods could have decided to live somewhere with more access to grocery stores.
Families in low income areas, on the other hand, are more likely to be in poverty and less likely to have one car per adult. Many households in these areas have no access to a vehicle, and many rely on transit.
Our analysis found that 42 percent of census tracts in Marion County are low income and low access (LILA). We found that 31 percent of block groups were LILA areas. This differs from significantly from the number of LILA tracts (21%) identified by the USDA in Marion County.
Almost 200,000 people have low food access in low income areas
Number of people with low food access
We can estimate how many people have low food access by analyzing how many parcels are further than a one mile driving distance from a grocery. An estimated 195,520 residents in Indianapolis live in low income areas and are further than one mile from a grocery store.
Defining Low Food Access and Low Income
The CDC defines food deserts as parts of the country vapid of fresh fruit, vegetables, and other healthful whole foods, usually found in impoverished areas. And it recognizes that is largely caused because of the absence of healthy food providers in those areas, such as grocery stores or farmers markets.
Low Income
Just like the USDA, we identified low income areas as tract or block groups with a poverty rate is 20 percent or greater, or with a median income that is less than or equal to 80 percent of metropolitan area and has a median income.
Low Food Access
A low food access area is one where many people or a large share of people do not have a grocery store nearby. Low food access tracts are those where at least 500 people or 33 percent of people are more than one mile from a supermarket, supercenter, or large grocery store. We modified this definition (from the USDA) to suit block groups, which are smaller. We define low food access block groups as having at least 200 people or 33 percent of people further than one mile from a supermarket, supercenter, or large grocery store.
Food Desert
A food desert is an area that meets the criteria for both low food access and low income.
Where Is Food Access Low
Grocery stores, like other large retailers, tend to locate along major thoroughfares. This provides some low income areas on the south side, Near Eastside, and Near Westside with close access to a grocery.
However, many low income areas have low food access, making them food deserts. One of the largest food deserts are in the north and northwest of downtown in neighborhoods like Riverside and Crown Hill. Another large food desert is northeast of downtown in parts of Martindale-Brightwood, Forest Manor, and Arlington Woods.
Mars Hill and West Indianapolis, on the city’s southwest side, contain a large food desert, as well as parts of the Near Southeast neighborhood. Finally, another large food desert exists on the Far Eastside (north of Cumberland and south of Lawrence).
Food Deserts by Block Group and Tract
Data Notes
For this blog, five different datasets were used via the SAVI information System:
-
SAVI Grocery Stores and Supermarkets: This data is curated from the Marion County Health Department Food food inspection reports.
- Population: This data comes from the 2016 American Community Survey 5-year estimates.
- Parcel boundaries: This data comes from the Indiana Geographic Information Officer.
- Parcel types and values: This data comes from the Indiana Department of Local Government Finance. This data was used to identify those properties that were residential.
- Marion County street centerlines: This data comes from the OpenIndy Data Portal.
Methodology Notes
This analysis was done calculating one mile grocery service area. Service areas were creating using a one mile road network travel distance to grocery stores. The road network was created using the Marion County centerlines layer available through IndyGIS. Residential parcels were considered to be near a grocery stores if they intersected the 1 mile grocery service area boundaries.
Population with low food access was calculated by multiplying the percentage of residential parcels far from grocery stores in a census tract/block group by the population of the tract/block group. This is only an estimate, because not all parcels contain the same number of people. (Some are single family homes, some are apartments, and some are vacant.) But is a reliable way to estimate population within a census tract or block group.
Next Up
- Who Has Access to Groceries and Farmers’ Markets?
The USDA defines food deserts as a census tract where “at least 500 people and/or at least 33 percent of the census tract’s population reside more than one mile from […]
 The Rich Live Longer Everywhere. For the Poor, Geography Matters.
Article You May Have Missed: The April 11, 2016 issue of the The New York Times featured the article, “The Rich Live Longer Everywhere. For the Poor, Geography Matters.” This […]
 Worlds Apart: Gaps in Life Expectancy in the Indianapolis Metro Area
 YMCA Uses Maps to Locate New Facilities
The Indiana YMCA contacted the Polis Center to create a map of all current YMCA locations in the Indianapolis area. The YMCA was able to use the SAVI map to […]