The USDA defines food deserts as a census tract where “at least 500 people and/or at least 33 percent of the census tract’s population reside more than one mile from a supermarket or large grocery store.” [usda.gov] This is a useful definition, but of course food access is more nuanced than this. The data changes as you adjust things like the distance from a food source or the definition of a food source.
This blog explores how the data changes as the definition of a food source changes. For example, what happens to food access when you include smaller, independent groceries and farmers’ markets? Of course, these usually cannot provide as much variety and value as larger chains, but for some households and in some seasons, they may be useful food sources. In other words, the premise is not that the USDA’s definition should change, but instead that it can be useful to take a more detailed look at food access.
Our Definition of Food Source Locations
We had four criteria for defining food source locations.
- Accessibility: Open to the general public, no membership required.
- Predictability: Location has a fixed location and regular hours.
- Products: Offers a variety of fresh produce and unprepared food items.
- Must have information updated on internet presence platform in the last 2 years. This rule is significant to ensure farmer’s markets are active and meet the requirements for predictability.
Areas Within One Mile of Food Source
Expand the legend to toggle background layers, including census tracts by low- and moderate-income households, number of people of color, and percent of households without a vehicle.
260K People in Marion County Live More than a Mile from a Food Source
Even when you include independent groceries and farmers’ markets, only 72% of Marion county residents live within 1 mile of a food source. The remaining 260,000 people (28%) live more than 1 mile from a food source. Food access impacts some households more than others. If you have access to a vehicle and have a higher income, it can be easier to deal with the inconvenience of travelling farther to get food. But that inconvenience is more significant for those without access to a vehicle.
1-in-5 Low- and Moderate-Income Households Do Not Have Food Access Within One Mile
By our definition of food source (which is even more inclusive than the USDA’s), 22% of low- and moderate-income households have low food access in this county. (We based our definition of “low- and moderate-income” on two things: the HUD definition for low-income [here] and Indiana’s 2016 Self-Sufficiency Standards [here].) Indiana’s Self-Sufficiency Standards for Marion County for a family of four is $55,872, while HUD describes “low-income” as being 80% of the area’s median income. (80% of Indiana’s AMI is $55,920.) While we don’t have the data to look at that exact income range, we can look at households earning less than $50,000 (or 71% of Indiana’s AMI).
Summer Farmers’ Markets Extend at Least Some Access to 25K People
There are over 287,000 people in Marion County who live within one mile of a farmer’s market, but when many of these locations close in the winter, food access decreases. For over 25,000 people, summer farmers’ markets are there only nearby food source (within one mile), so when the markets close, they lose some degree of food access.
Areas Within One Mile of Food Source
Expand the legend to toggle between the summer access area and the winter access area.
The food access provided by farmers’ markets is not perfect, but it does serve a vulnerable population that has limited options. The census tracts that gain a significant amount of food access from summer markets are lower-income than the county overall. They also have higher rates of households without vehicles than the county.
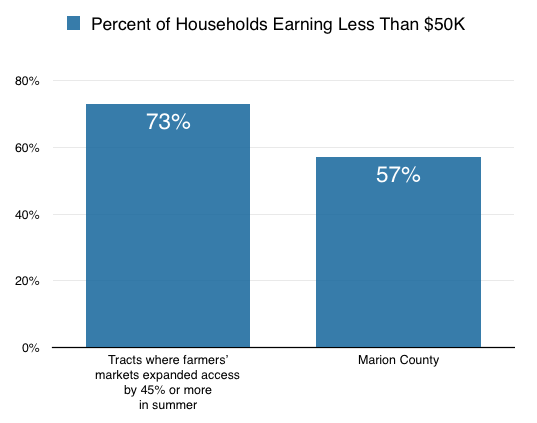
For tracts where food access went up 45% or more during the summer, 73% of households had low to moderate incomes. In the county overall, 57% of households had low to moderate incomes.
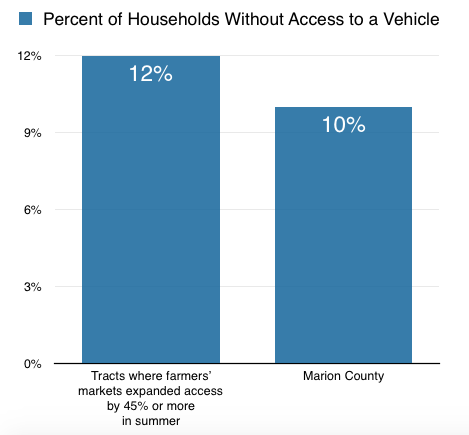
For those same tracts that saw at least a 45% increase in access during the summer, 12% of households are without a car. In Marion County overall, 10% of households are without a car.
There is a lot we can learn by taking a detailed look at access to food by store type, and we have barely scratched the surface. Check out this map to explore the data more, including location density, SNAP participation, and WIC participation.
View larger map
Next Up
 The Rich Live Longer Everywhere. For the Poor, Geography Matters.
Article You May Have Missed: The April 11, 2016 issue of the The New York Times featured the article, “The Rich Live Longer Everywhere. For the Poor, Geography Matters.” This […]
 Worlds Apart: Gaps in Life Expectancy in the Indianapolis Metro Area
 Hunger in Central Indiana
 Drug Free Marion County Uses Maps for Evaluation and Outreach
The Drug Free Marion County initiative contacted SAVI to provide updated data and maps for alcohol and drug-related juvenile crimes in Marion County that highlight the areas with the highest […]