IndyEast Promise Neighborhood: Neighborhood Trend Report
The IndyEast Promise Neighborhood is both a place and a strategy led by John Boner Neighborhood Center and Edna Martin Christian Center. The IndyEast Promise Neighborhood promises all students on the Near Eastside and in Martindale-Brightwood access to great schools and whole family support to ensure a successful transition from cradle to career.
This report summarizes data about the community, the schools, and the participants in the Promise Neighborhood program.
What We’re Measuring
This report is divided into six sections.
First, we provide background about the neighborhood and families living their. Then, we focus on four domains where this program makes an impact: learn in community, learn early, learn in school, and learn through college and career.Click on any section below to jump to relevant data within that section

Neighborhood
Neighborhood conditions and demographics.

Whole Family
Measures of family support for health and education.

Learn in Community
Social context of the community, health, safety, and social capital

Learn Early
Early childhood education quality, and outcomes.

Learn in School
K-12 performance, health, safety, and social indicators.

Learn through College and Career
High school completion and post-secondary participation and support.

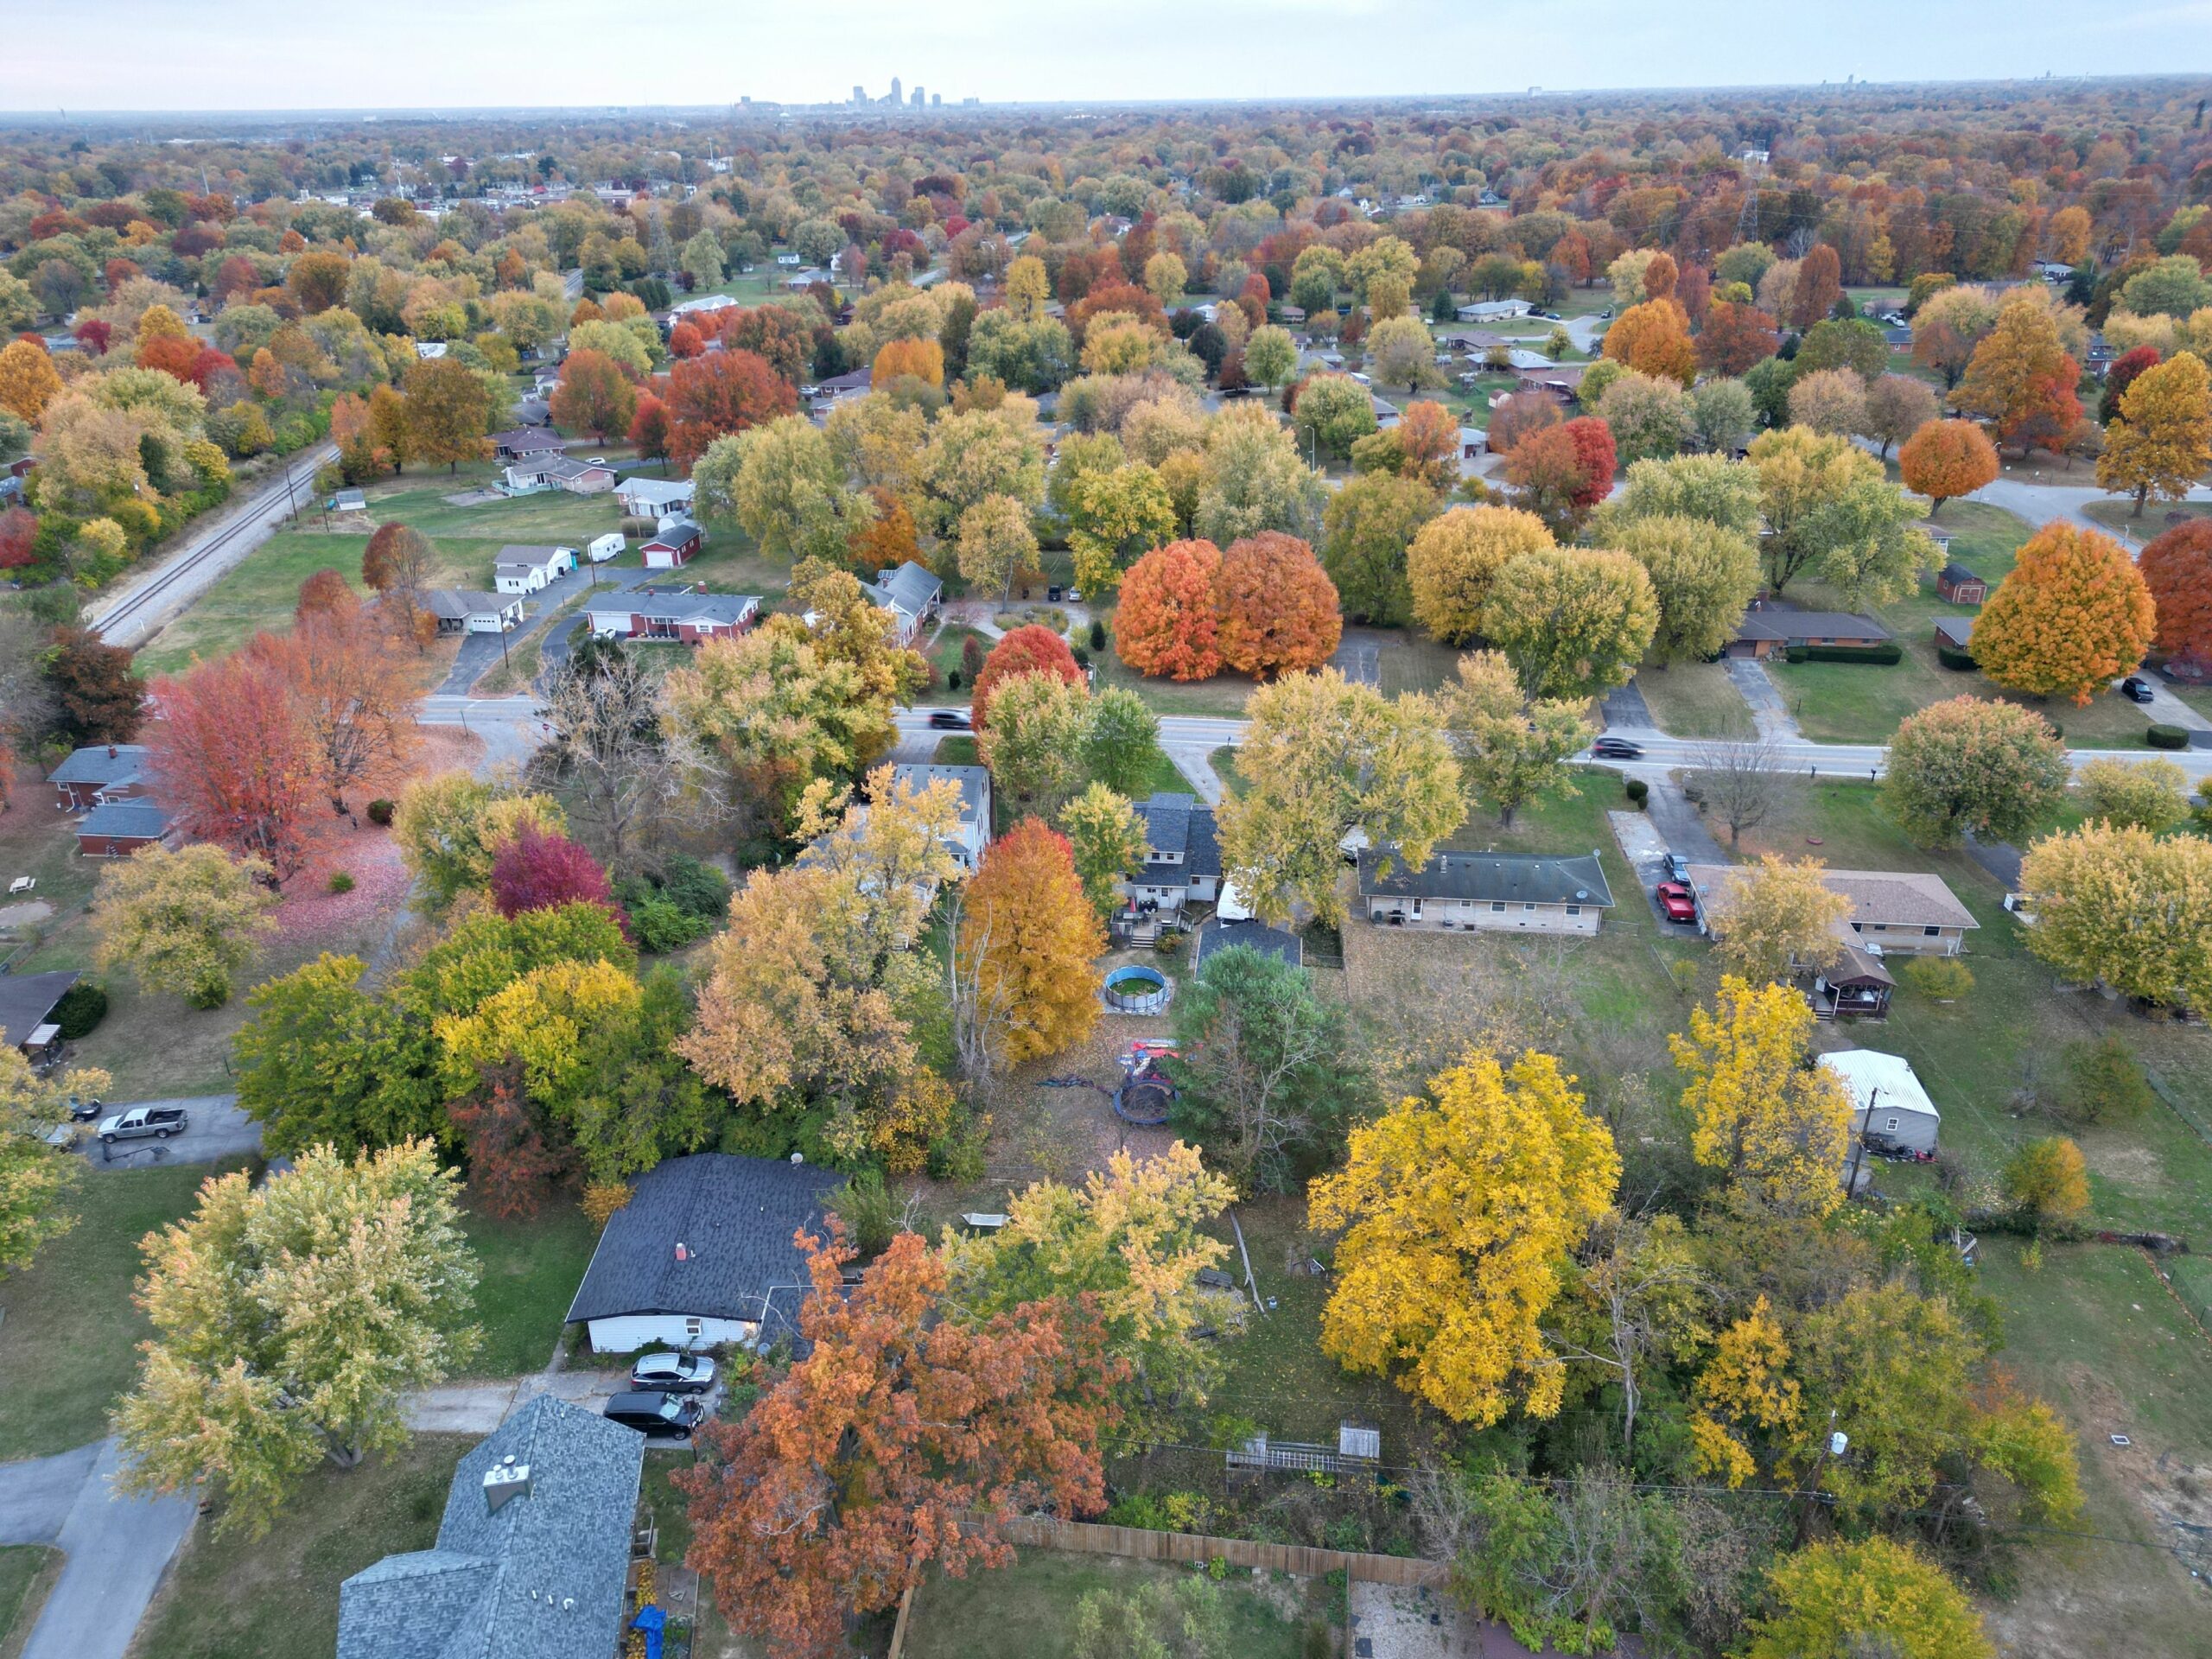
Neighborhood Background
These charts represent overall demographics and conditions in the Promise Neighborhood area. They are drawn from data from these census tracts. **All charts below are in the process of being updated for new boundaries and data, completion by end of 2023.

Guide: How to read these charts
For many of these charts, the statistics we show are estimates, not exact values. We visualize this data in a couple ways.

Line charts
For estimated data, line charts have a lightly colored band behind them. The estimated value is shown by the line, but there is a 90% chance the actual value falls within the light band. There is a 10% chance the actual value fall outside this range.

Dot plots
The estimated value is shown by a dot, but there is a 90% chance the actual value falls within the lightly colored bar. There is a 10% chance the actual value fall outside this range.
Guide: Additional chart types
There are additional types of charts where we display data where error in reporting is not given. This is commonly school enrollment or testing data.

Arrow plots
When looking at changes between two different points in time, the arrows point from the older data to the newer data, with the length of the arrow corresponding to the amount of change.

Bar charts
Represent the values of the data, and can be stacked together to represent different groups for comparison.
What does statistically significant mean?
Much of this data comes from the American Community Survey. Like any survey, the results are only estimates. When we say a change or comparison is “statistically significant” it means we are confident that the difference is not due to random chance or luck, but instead represents an actual difference in values.

Population
Over 54,000 people live in the Promise Neighborhood.
The total population is estimated at 54,487, just above where the population was twelve years ago. There may have been a slight decline in population in the middle of the decade, but the trend has recovered in the years since.
Race and ethnicity
The neighborhood is diverse, and Latino residents make up an increasing share of the population.
White residents make up 40 percent of the population and Black residents make up 40 percent. Estimates show the Black population has been slowly declining while the white population has been somewhat steady. The Latino population grew from 9 percent in 2010 to 15 percent in 2023.Historical trends illustrate an increasingly diverse neighborhood.
The overall population has decreased since the 1940s. Until the year 2000, the white population was higher than the Black population. Since 2000, there has also been an increase of nearly 4,500 Latino residents in the neighborhood.
How many residents are experiencing poverty?
Poverty among youth has increased since 2021.
26 percent of the neighborhood is living in poverty. The poverty rate among youth is higher than the overall population, at 37 percent, but it has fallen an estimated 22 points since 2013. Research has shown that poverty rates may have fallen in 2020 as cash assistance was made available through pandemic relief bills. Due to a large margin of error, the difference between overall and youth poverty rate is not statistically significant. Even with the larger margin of error, the trend data shows the youth poverty rates tend to exceed the rest of the population.
How much do households earn?
The median household earns an estimated $45,412.
In 2022, an estimated 12 percent of households earn less than $10,000 per year, a decrease of seven percentage points since 2017. This decrease was matched with an over ten percentage point increase in the number of households making more than $75,000 a year, up from 12.1% in 2017 to 27% in 2023.
Employment
Unemployment rate has fallen but is still twice the Indianapolis average.
Improvement in the unemployment rate follows national trends during this time period as the economy experienced steady growth. The labor force participation rate is the percentage of people aged 16 or older who are employed or seeking work. At 64 percent, this is actually higher than Indianapolis' overall rate of 63.5 percent. Unemployment rates tend to be higher for Black workers. In this neighborhood, the Black-White unemployment rate gap is estimated at six points. Labor force participation tends to be lower for women, who participate in the labor at a rate nine points lower than men in this neighborhood.
Workers
There are nearly 22,000 workers in the neighborhood, and nearly 38 percent earn more than $40,000 per year.
The highest employment sectors are in health care, waste management, or retail. The fastest growing sectors (in terms of percent growth) are waste management, transportation and warehousing, and health care.
Jobs
There are nearly 10,500 jobs in the neighborhood, and nearly 55 percent pay more than $40,000 per year.
The top sectors are manufacturing, transportation and warehousing, and construction. Waste management, information, and transportation and warehousing are the fastest growing sectors.
Educational attainment
The percent of adults with no education beyond high school is consistently near 35 percent, but has seen a recent decrease. The share with a bachelor's degree conitnues to rise.
An estimated 33 percent of adults age 25 or older have a high school diploma (or equivalent) and no further education. 24 percent have at least a bachelor's degree. This is higher than 2012, when the rate was 12 percent.
Housing cost burdened
An estimated 35 percent are housing cost burdened. Nineteen percent of household spend at least half their income on housing costs.
When a household spends 30% of their income or more on housing costs, they are considered housing cost burdened. While the estimates have declined since 2017, the decline is not large enough to be statistically significant.
Vacant housing units
Vacancy rate has consistently declined since 2013 and is now estimated at 18 percent.
In 2013, around 27 percent of housing units were vacant. That fell to 18 percent in 2023. That is still higher than Marion County, where 10 percent of units were vacant in 2020, according to Decennial Census data.
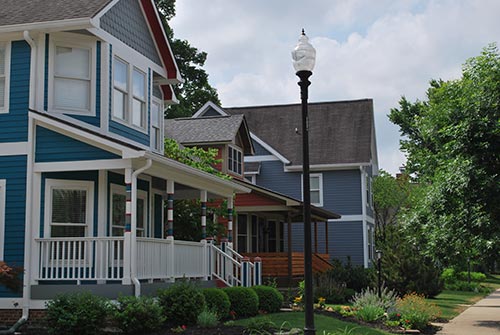
Median housing costs
Both median mortgage and rent payments have gone up drastically since 2010.
Median rent climbed from an estimated $680 in 2010 to $1,005 in 2023, while median mortgage costs for households rose from $676 in 2010 to $1174 in 2023. Rent increases are occurring as many residents are renting more and concurrently home ownership is falling. Rent increases disproportionately impact Black residents, who are more likely than White residents to rent their home.
Home values
While the estimated median and lower quartile home values have been increasingly steadily for the past decade, that value of more expensive homes is beginning to increase at a quicker rate.
The median home value in this area is estimated at $152,000, which is nearly a $30,000 increase in home value since 2022, and an $80,000 increase from 2010. The neighborhood's higher-value homes are becoming more numerous, more expensive, or both. The upper quartile value—meaning the most expensive quarter of homes are worth at least this much—rose from $96,000 to $235,000 in the same period.
Whole Family
This section reports overall data about the socioeconomic conditions of families in the neighborhood and families at the schools. It also explores parents' engagement with school, learning, and health care providers.
Family income
Nearly eight in ten students are eligible for free or reduced-price lunch, which means their family is low-income (below 185 percent of the poverty threshold).
At the beginning of the 2010s, more families were low-income. Unemployment was high after the Great Recession. Since 2013, the share of families that are low-income fell by 10 points. Still, the vast majority of students are from low-income families.
Households receiving public assistance
Nearly one quarter (23.4 percent) of households receive cash public assistance [Temporary Assistance for Needy Families (TANF)]
or SNAP benefits.
Public assistance is another measurement tool to determine family income. While 13 percent of Marion County residents receive SNAP benefits, only two percent receive cash benefits from Temporary Assistance for Needy Families (TANF). Just like free and reduced-price lunch eligibility, this indicator has decreased slightly since 2017.
Learn in Community
The community in which a child is raised has a measurable effect on their life outcomes. This section describes trends in safety and community connection.

Violent crime rates
Violent crime fell from 2015 to 2021 but was still much higher than the Indianapolis average of 11.4 violent crimes per 1,000 residents.
In 2016, the violent crime rate (excluding simple assaults) was 39 crimes per 1,000 residents. The crime rate fell by a third since then. Violent crime has fallen in the neighborhood for five consecutive years.
Property crime rates
Property crimes are more common than violent crimes. The rate fell between 2010 and 2021 but was still higher than the Indianapolis average of 35.7 per 1,000 residents.
2012 was the peak year for property crime since 2010. The property crime rate fell by 40 percent between 2012 and 2021. Property crimes declined during the pandemic (2020) and continued to decline in 2021.
Juvenile charges
In 2020, there were 38 juvenile charges for every 1,000 youth living in this neighborhood. That has declined since 2010.
Although racial disparities have shown improvement, there continues to be a gap in Black youth. Black youth are charged at 2.1 times the rate of white youth. In 2010, Black youth were charge at 2.8 times the rate of white youth.
Learn Early
This section reports data about the availability of early childhood education and kindergarten readiness outcomes.
Young children
Children start kindergarten at various ages, but Indiana school corporations are required to provide kindergarten starting at age five.
It is estimated that there are between 3,354 and 4,708 children under age five in the neighborhood, which is a slight decrease from 2022.
Learn in School
This section reports school demographics and performance of students in school, in addition to health and safety metrics, access to technology, and parental engagement metrics.
Broadband access
Nearly three-quarts (75 percent) of the neighborhood has access to broadband internet.
The share of households with broadband internet access may have increased between 2017 and 2022. In 2023, an estimated 70.2-80 percent of households have broadband.
Enrollment
Schools in the neighborhood often have high enrollment of Black and Latino students.
Enrollment by race varies greatly between schools, and several schools in the neighborhood have undergone drastic changes in enrollment since 2018-19, while others have not. Enrollment at Arsenal Tech High School declined since before the pandemic but both Arsneal Tech and KIPP High School saw increases between the 2021-2022 to 2023-2024 school years. Both high schools saw decreases in the 2024-2025 school year. The number of Latino students has increased since 2018-2019 from 921 to 1,359 for Arsenal Tech while KIPP saw an increase in the number of Latino students from 40 in 2021-2022 to 82 in 2024-2025.Enrollment increased at middle schools in the neighborhood driven by growth in the number of Black and Latino students. Harshman Middle School had the fastest increase in enrollment, adding 237 students from the 2023-2024 school year to 2024-2025.
Elementaries in the neighborhood have shown mixed increases and decreases in enrollment throughout the years. KIPP Elementary has seen a yearly increase in students since 2018-2019. Paramount Brookside and Gregg School 15 Elementary have both seen a slight decrease from the 2023-2024 school year, but has overall seen a steady enrollment since 2018-2019. Brookside 54 and Lowell School 51 have seen inconsistent enrollemnts over the past 5 school years.
English language learners
The percentage of English language learners increased from 2018-19 to 2022-23 across most of the neighborhood schools.
Before the pandemic, Brookside School 54 had 11 percent of students that were English language learners. That has increased to nearly half of students in the 2024-2025 school year. Arsenal Technical High School has the highest rate of English language learners of all schools in the neighborhood.
Attendance rates
Chronic absenteeism spiked in 2020-21 relative to 2019-20, likely due to the Covid pandemic and the associated changes in schooling.
The State of Indiana defines chronic absenteeism as the share of students who miss 10 or more days of school. Neighborhood school chronic absentee rates increased over 20% in most schools, sometimes reaching rates over 70% in 2020-21. The most impacted schools include Arsenal Tech, Thomas D Gregg, Brookside School, Urban ACT, and Kipp Legacy High.
Math proficiency
Both the number and percentage of students passing the math ILEARN exam in grades 3-8 within the neighborhood dropped substantially from 2018-19 to 2022-23, except for Grade 5.
Grades 7 and 8 had the lowest passing rates in 2022-23.
English proficiency
Both the number and percentage of students passing the ELA ILEARN exam in grades 3-8 within the neighborhood dropped substantially from 2018-19 to 2022-23.
Grades 3 and 7 had the lowest passing rates in 2021-22.
Mobility Rates
Brookside School 54 and Washington Irving had the highest rates of students leaving or entering during the school year.


Learn through College and Career
This section reports graduation and college-going rates, in addition to students' self-reported post-secondary plans and parental support.
Graduation rates
Graduation rates vary widely overall between high schools within and near the neighborhood, with some schools seeing marked decreases in graduation rates from 2019 to 2022, likely due to the Covid-19 pandemic.
High school graduation rates also vary by race, with racial disparities seen in some schools, but not as much in others. Differences in graduation rates among races should be understood as the effect of socioeconomic inequality.
Next Up
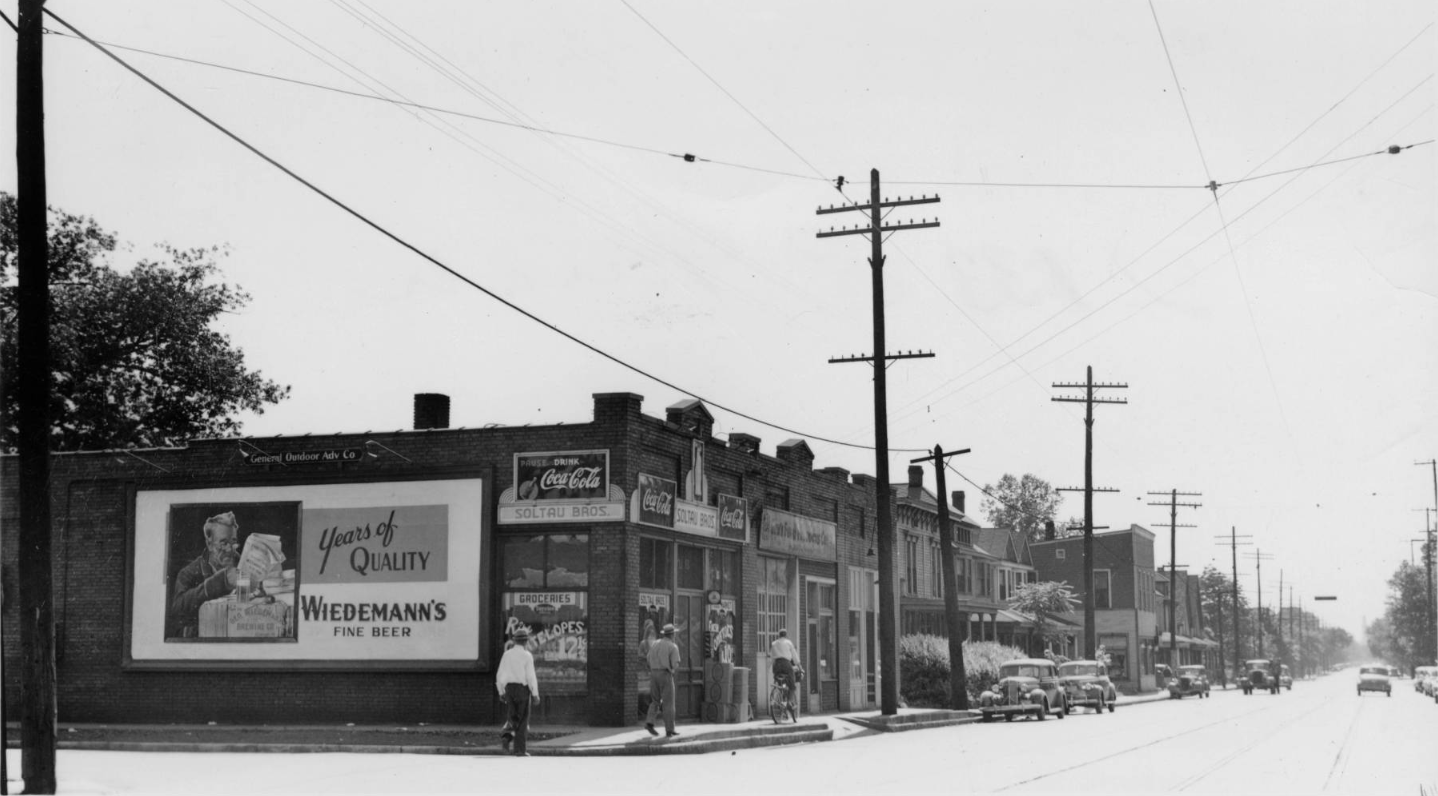 Michigan Street a Century Ago: A Neighborhood Node
Two miles east of downtown, Michigan Street is largely vacant. But in the early 20th century was a bustling corridor for the Willard Park and St. Clair neighborhoods. Discover the history and demographics of these blocks.
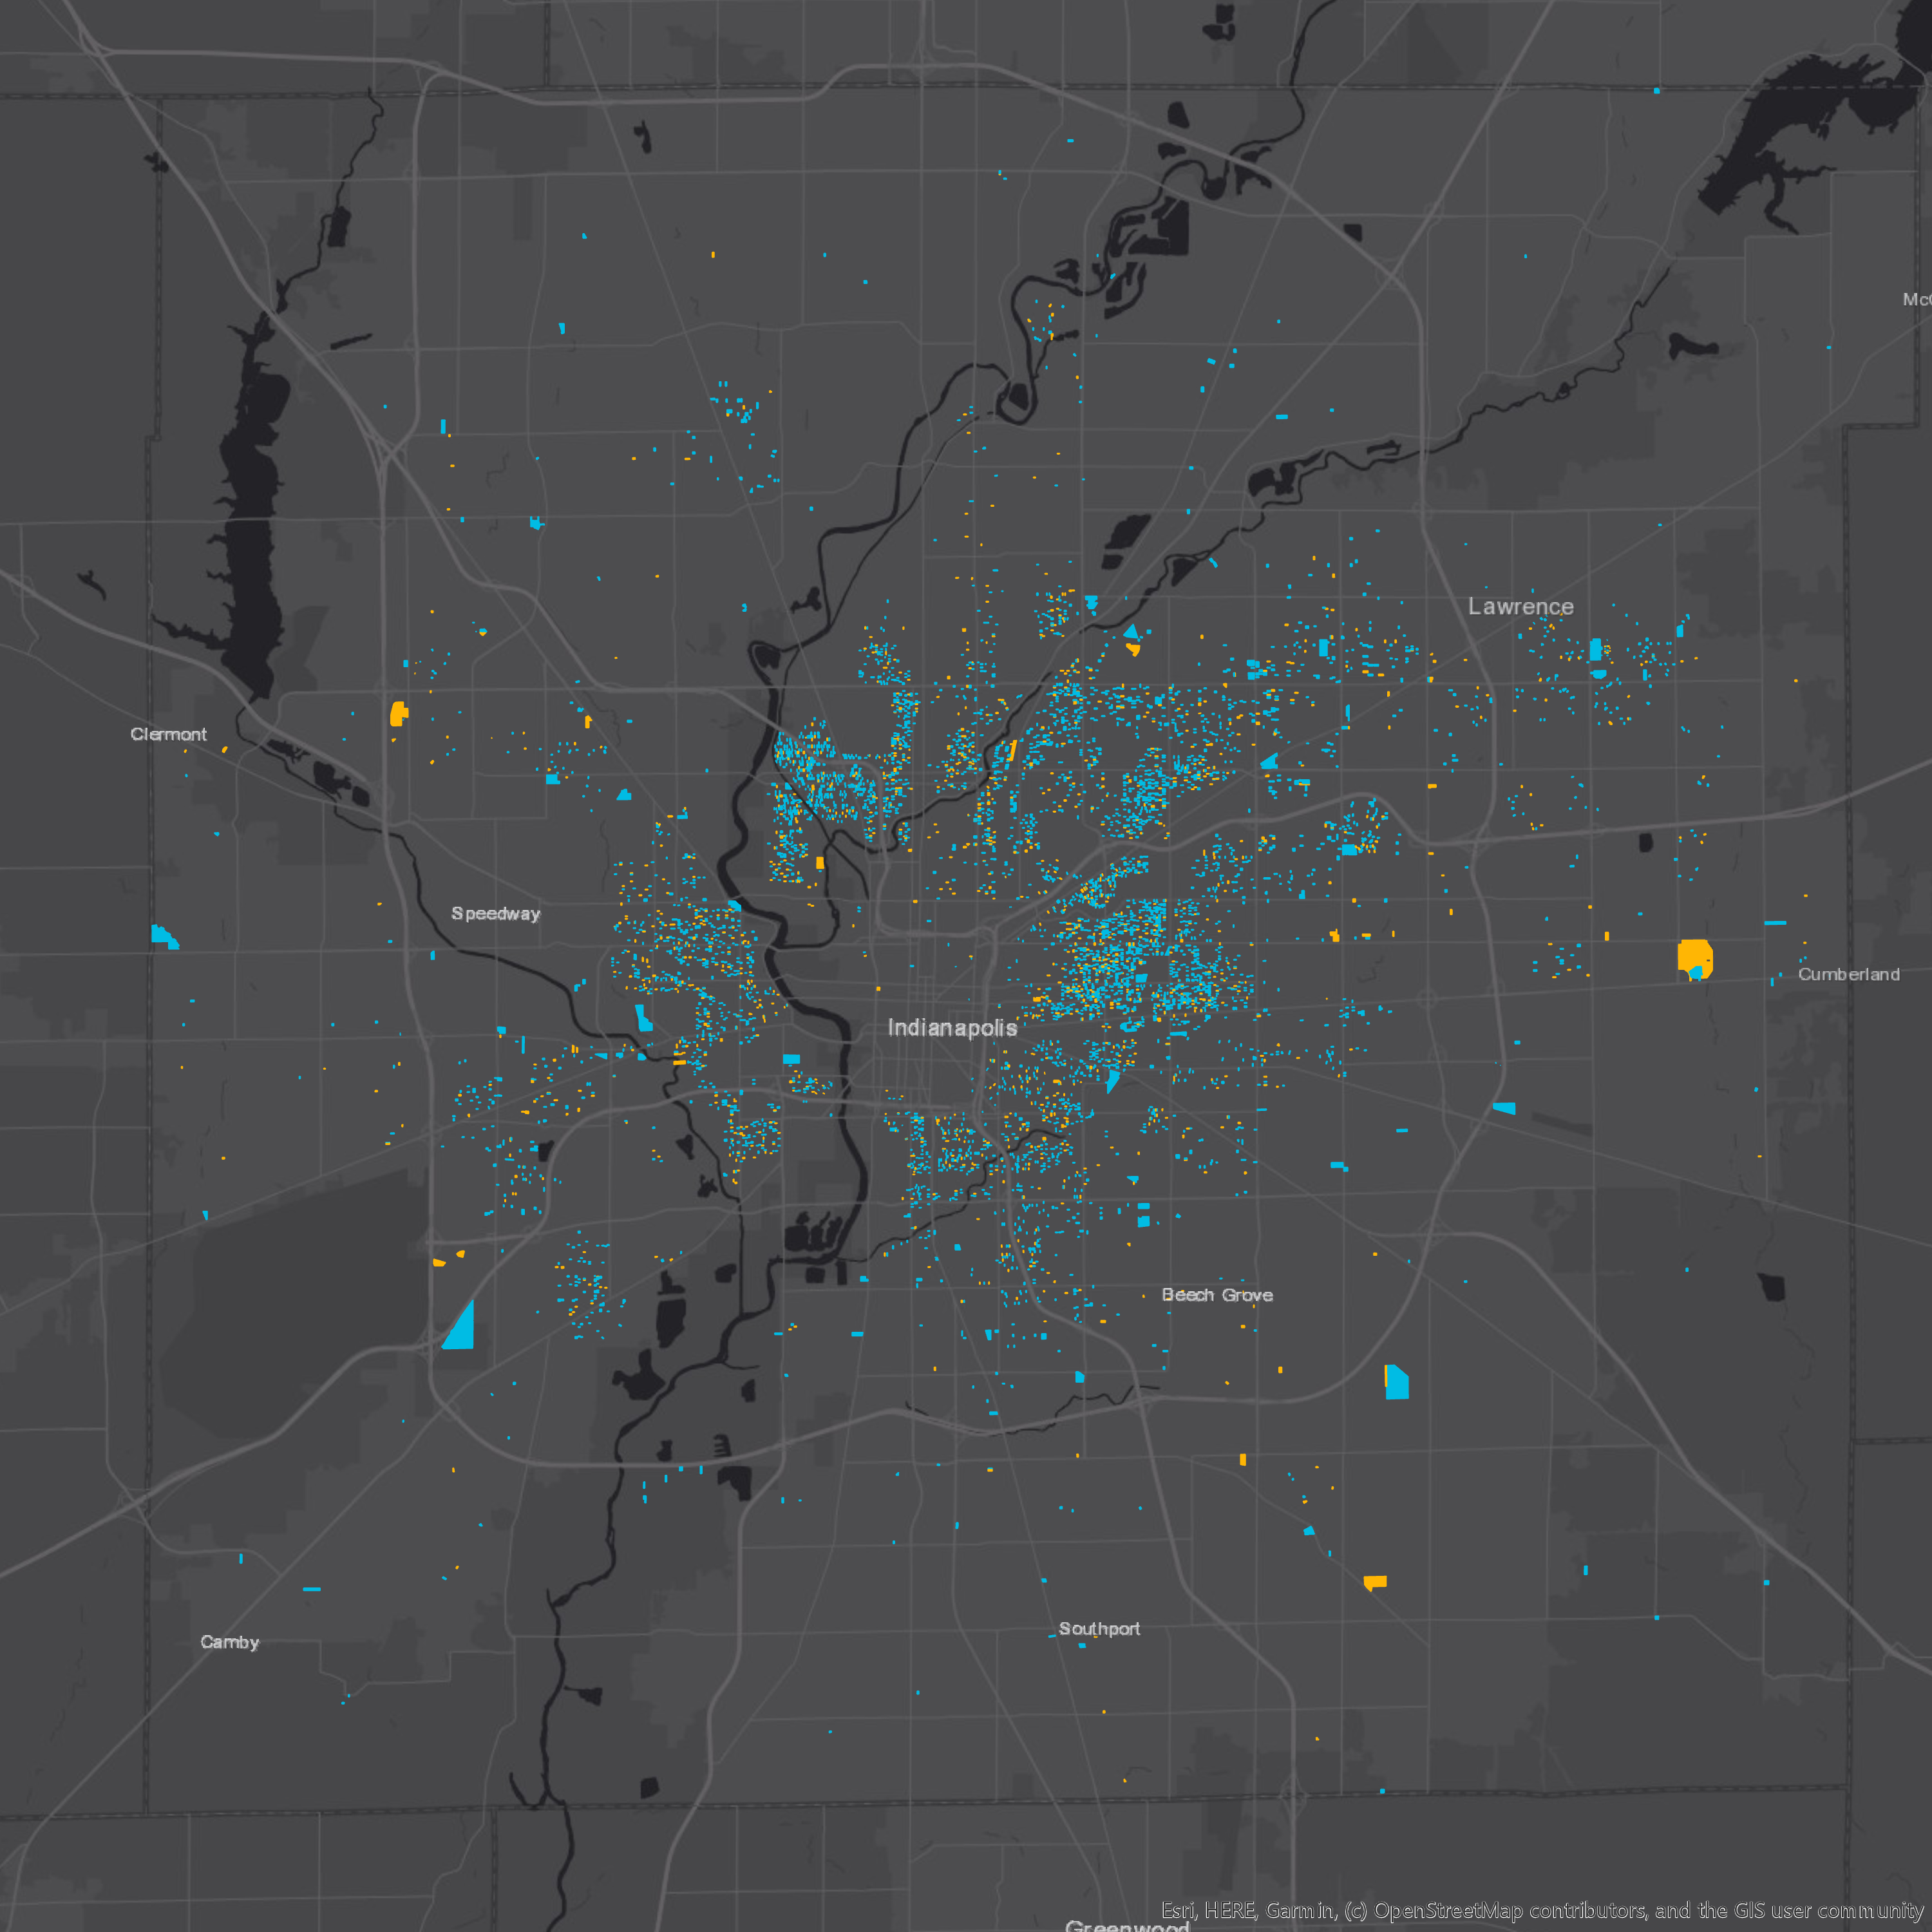 Candidate’s Housing Proposal Calls Attention to How We Measure Vacancy Rates
It’s hard to know exactly how many vacant units are in Indianapolis, but it’s clear that many neighborhoods struggle with hypervacancy.
 Increasing Mortgage Values
Mortgage values are increasing across the county, indicating an increase in housing prices. We explore the fastest changing areas, as well as places with very little little mortgage activity.
 Neighborhood Change 1970-2016