A lot of media attention is paid to one kind of housing crisis: low supply in high-demand markets has led to high prices. But there is another housing crisis present in many cities: high vacancy rates, which indicate housing markets that are not working, create blight, and lower tax revenues and the ability of cities to provide services.
Recently, presidential candidate and South Bend mayor Pete Buttigieg announced a policy proposal to target vacancy. His proposed Community Homestead Act is part of his campaign’s larger Douglass Plan to address systemic racism. Cities would apply to a new “Homeownership Fund” from the Dept. of Housing and Urban Development. Cities would landbank vacant properties (acquire them in bulk for future redevelopment, which Indianapolis does through Renew Indianapolis). Residents could apply to receive these properties with a forgivable 10-year loan. If they live in the home for 10 years, the loan is forgiven, and all the appreciation in the home’s value is theirs. If they sell the house before 10 years is passed, they repay a part of their profits to the Homeownership Fund. The policy is based on the 21st Century Homestead Act from Mehrsa Baradaran.
This program is designed to build equity for households. This differs from the community land trust model, which effectively preserves affordable housing, but does not allow much of the increased home value to accrue to owners. This new proposal aims to build wealth for Black Americans, according to Buttigieg’s campaign site. While eligibility is not explicitly based on race, the program uses economic and geographic factors to direct these resources to Black households. To be eligible, participants would need to earn less than the average household in the region and either live in a program pilot area or live in an area that was redlined or racially segregated. They need to have been a resident of these eligible areas for at least three of the last ten years.
communicates rudely, expresses disrespect, uses sarcasm and mockery; Trying to manipulate, overtly control a man; Is interested only in the purse of a new acquaintance; Excessively capricious, a lot of self-image. Politely finish the conversation – the best solution free hook up apps in these cases. This way the guy saves himself time and nerves, and the girl will not get her hopes up.
What is vacancy, and how do you know if it is too high?
A vacant property is one without an occupant, for example a storefront with no tenant, a home with no one currently living there, or an apartment that is sitting empty. There are some benign reasons that a building could be vacant. For example, if a homeowner moved to another house but has not sold their previous home yet, that property would be vacant. If someone owned a home as seasonal residence, that would be a vacant housing unit for the part of the year when they do not live there.
There is some amount of vacancy that is healthy and makes it possible for households to move from one home to another. According to Richard Florida, a vacancy rate of over 12 percent is high and over 20 percent is “hypervacancy”.
Vacancy rates high and increasing in inner city and inner suburbs
Vacancy rate by development band
In the Indianapolis region, vacancy is high in older suburbs like Mid-Century Neighborhoods and Interstate Neighborhoods. Pre-War Neighborhoods are experiencing hypervacancy. (Learn more about these trends in our report The Changing Landscape of Poverty.) Vacancy increased everywhere during the Great Recession (notice the difference between the 2000 Census and the 2010 Census), but development bands have diverged since then. While outer suburbs recovered, vacancy continued to rise in Pre-War Neighborhoods and older suburbs.
How do you measure vacancy?
In one sense, vacancy is well measured across the country. The American Community Survey estimates the number of vacant housing units for communities across the country each year. And yet, many cities have developed their own methodologies to understand vacancy on a more granular level. These methods vary from city to city, making comparison difficult. Indianapolis’ method considers if a property’s water has been shut off, if tax payments have been missed, and if there are code enforcement citations from the Bureau of Neighborhood Services.
Because we love data and we are sure you do also, we will dig in to each of these ways of measuring vacancy. We will see how they differ and what they each can tell us
Half of vacant units are not for sale or rent.
Percent of vacant units by reason for vacancy, 2017
American Community Survey
Each year, the American Community Survey (ACS) asks about one percent of American households detailed questions about their housing, demographics, income, and more. They use these surveys to estimate statistics for cities, counties, and even small areas like census tracts. When the ACS measures vacancy, it includes properties that are for rent, for sale, and other benign reasons that are a natural part of any housing market.
According to the ACS, there are an estimated 51,000-58,000 vacant housing units Marion County, which is 12-14 percent of all housing units. Eight percent of these vacant units are for sale and a quarter of them are for rent. Over half are vacant without being for sale, for rent, or a seasonal home. These 30,000 units are more likely to become abandoned, blighted, and have unpaid taxes. Where these units are concentrated, the housing market is not functioning well.
Overall vacancy is more widespread throughout Indianapolis
Vacancy rate by tract, 2017
But when you remove properties for sale or rent, vacancy is concentrated in Center Township
"Other" vacancy rate by tract, 2017
Many areas are experiencing hypervacancy, according to Richard Florida’s threshold. In Marion County, more than one quarter of all census tracts have a vacancy rate of at least 20% (as seen in the first map). For many of the tracts outside Center Township, this is driven by an excess of properties for sale or rent. However, the second map shows the percent of housing units that are vacant some reason excluding being on the market or being seasonal. These are mostly in Center Township.
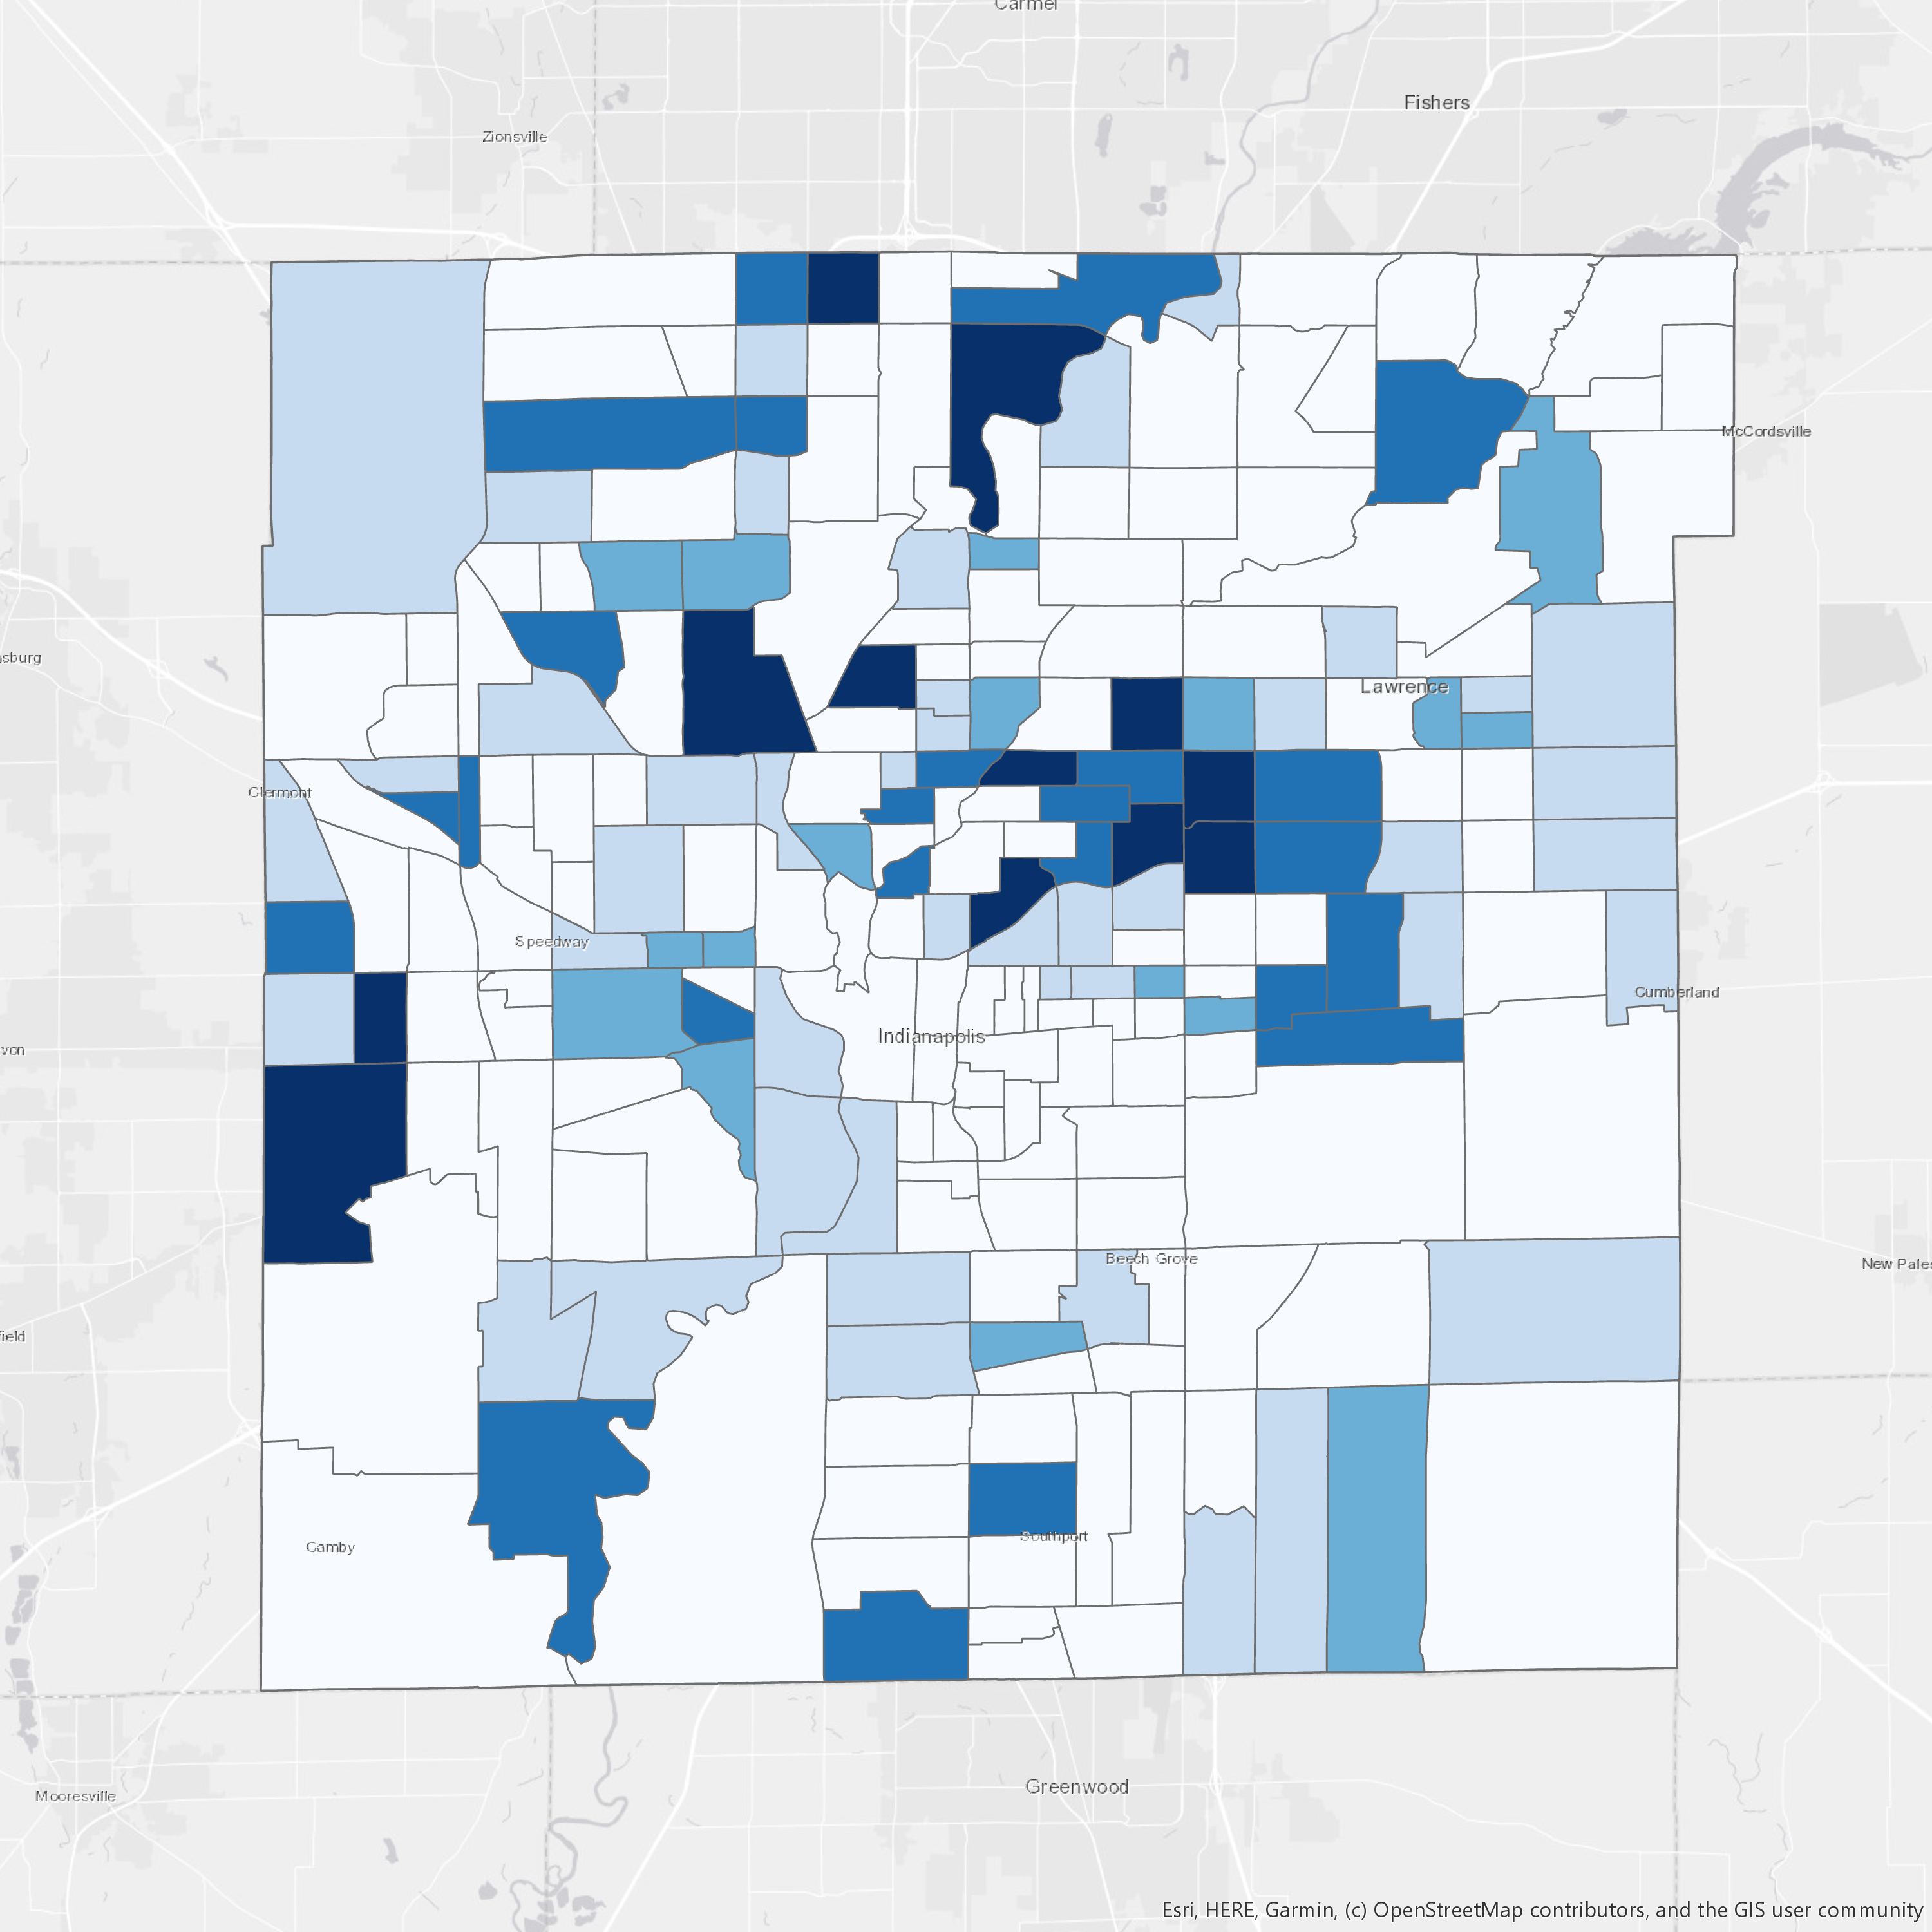
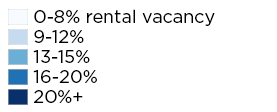
The maps below show that many areas outside Center Township struggle from very high rental vacancy rates. Downtown and the Near Eastside have rates that are below eight percent, the range for a healthy rental market. (Rental units are more likely to be vacant because they turn over more often.) But in older suburbs in Warren Township and Pike Township, rental vacancy rates are sometimes over 16 percent.
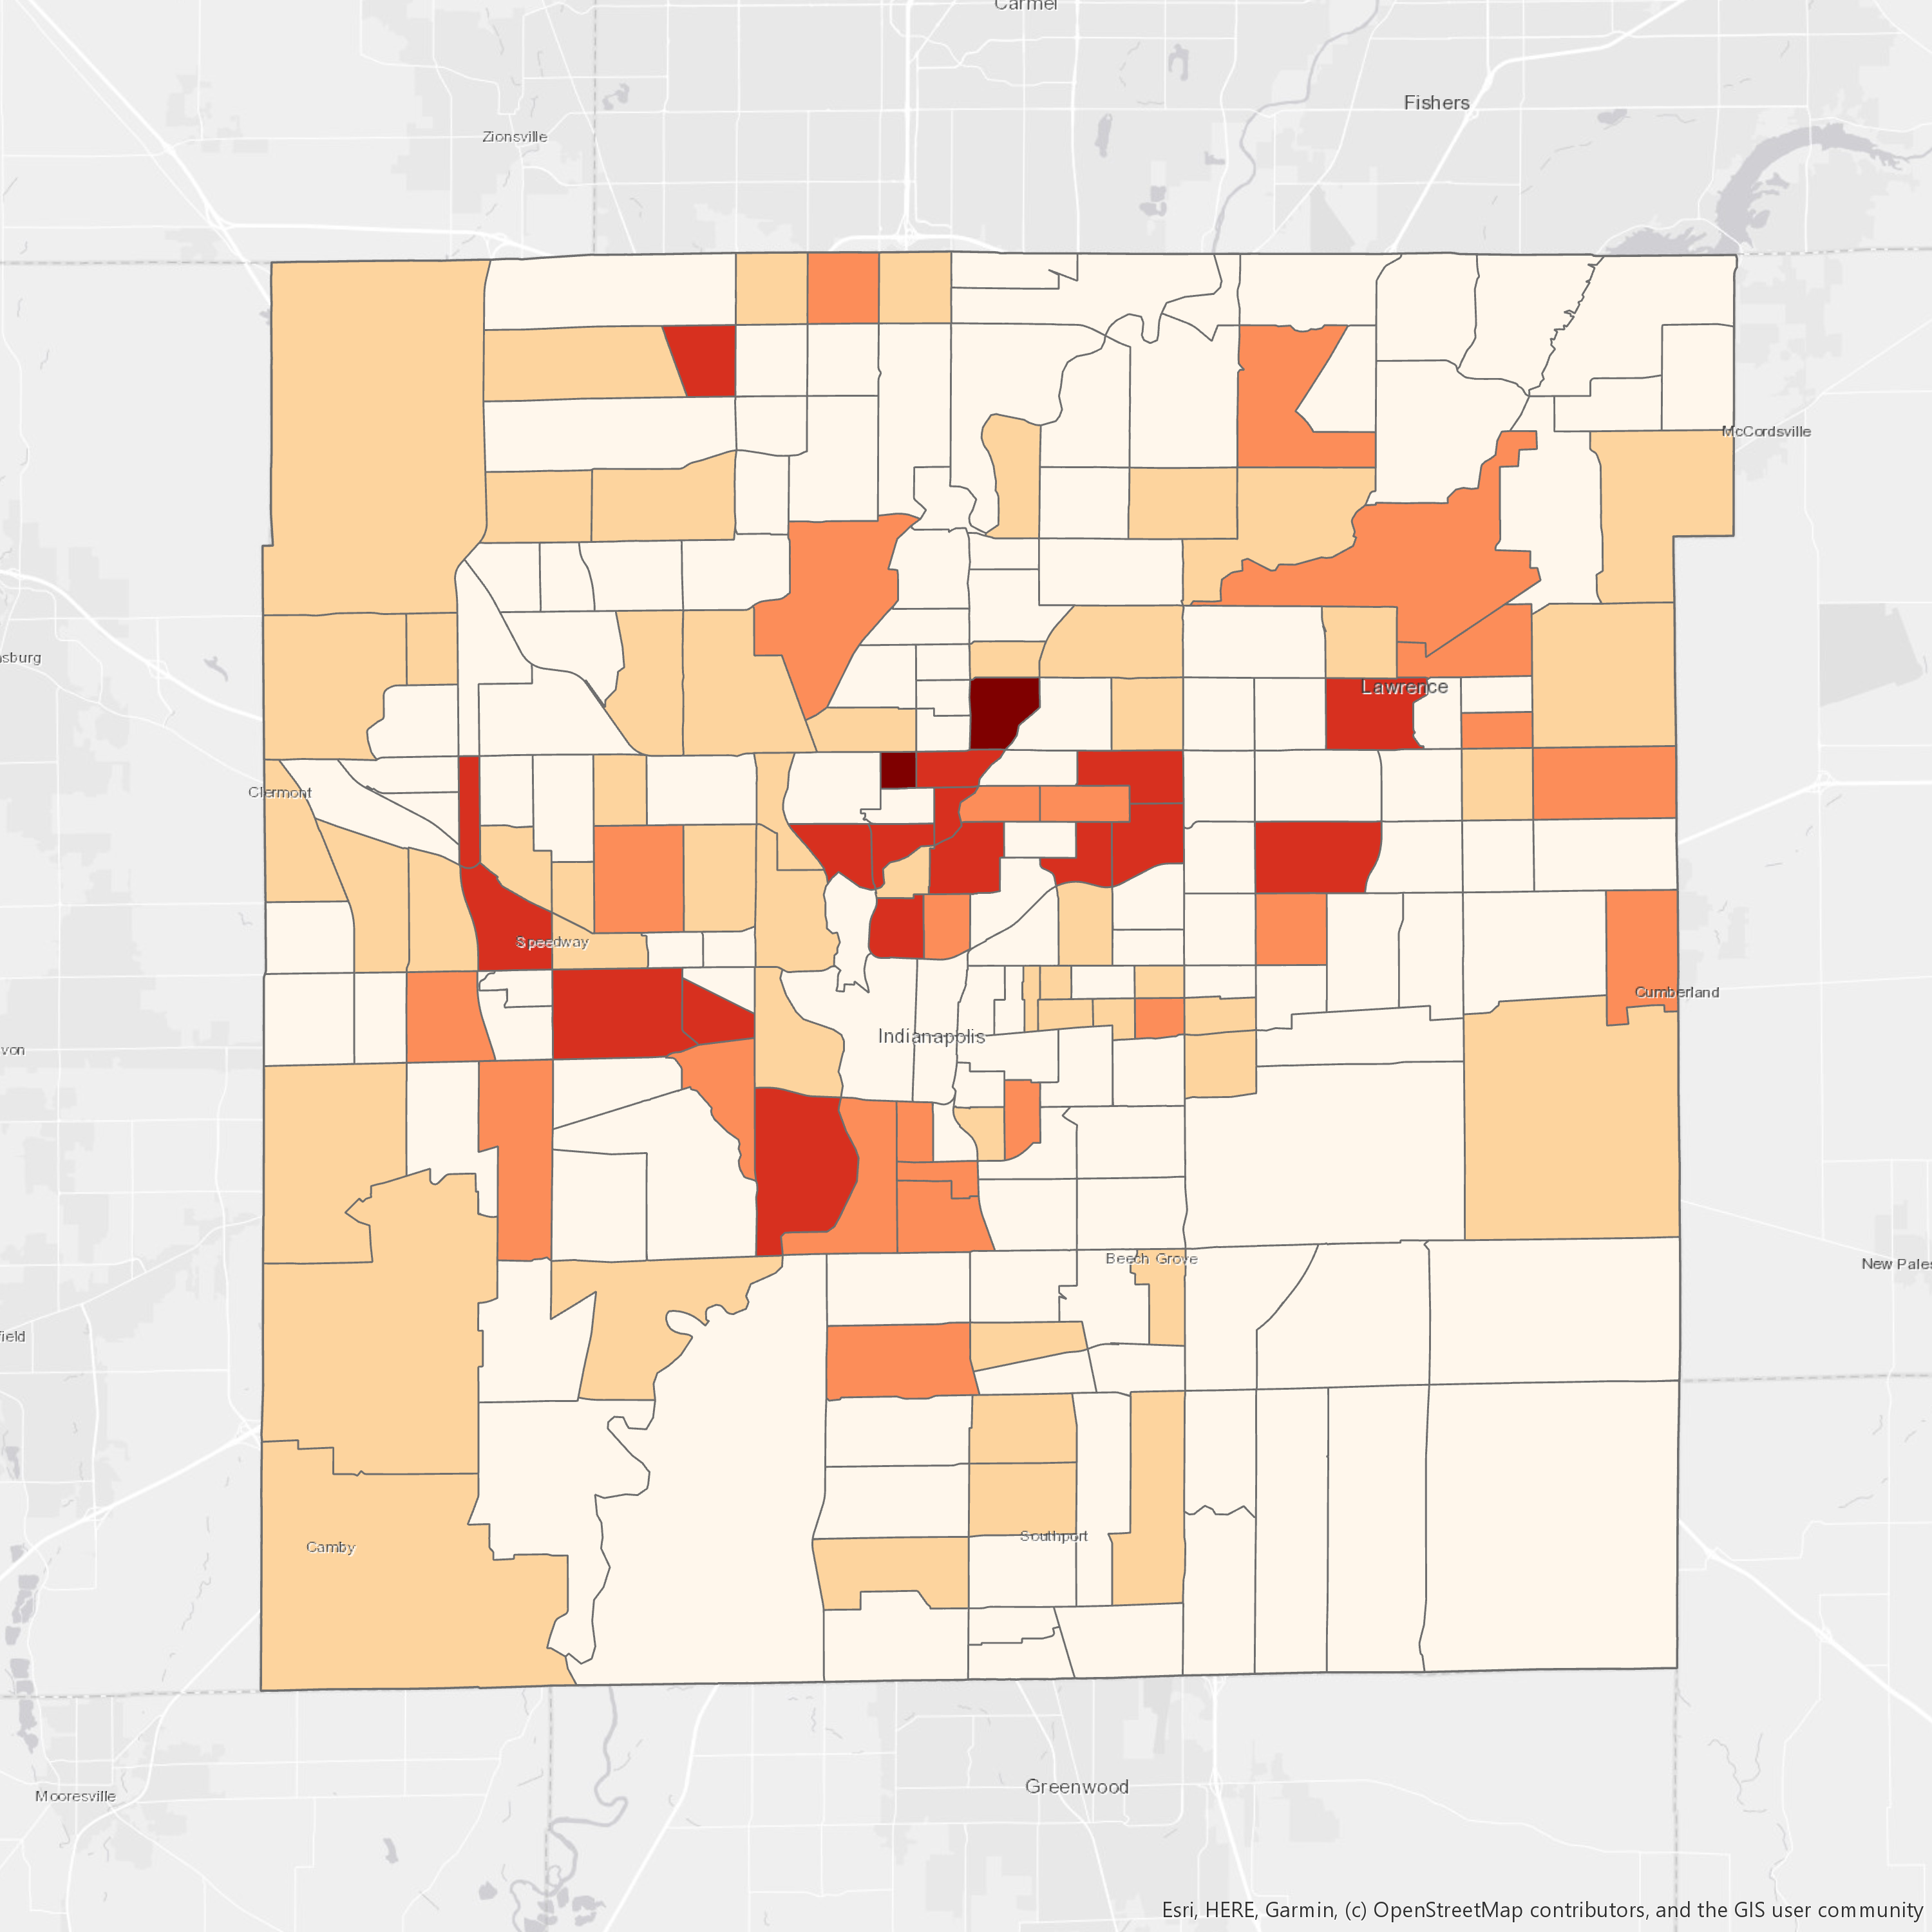
Vacancy rates for owner-occupied homes are high in Center Township north of Interstate 70 and south of 38th Street. Some areas outside Center Township also have high owner vacancy rates, like the west side, Garfield Park, and Lawrence.
Rental Vacancy Rate
Owner Vacancy Rate
The ACS vacancy data indicates that one-in-four neighborhoods are experiencing hypervacancy. Vacancy is highest in Center Township but growing in older suburbs. There are many Mid-Century Neighborhoods and Interstate Neighborhoods with vacant properties for sale or rent, meaning demand is low for these places. But in Center Township, there are many neighborhoods where more than a fifth of the housing is vacant and off the market. These properties may have been vacant for a long time and could be abandoned or in disrepair.
Indianapolis Vacancy Definition
In order to know exactly which properties suffer from long term vacancy or abandonment, the city has developed a set of criteria based on data from utilities, tax records, and the Bureau of Neighborhood Services (BNS).
A property is vacant if it has had water shutoff for a year, has an open unsafe building order from BNS, or has had no water and a vacant board order in the last six months.
A property is abandoned if it meets the criteria above and it has 1) two delinquent tax payments, 2) one delinquent tax payment and an unsafe building order, or 3) an unsafe building order and no active permit.
This is different from the ACS in a few of ways. First, this applies to all properties, not just housing units. Second, this would be less likely to include properties that are for sale or rent but cannot find a buyer or tenant. Finally, this metric is about parcels (or individual pieces of land) rather than housing units. When an apartment building is vacant, that would only count as one vacant parcel rather than many vacant housing units.
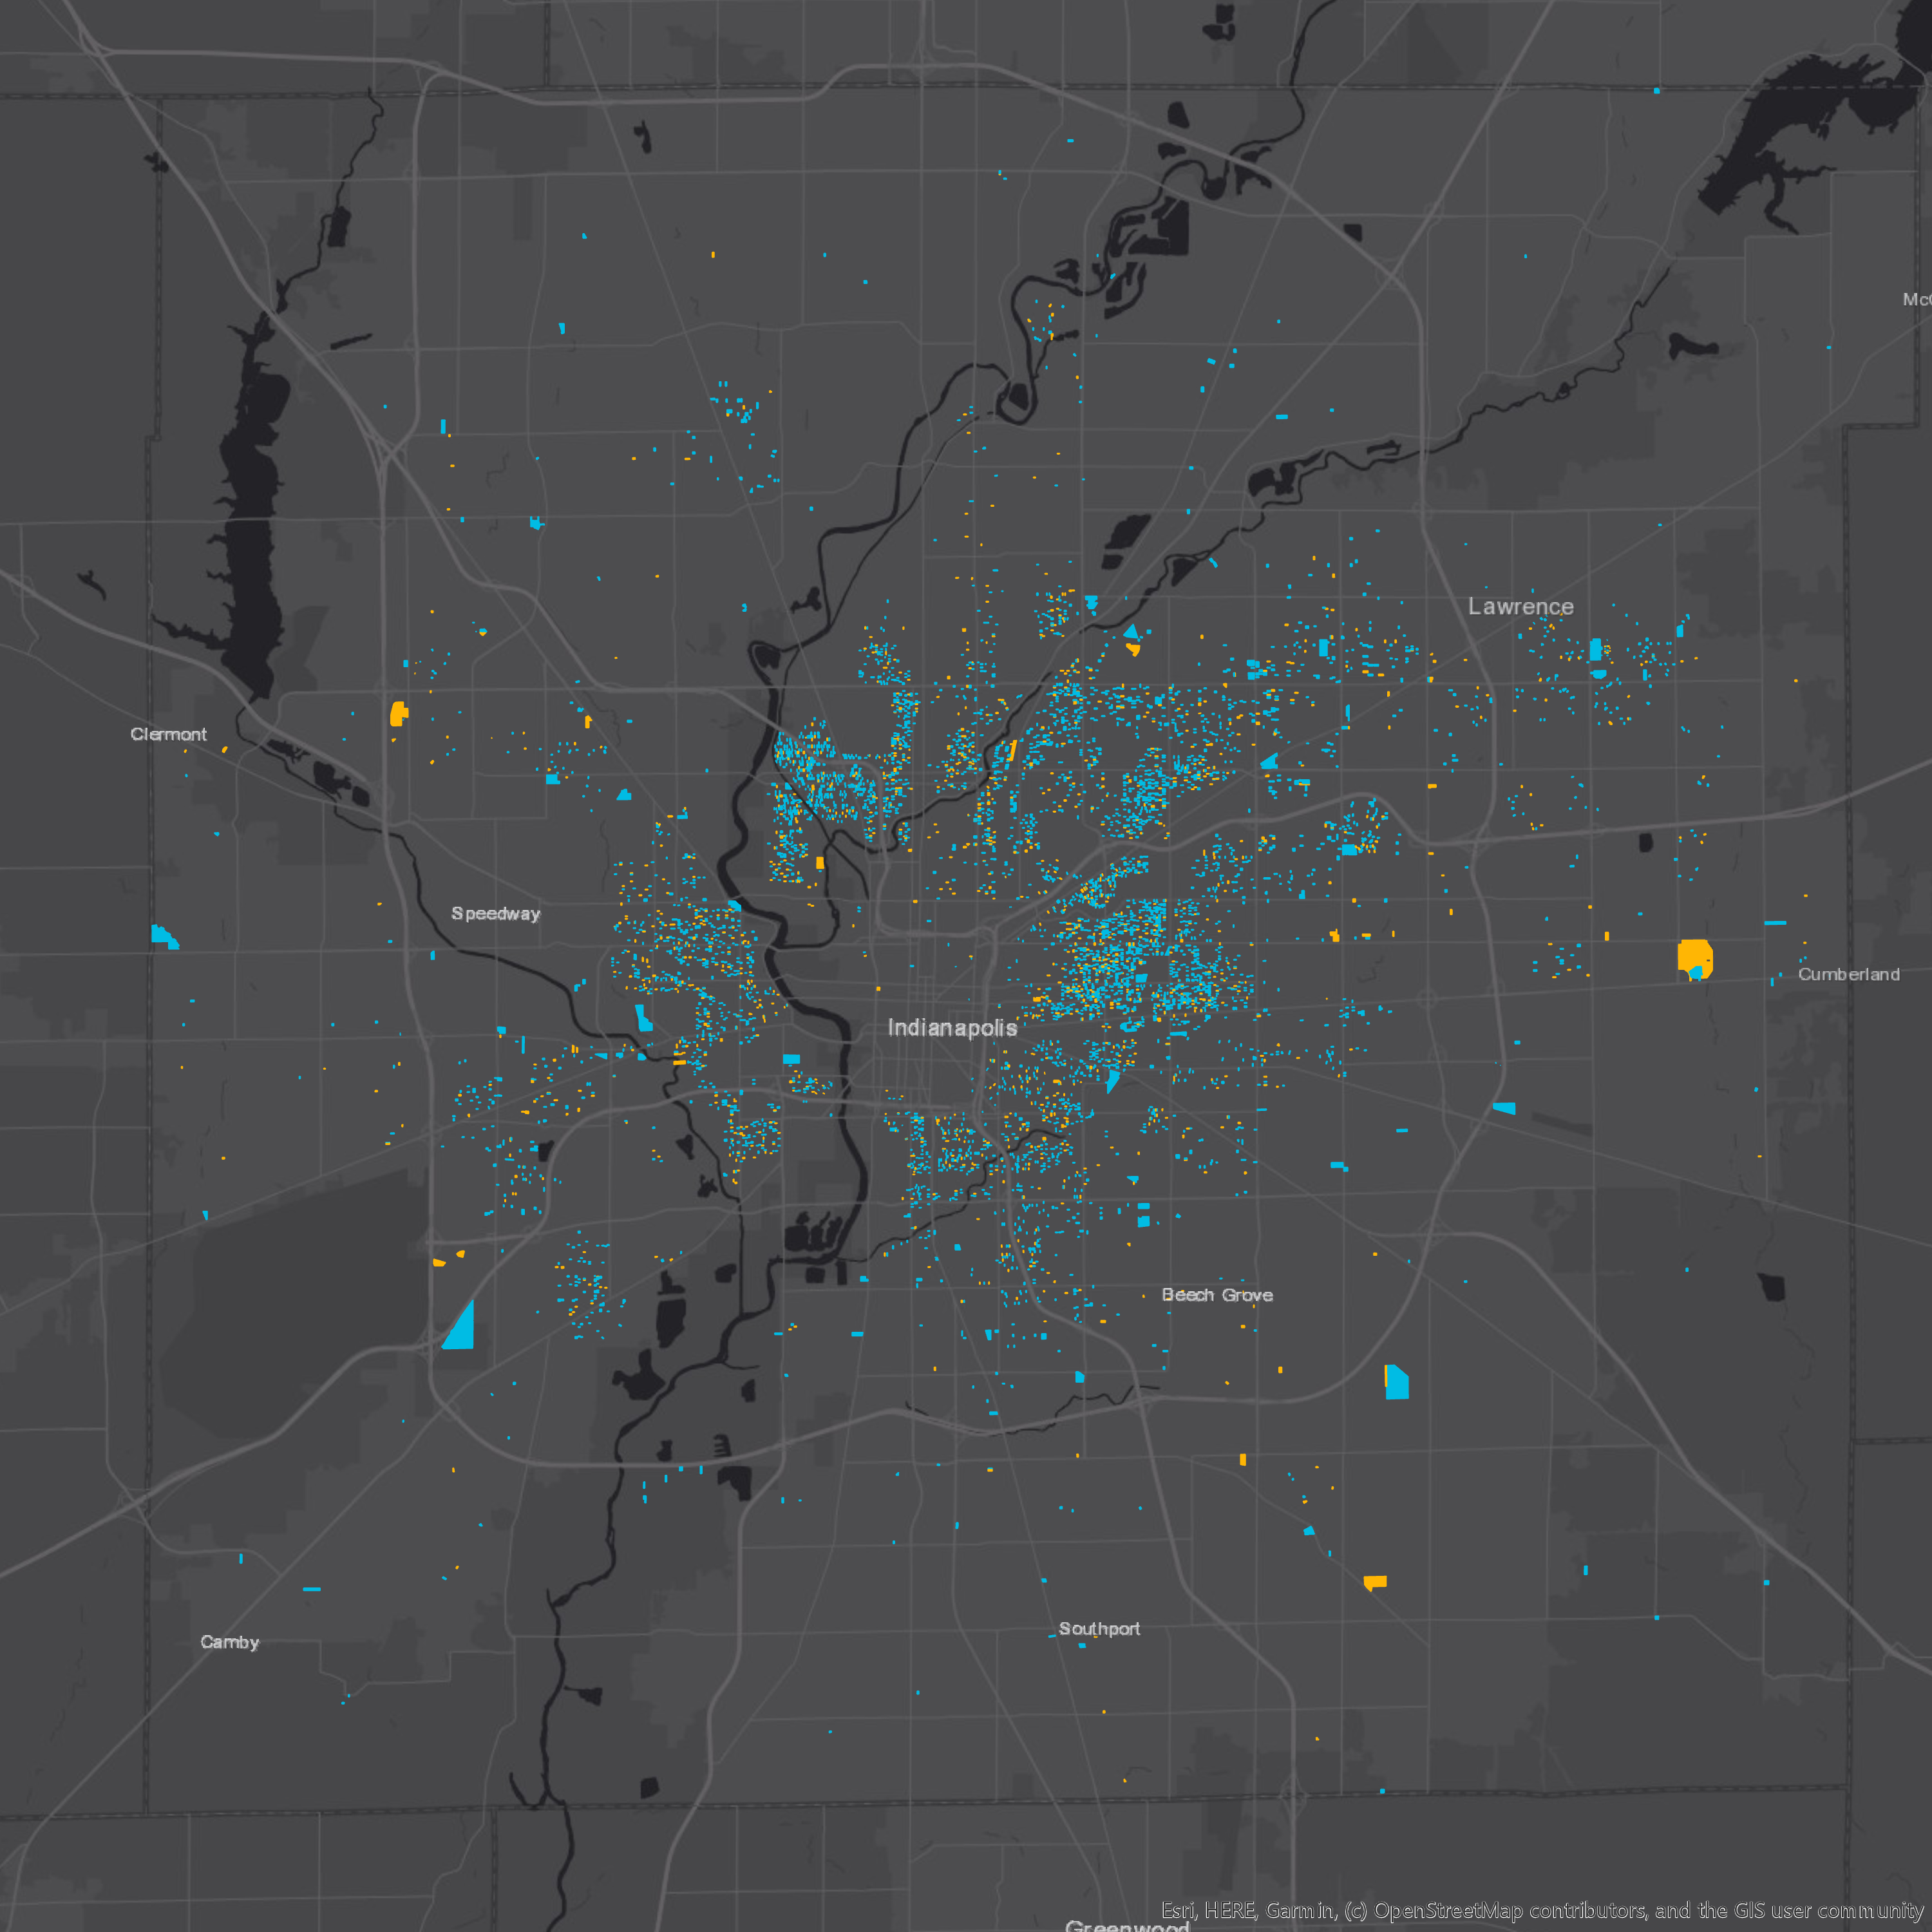
The city makes this data freely available on its data portal, data.indy.gov. We’ve developed a user friendly view of this map, below.
This shows largely the same pattern we saw with the ACS data. The center of the city has more vacant properties, with the exception of downtown and some adjacent neighborhoods. There are some vacant properties northeast and southwest of Center Township.
It’s fascinating to see this data down to the exact parcel, but to compare this to ACS vacancy data, let’s summarize this for each neighborhood (or census tract). The map below shows the percent of all parcels in each tract that are vacant or abandoned.
The vacancy rates from this method tend to be lower than the ACS vacancy rates. Before we compare them, however, we should underscore the difference. The city’s method measures all properties, not just housing. And it measures long-term vacancy more rather than housing units that are on the market and unsold or unrented. Because of this, we will compare it to the “other vacancy” category from the ACS. This will exclude units on the market.
The ACS estimates 30,000 housing units that are vacant and not on the market or seasonal. The city’s method finds 7,256 parcels that are vacant or abandoned. From the ACS data, the highest vacancy rates are 35-40% of housing units, while from the city’s data the highest rates are 15-20% of parcels.
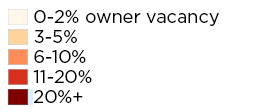
To compare how tracts fared under the city’s metric versus the ACS metric, we ranked all tracts. A ranking of one means the lowest vacancy rate. Then we can measure how much ranks changed between the city metric and the ACS metric.
A few tracts stand out. Areas near Fletcher Place and Fountain Square tend to look better using the city’s metric. While the ACS estimates there are 61 housing units in Fletcher Place that are vacant and not on the market, the city’s data finds only two properties that match their criteria. At 38th Street and Post Road, tract 3308.03 has an estimated 567 units in the “other vacant” category, according to the ACS. But the city’s method finds 64 vacant properties.
Many neighborhoods on the northwest side of the city tend to perform better under the city’s methodology, but many areas in Decatur and Franklin Townships perform worse.
Grace Tuxedo Park (tract 3549) performs worse under the city’s metric. The city finds that 14% of parcels are vacant, which is the seventh worst rate in the city. The ACS estimate is not great, but still places it as only the 49th worst vacancy rate in the city.
What explains these differences?
Unfortunately we don’t know why these rates are different. But we will at least start with some ideas. First of all, the ACS data are estimates and have some margin of error (just like election polling and other surveys). Maybe in some areas the city’s method gets closer to the “real” number.
In some neighborhoods, that difference between a parcel and a housing unit could be significant. In places with largely single family homes, one parcel is usually the same as one housing unit. But in areas with a lot of apartments, this could make the city’s vacancy rate lower than the ACS vacancy rate. In areas with a lot of vacant commercial or industrial buildings, the city rate could be higher than the ACS rate.
And finally, the ACS estimates at the neighborhood level are based off of five years of survey data. (Of course, if you’ve been to SAVI training, you already know all this.) The data we showed here is the most recent we have, and it is a rolling average from 2013-2017. The city’s data is real-time and was updated in June of 2019. This is the advantage of administrative data. So it could be that the city’s data is more accurate in certain places, and the ACS has not caught up yet.
Next Up
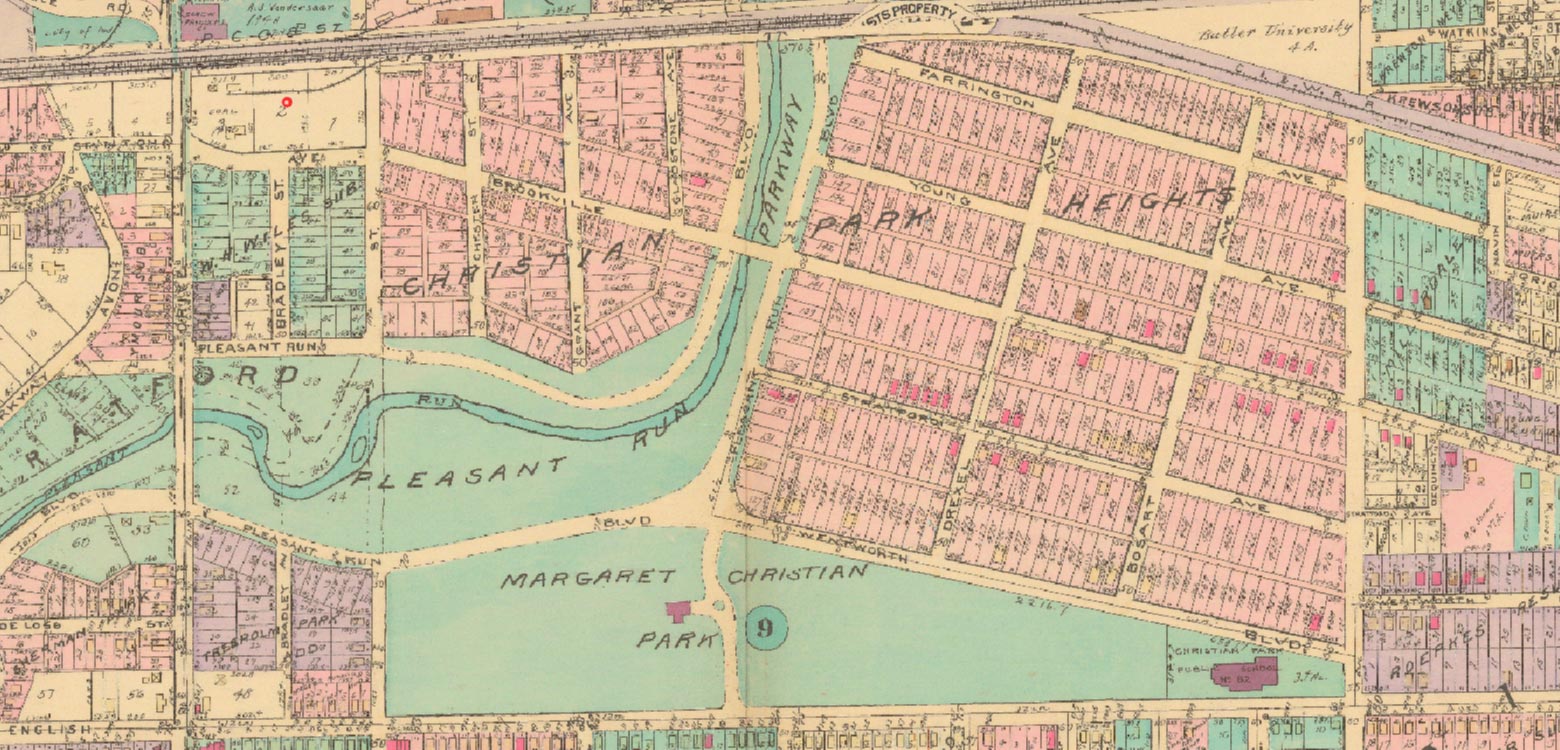 In Christian Park, a Postwar Neighborhood Experiences 21st Century Changes
Christian Park was subdivided in the 1920s, but mostly built after World War II. Once an all-white neighborhood with high home ownership, the area has become part of a Latino community on the southeast side, and home ownership has fallen.
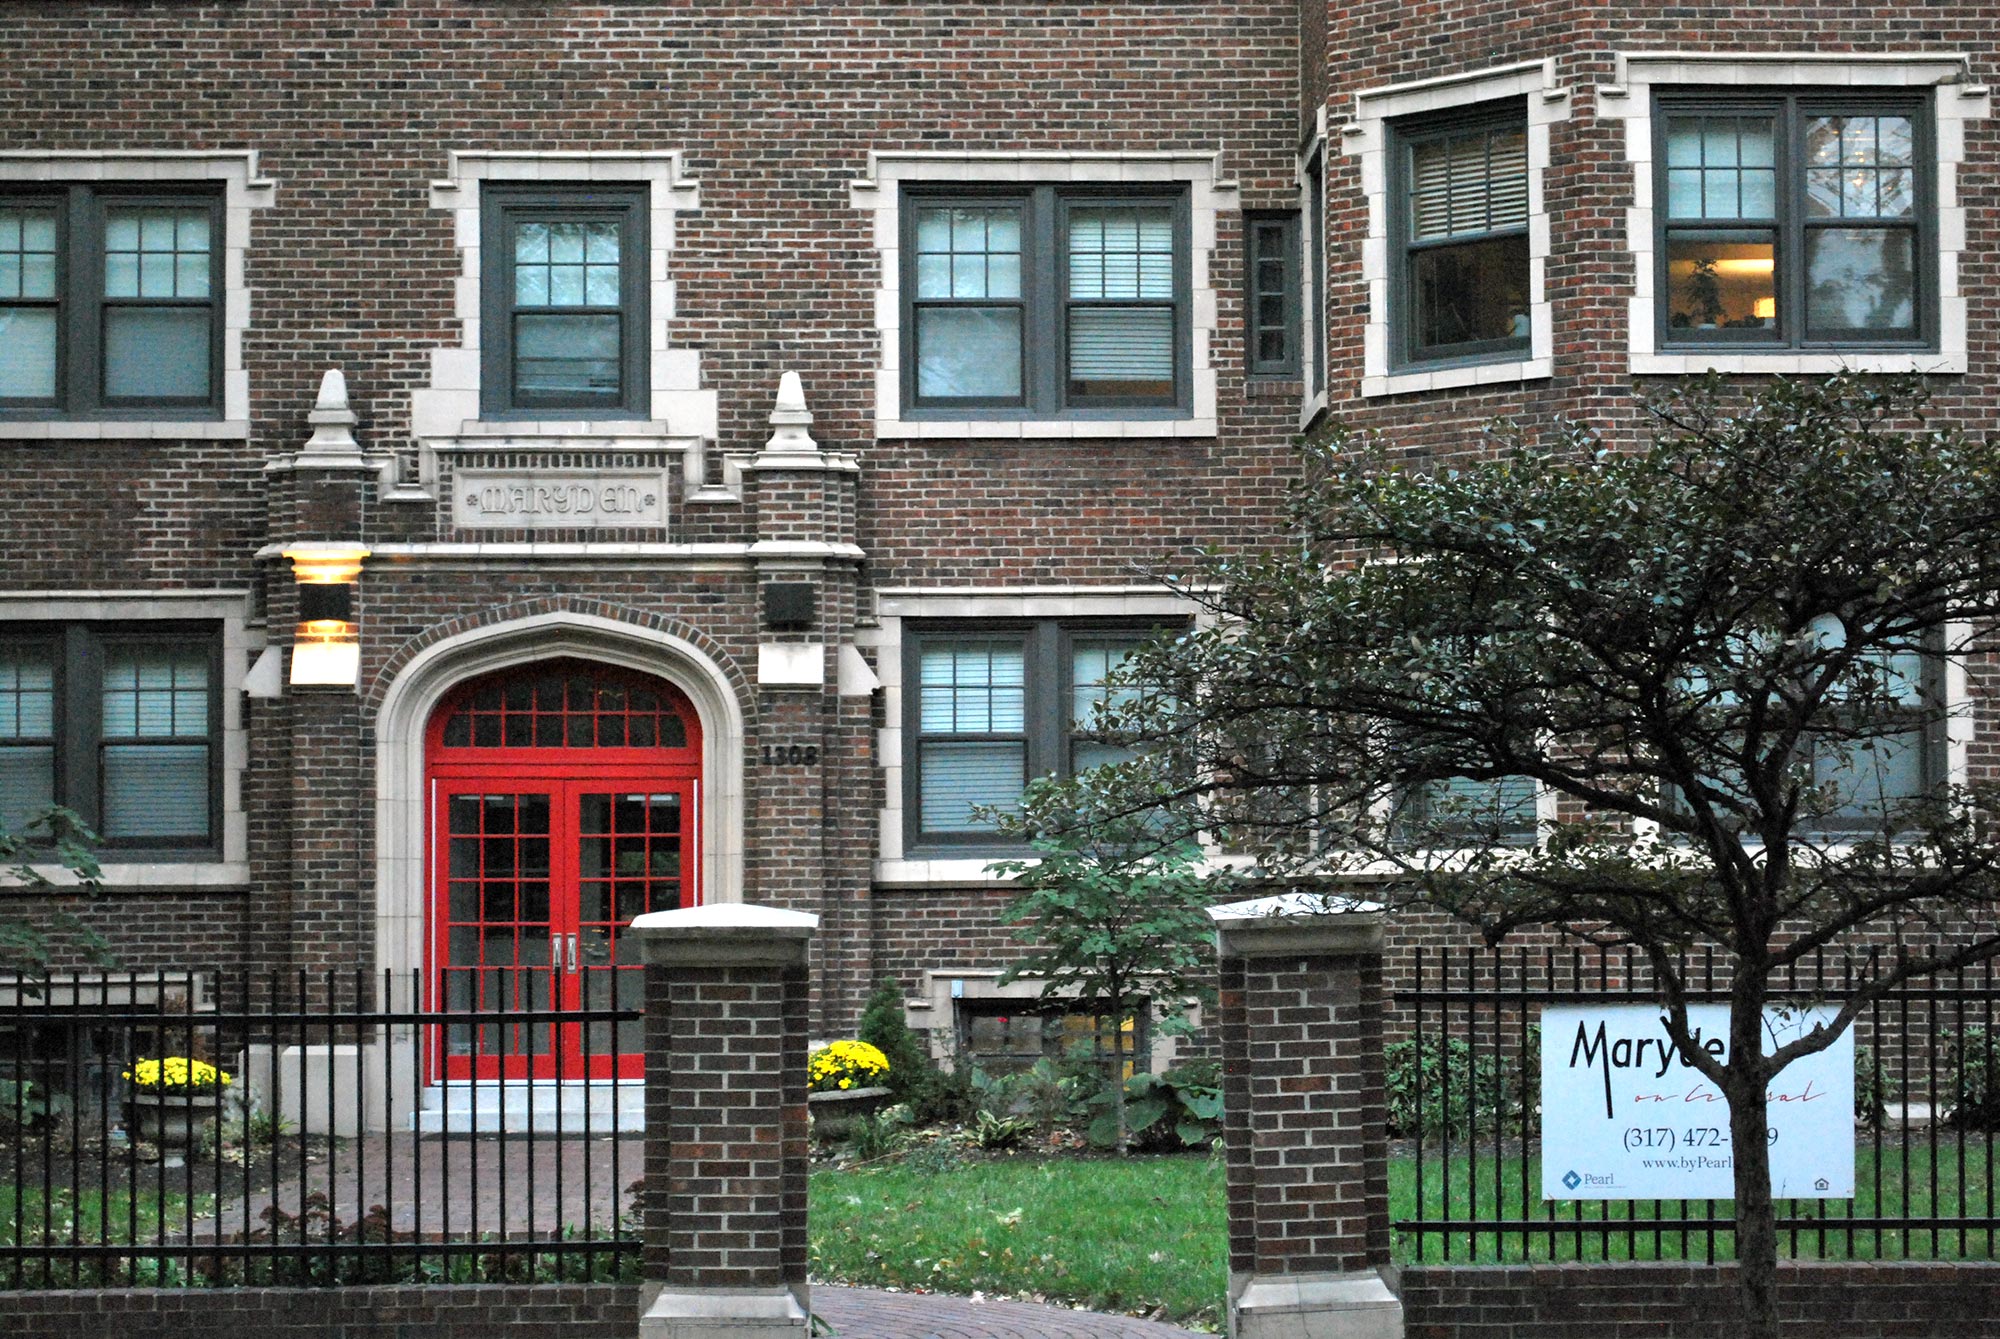 Indy’s Most Mixed-Income Neighborhoods
We measured income diversity in every neighborhood in the region, and the most mixed-income neighborhoods include the Old Northside, the tract containing Rocky Ripple and Crows Nest, and the area near Pike High School.
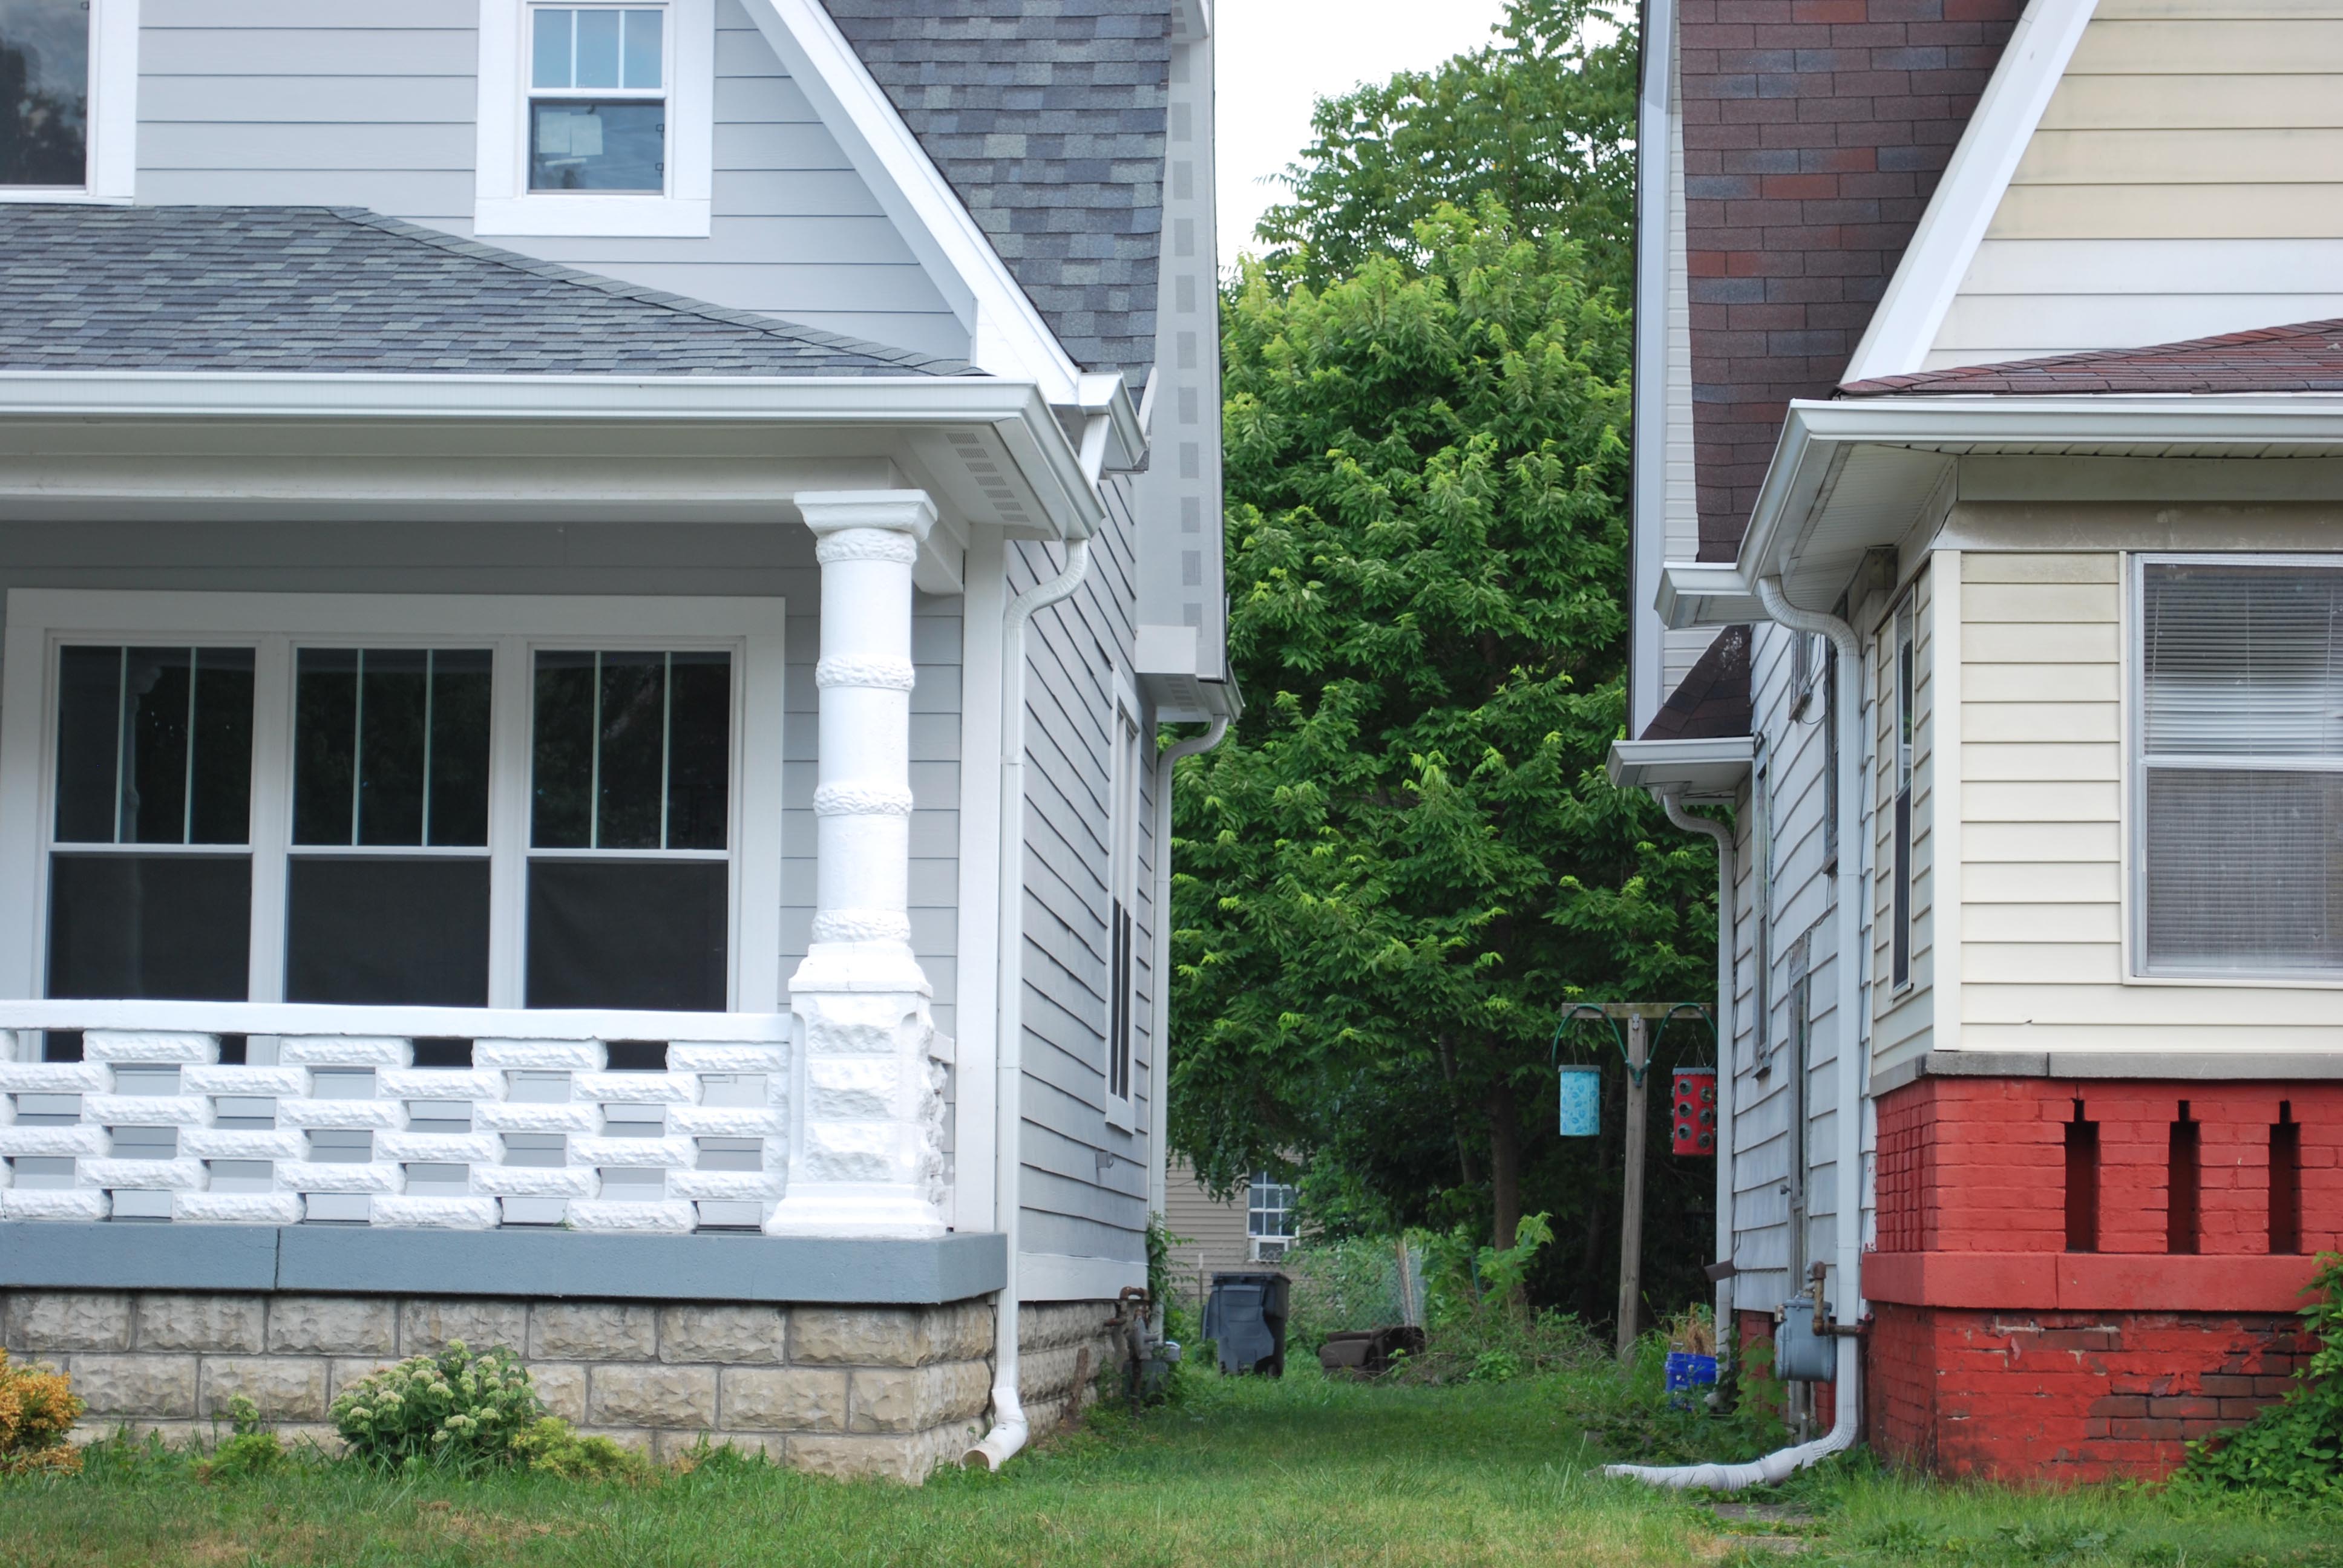 After Public Investment, St. Clair Place’s Housing Market Significantly Stronger
Mortgage activity in St. Clair Place shows a dramatic increase in home purchases and home value since 2007. The area is more diverse than ever and poverty is falling for people of color. But home buyers are still 76 percent white.
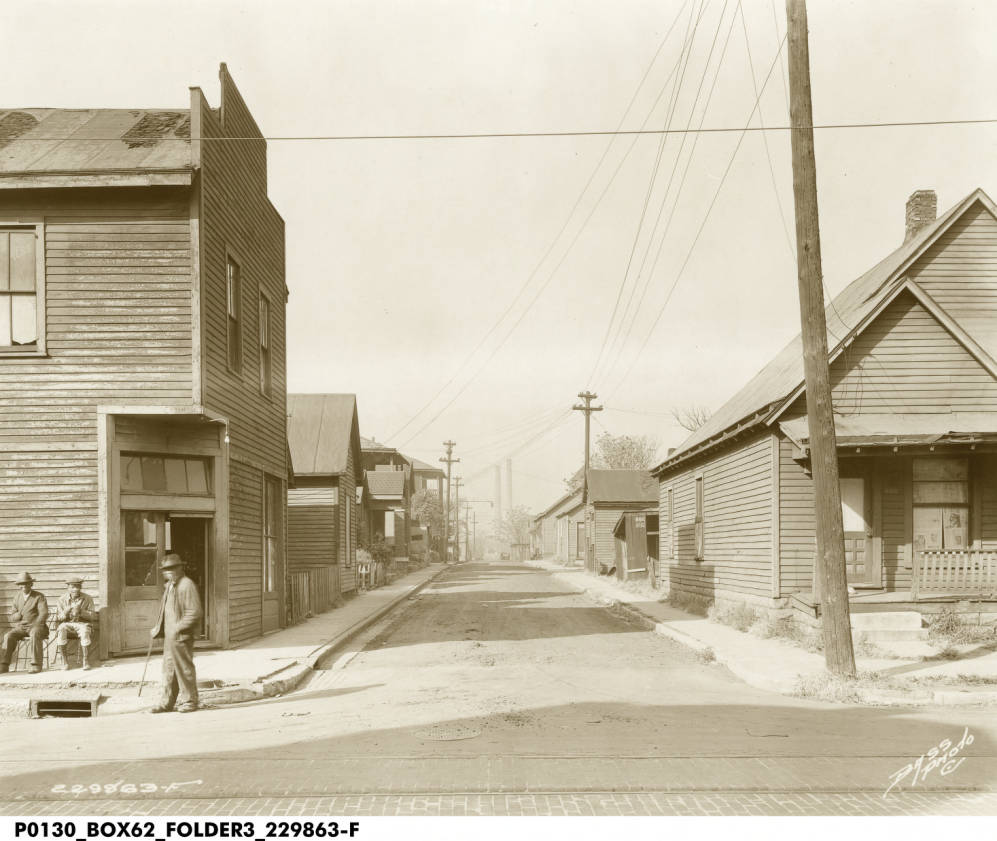 Changes in Indy’s Historic Black Neighborhoods
In the 1970s, 4,000 residents left this nearly all-black neighborhood. Why? An increasingly desegregated housing market and closure of one of the country’s first public housing projects.