Children change schools and districts most often at charter schools and schools where a large share of students come from low-income families.
Educators and community-based organizations know that changing schools frequently can have an impact on a child’s education. When a student moves from one school to another, this is called “school mobility”. Mobility can be split into two types: inter-district mobility (where a student joins a school from another district) and intra-district mobility (where a student joins a school from another school in the same district).
A summary of research on the effects of school mobility on educational outcomes (Reynolds, et al. 2009) found that “children who moved 3 or more times had rates of school dropout that were nearly one-third of a standard deviation higher than those who were school stable.” Reynolds’ Chicago Longitudinal Study “revealed that students who move frequently or beyond third grade experience the most detrimental effects.”
Understand the Indicator: Mobility Rate
Mobility rate is calculated by dividing total student transfers by the number of students who attended a school at any point in the year. There are benign causes of mobility, like families moving in an out of communities or making other school choices to suit their child. But some factors can put a student at a higher risk of changing schools frequently. For example, renters are more likely to move than homeowners, and new school choices can lead to a large number of transfers.
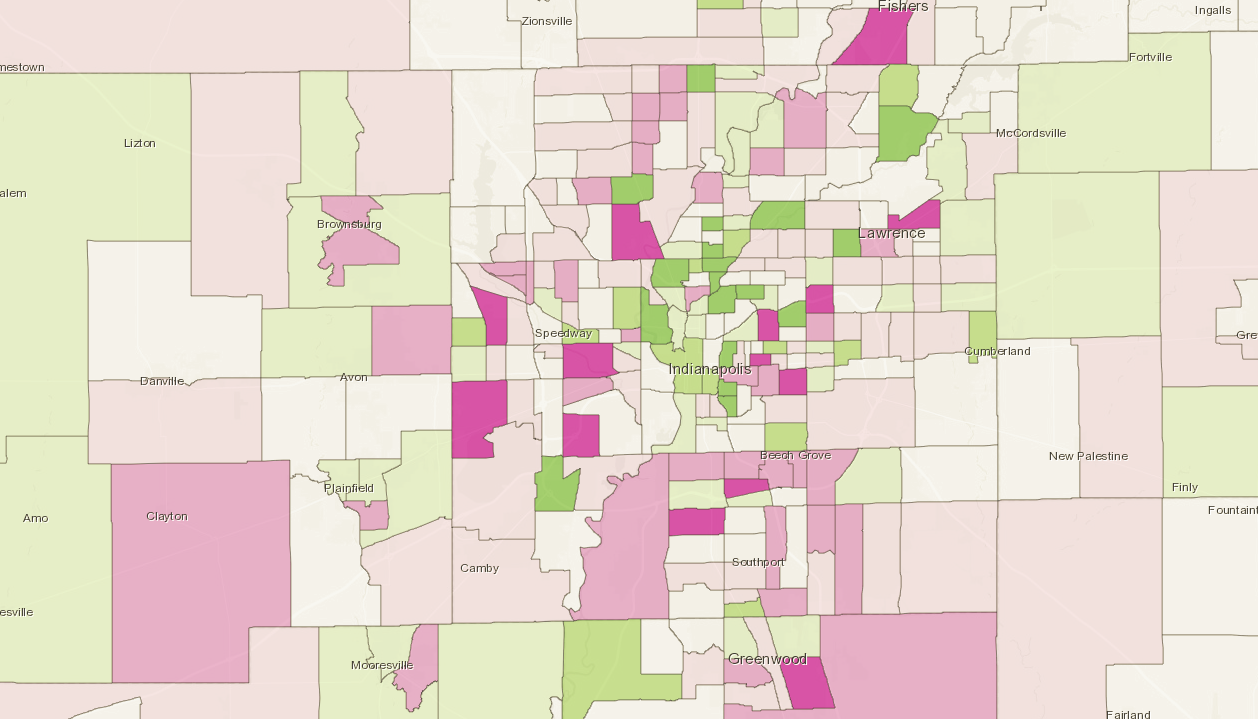
Transfer rates are highest in Indianapolis, Anderson and among charter schools
Charter Schools Driving High Inter-District Transfer Rate
Transferring between districts is about five times as common as transferring within the district. In Central Indiana during the 2017-18 school year, there were 74,754 students who transferred from another district and 15,528 students who changed schools within the same district. (These students can be double-counted because they are counted at each school they attend in a year.) The average school has an inter-district transfer rate of 11.2 percent compared to an intra-district rate of 3.1 percent.
Charter schools have very high inter-district transfer rates, which skews the regional average. While this is somewhat inflated because a charter school is usually a district unto itself, total mobility rates are still higher for charters than for any school corporations. Of the 15 schools with the highest inter-district rates, 14 are charter schools. Thirty schools have inter-district transfer rates over 25 percent, and 19 of them are charter schools.
Charter schools have been growing in recent years, and new charters are frequently created. But this growth does not explain all or even the majority of turnover at these schools. For example, Marion Academy saw 712 students in 2017-18 who came from other districts. While the school grew by 173, this only explains a quarter of the turnover at that school. Marion Academy had the highest out-of-district transfer rate in the region at 85.1 percent.
Collectively, charter schools in Marion County have a 41 percent out-of-district transfer rate. Hamilton County charters have a similarly high rate of 31 percent, and Madison County charters have a rate of 18 percent.
Indianapolis Public Schools and Anderson Community Schools have Highest Transfer Rates
Outside of charter schools, Indianapolis Public Schools and Anderson Community Schools have the highest transfer rates of any corporation. The total transfer rate for IPS was 29.8 percent in 2017-18. The rate was 20.1 percent for Anderson Community Schools.
In IPS, children transferred between districts 5,234 times and transferred from within the district 3,735 times. Compare that to the 30,130 students who attended an IPS school at some point during the year. Both inter-district and intra-district transfer rates are very high for IPS.
There were 7,586 students that attended an Anderson Community School at some point during the 2017-18 school year, and those children transferred a total of 1,500 times. The inter-district transfer rate was 13.1 percent and intra-district was 7.7 percent.
Income Has Large Influence on Transfer Rates
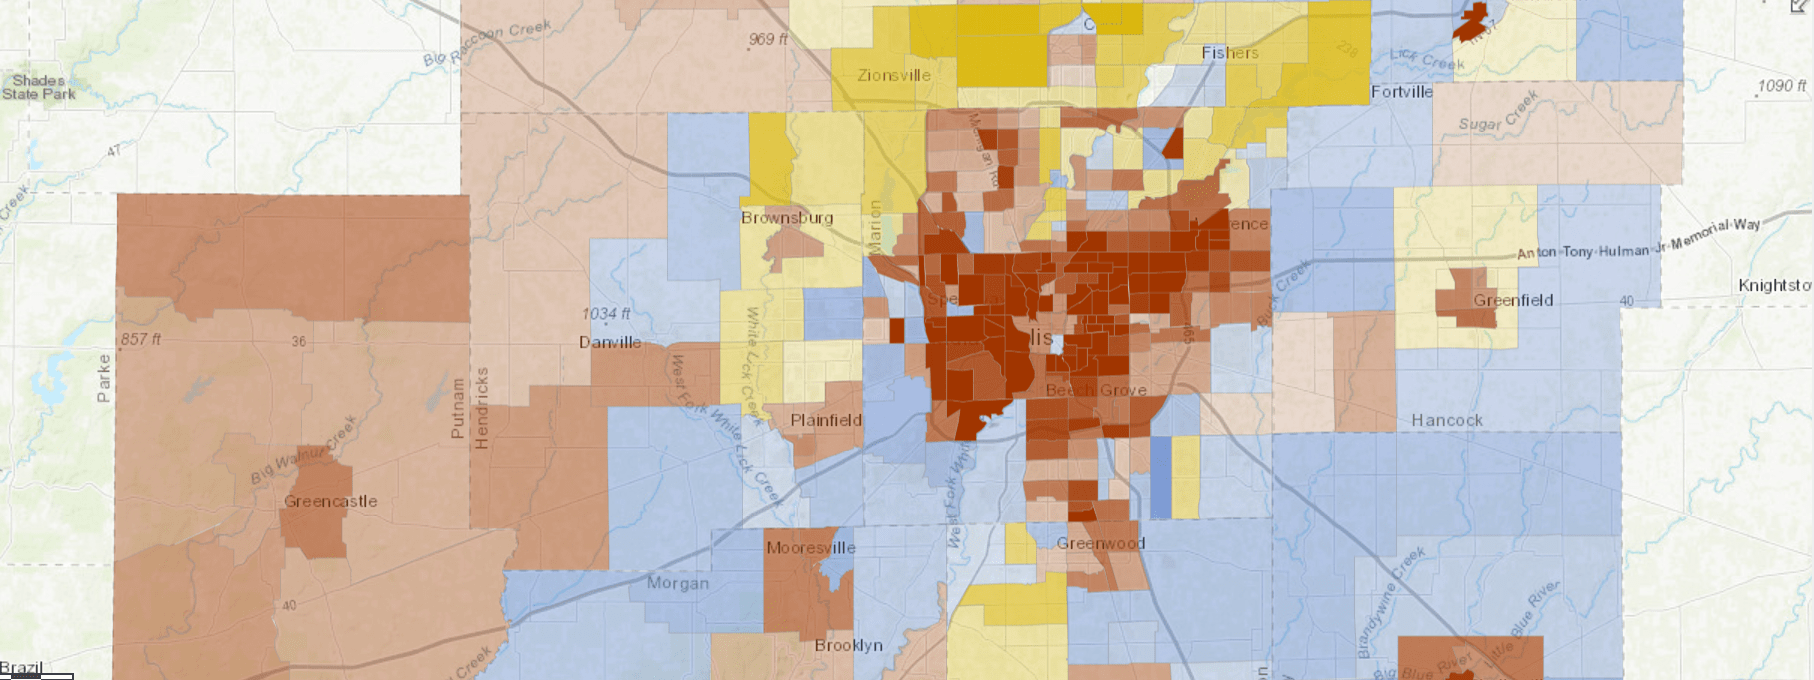
The high transfer rates for IPS and Anderson Community Schools are related to the large share of students from low-income families present in those districts. In fact, the percent of children eligible for free or reduced lunch at a school explains about two thirds of the variation in transfer rate. (Using logarithmic regression, the R-square value is 0.671.)
There are a few outliers to this pattern: 1) schools with high transfer rates and low shares of students eligible for free and reduced lunch and 2) schools with low transfer rates and high shares of students eligible for free and reduced lunch.
Charter schools tend to have high transfer rates, and those with a small share of children from low-income families tend to be outliers. Options Charter Schools in Carmel and Noblesville have transfer rates over 30 percent, but only around a quarter of their students qualify for free or reduced lunch. Hoosier Academy in Lawrence is similar. At both Ben Davis University High School and Warren Early Childhood Education Center, two-thirds of students are from low-income families, but the transfer rate is about 5 percent or less. At Christel House Academy South (near Garfield Park), 94.1 percent of students are from low-income families, but the transfer rate is less than 10 percent.
Next Up
 Indy’s Least Mixed-Income Neighborhoods
Explore neighborhoods where residents are highly concentrated into a few income groups. We dive into examples of concentrations of low-income residents, high-income residents, and middle-income residents.
 Income Inequality High Where Golden Hill and Northwest Indianapolis Converge
In the area where wealthy Golden Hills converges with the working-class neighborhoods of Northwest Indianapolis, income inequality is high and increasing. The area is also experiencing a growth of white households above the median income.
 Neighborhood Change Study in a Front Page IBJ Article
Matt Nowlin, Research Analyst, was interviewed for an article by Hayleigh Colombo in the Indianapolis Business Journal. This article showcases the change in neighborhoods like Martindale-Brightwood in Indianapolis since the […]
 Explore Changes in your Neighborhood with this SAVI App