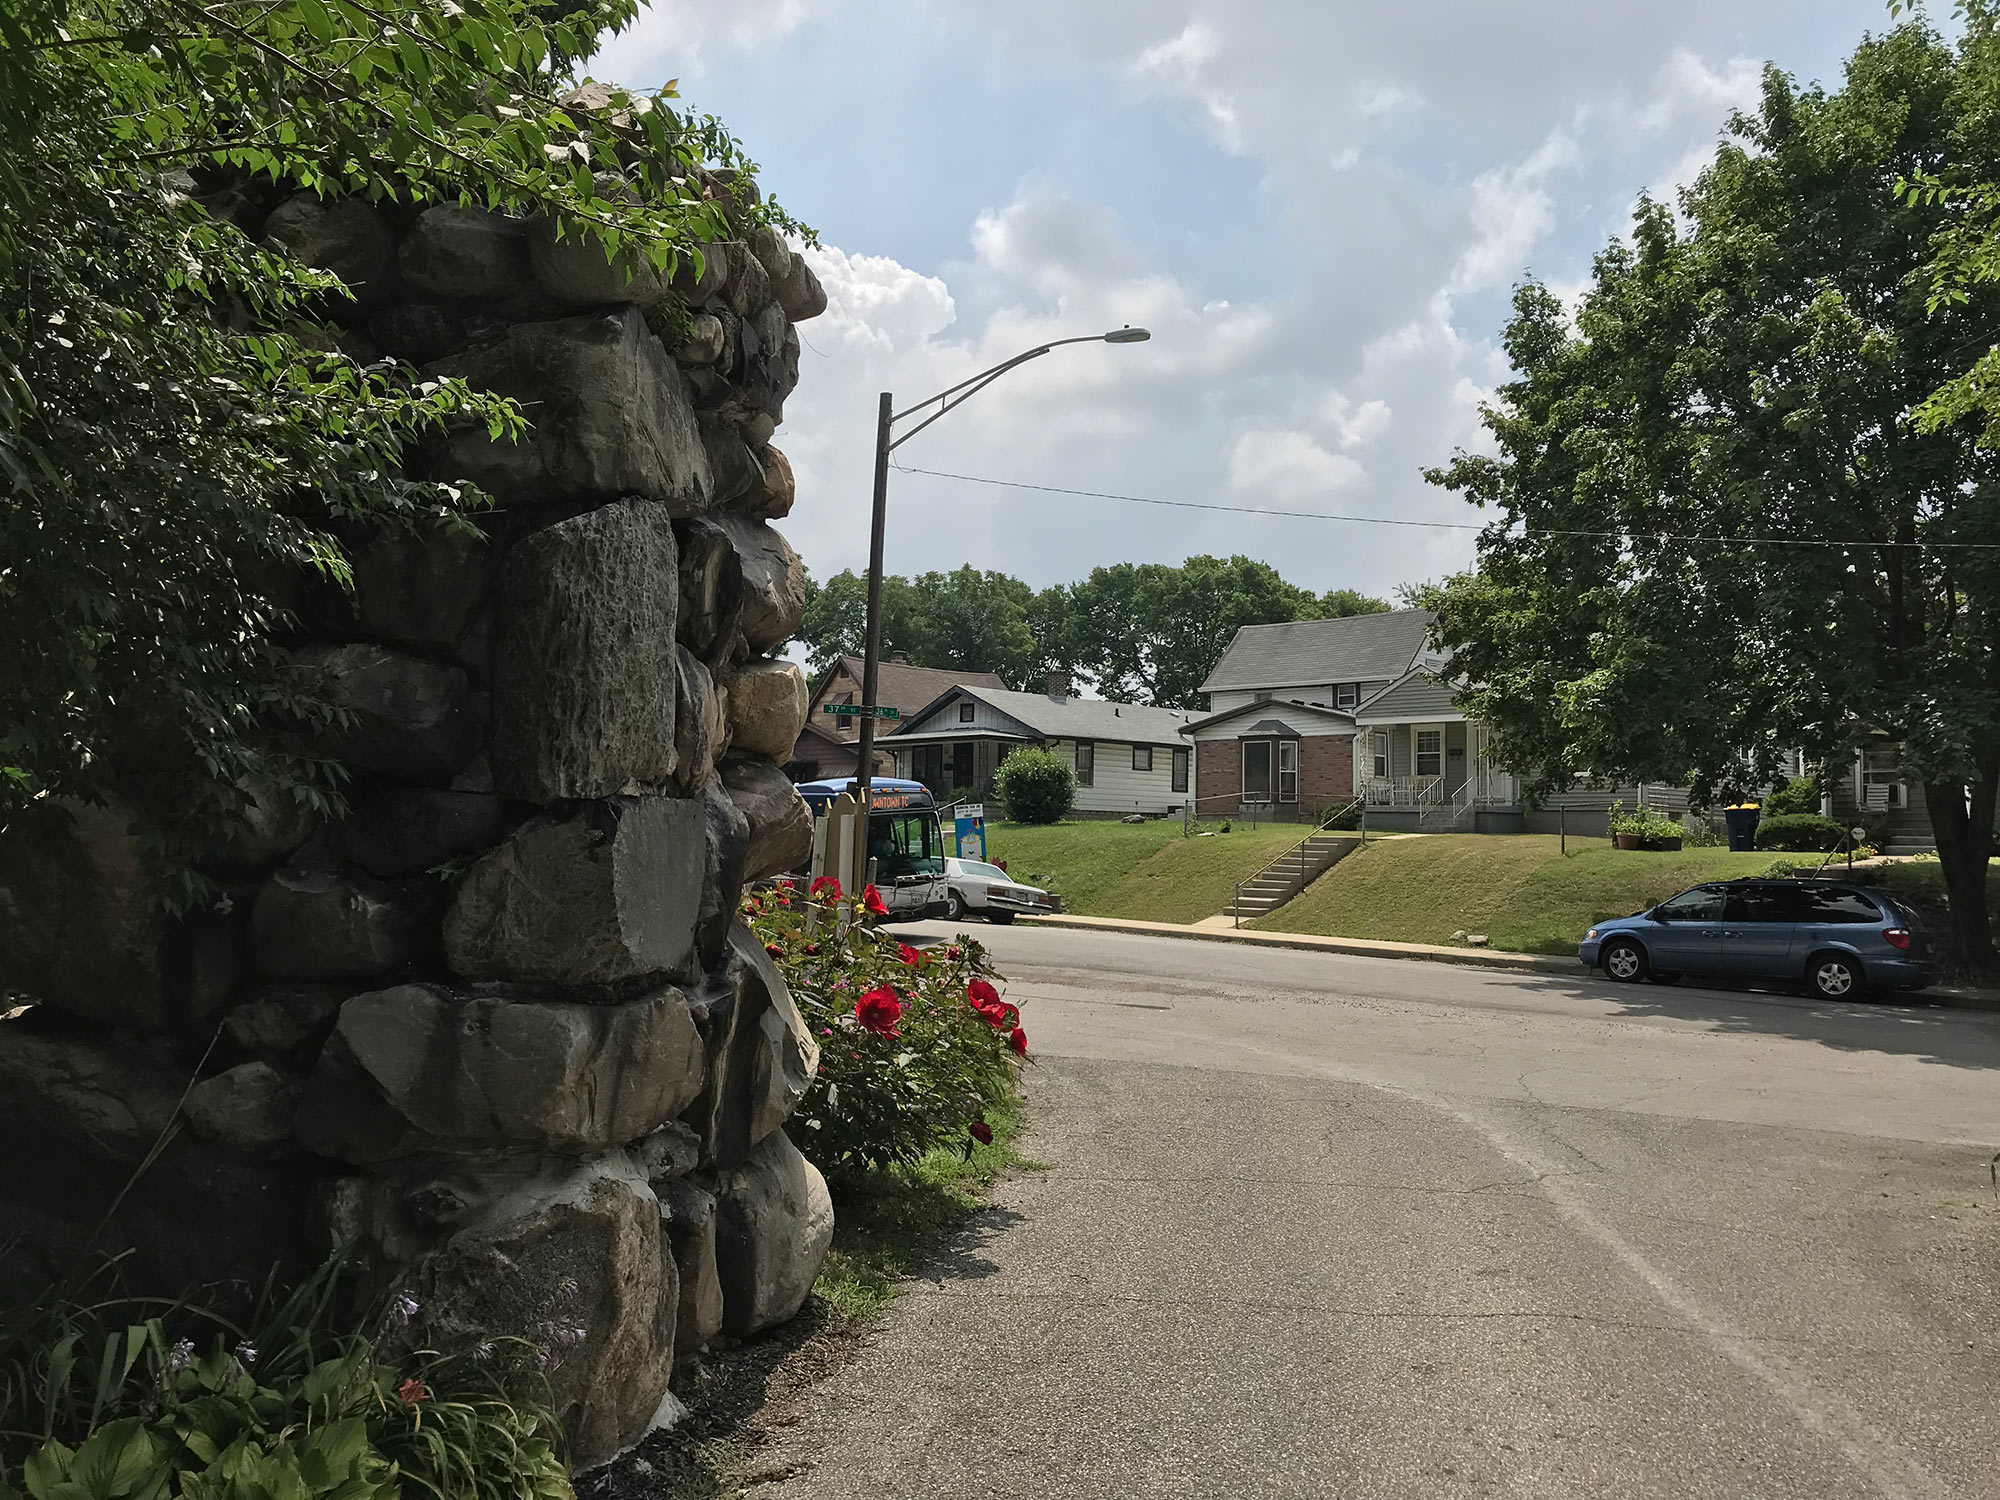
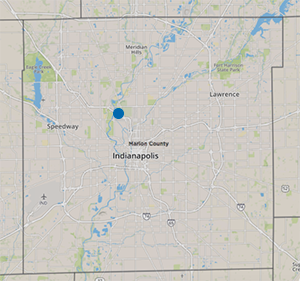
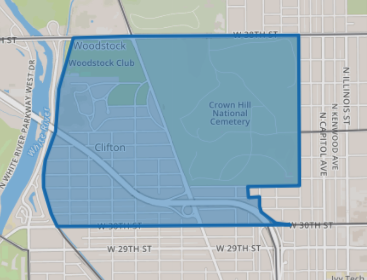
According to data from our latest report, Neighborhood Change 1970-2016, the neighborhood just west of Crown Hill Cemetery (census tract 3905.00) appears to be gentrifying. Located in the northern part of the United Northwest Area, this neighborhood has seen a relative increase in millennials and average family income. In 2010, this neighborhood had relatively few young adults. Three-quarters of the region’s neighborhoods had a higher share of people aged 20-34 than this neighborhood. By 2016, this area had a higher concentration of 20-to-34-year-olds than two-thirds of neighborhoods. The average family income grew from $61,000 to $78,000 (from below the median neighborhood to above).
Income inequality is also increasing in this neighborhood. The GINI Index of Income Inequality has risen from 0.58 to 0.66. The GINI Index is a common measure of Income Inequality. In this index, a score of 0.0 would mean perfect equality—every household earns the same amount. A score of 1.0 means perfect inequality—one household earns all the income, no one else earns any. In Marion County, the GINI Index was 0.48 in 2016.
The share of very poor and very rich residents is increasing.
Share of population by household income, 2010 and 2016.
Income Inequality is higher than Marion County and rising.
Gini Index of Income Inequality in Tract 3905.00 and Marion County, 2010-2016.
[/et_pb_text][/et_pb_column][/et_pb_row][et_pb_row _builder_version="4.16" global_colors_info="{}" column_structure="1_3,2_3"][et_pb_column type="1_3" _builder_version="4.16" custom_padding="|||" global_colors_info="{}" custom_padding__hover="|||"][et_pb_image src="https://www.savi.org/wp-content/uploads/2018/07/Parry-Manufacturing.png" align_tablet="center" align_last_edited="on|desktop" _builder_version="4.16" global_colors_info="{}" align_phone="center"][/et_pb_image][et_pb_text _builder_version="4.16" custom_margin="||10px|" global_colors_info="{}"] Parry Manufacturing Company in 1911. This Indianapolis factory produced carriages and buggies.[/et_pb_text][et_pb_text _builder_version="4.16" custom_margin="0px|||" custom_padding="0px|||" global_colors_info="{}"] Bass Photo Co Collection, Indiana Historical Society. View Source[/et_pb_text][/et_pb_column][et_pb_column type="2_3" _builder_version="4.16" custom_padding="|||" global_colors_info="{}" custom_padding__hover="|||"][et_pb_text _builder_version="4.16" global_colors_info="{}"]
A History of Two Unequal Neighborhoods
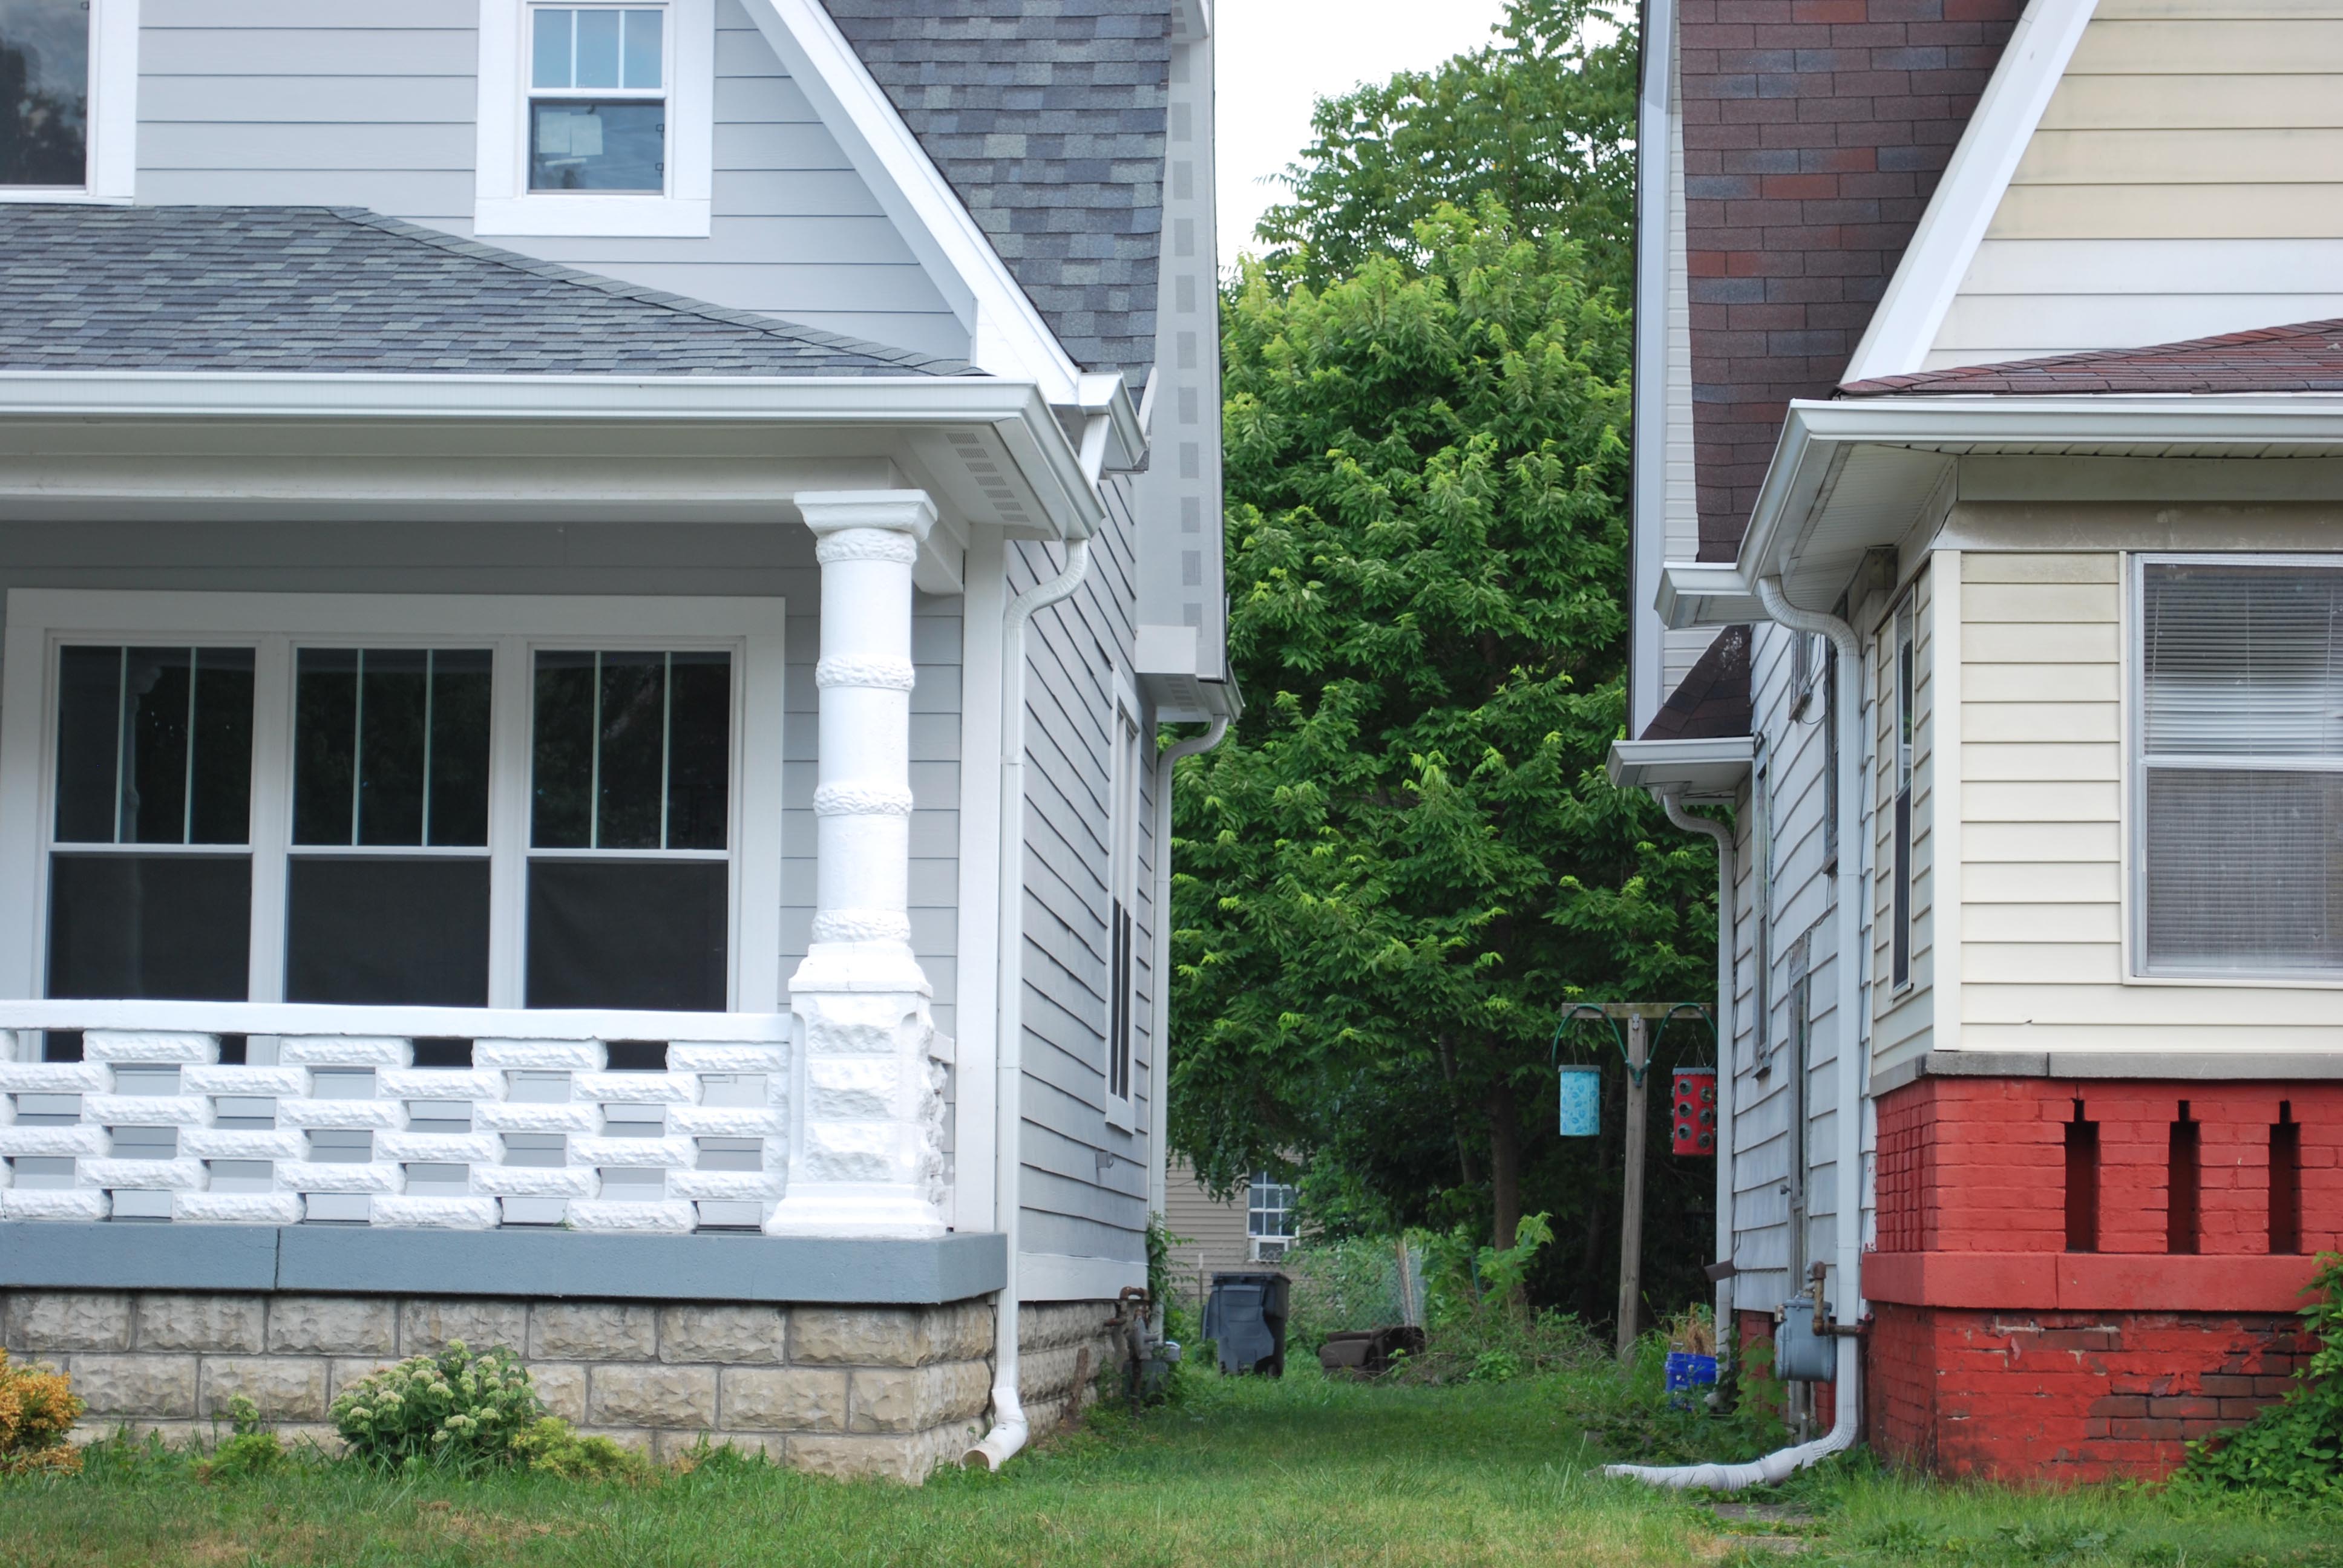
The history of the neighborhood might contribute to its income inequality. This census tract is home to many low-income households, but also to the wealthy Golden Hill neighborhood. It is located where working-class neighborhoods like Northwest Indianapolis and Crown Hill converge with high-income neighborhoods near 38th Street, such as Woodstock and Shooters Hill. Golden Hill was originally developed as the estate of David Parry, president of Parry Manufacturing Company, a maker of carriages. Platted as several properties in 1872, Parry acquired them all between 1900 and 1907 and hired Scottish landscape architect George MacDougall to design the grounds. After Parry’s death in 1915, “his family subdivided the estate and hired MacDougall to plan the neighborhood,” according to Sheryl Vanderstel in the Encyclopedia of Indianapolis. Historically, several prominent families lived in Golden Hill, including the Parrys, George H.A. Clowes, William B. Stokely, and William A. Atkins. In 1991, Golden Hill was added to the National Register of Historic Places.[/et_pb_text][/et_pb_column][/et_pb_row][et_pb_row _builder_version="4.16" global_colors_info="{}"][et_pb_column type="4_4" _builder_version="4.16" custom_padding="|||" global_colors_info="{}" custom_padding__hover="|||"][et_pb_image src="https://www.savi.org/wp-content/uploads/2018/07/Frawley-Estate.png" align_tablet="center" align_last_edited="on|desktop" _builder_version="4.16" global_colors_info="{}" align_phone="center"][/et_pb_image][et_pb_text _builder_version="4.16" global_colors_info="{}"] The Frawley Estate in Golden Hill, circa 1922.[/et_pb_text][et_pb_divider color="#dddddd" _builder_version="4.16" custom_margin="0px||0px|" custom_padding="0px||0px|" global_colors_info="{}"][/et_pb_divider][et_pb_text _builder_version="4.16" custom_margin="0px|||" custom_padding="0px|||" global_colors_info="{}"] Bretzman Collection, Indiana Historical Society. View Source[/et_pb_text][/et_pb_column][/et_pb_row][et_pb_row _builder_version="4.16" global_colors_info="{}" column_structure="1_3,2_3"][et_pb_column type="1_3" _builder_version="4.16" custom_padding="|||" global_colors_info="{}" custom_padding__hover="|||"][et_pb_text _builder_version="4.16" global_colors_info="{}"]Whites account for small share of population, but large share of aggregate income.
Population and aggregate income by race, 2016.
[/et_pb_text][et_pb_code _builder_version="4.16" global_colors_info="{}"][/et_pb_code][/et_pb_column][et_pb_column type="2_3" _builder_version="4.16" custom_padding="|||" global_colors_info="{}" custom_padding__hover="|||"][et_pb_text _builder_version="4.16" global_colors_info="{}"]Racial Disparities in Neighborhood Economic Indicators
Census data is not available with enough granularity to explain how the demographics of Golden Hill vary from the rest of the neighborhood. The Census Bureau does estimate that income varies widely by race in this tract. Median income among white households was $71,000 in 2015 (the latest year available for that statistic), while for black households it was $24,714. (For households, the Census Bureau determines race based on the race of the householder.) Even though only 14 percent of the neighborhood is white, white householders account for over half the income earned in the neighborhood. Since 2010, there has been a decline in black households overall, especially among those earning less than $60,000. (The metro area’s median income is $54,261.) However, there has been a growth of white households earning at least $60,000. This could have lead to increased income disparity between black and white households when compared to 2010.[/et_pb_text][et_pb_text _builder_version="4.16" global_colors_info="{}"]Number of white households above median income is increasing.
Change in number of households by household income and race of householder between 2010 and 2016.
[/et_pb_text][et_pb_code _builder_version="4.16" global_colors_info="{}"][/et_pb_code][et_pb_text _builder_version="4.16" global_colors_info="{}"]The neighborhood currently has a growing population of young adults and college-educated adults. The white population has only grown slightly, from 9 percent white to 14 percent white between 2010 and 2016. That amounts to a net increase of about 100 new white residents. However, that small shift has had an outsize effect on the young adult and college-educated share of the population. For example, compared to 2010, there are 100 less black residents aged 20-34 and 100 more white residents of that age. The neighborhood has lost a few college-educated black residents since 2010, but gained an estimated 49 college-educated white residents.Young, college-educated, high-income white residents increasing.
Change in number of households earning $60K or more, residents between 20-34 years old, and residents age 25 and older with a bachelors degree, by race.
[/et_pb_text][et_pb_code _builder_version="4.16" global_colors_info="{}"][/et_pb_code][et_pb_text _builder_version="4.24.0" hover_enabled="0" global_colors_info="{}" sticky_enabled="0"]A Microcosm of the City
The Polis Center’s Project on Religion and Urban Culture calls the United Northwest Area a “microcosm of the city,” and in some ways that is true even of this small census tract. This census tract happens to have been drawn to include a very wealthy neighborhood and a low-income neighborhood, and this highlights the disparities that exist in Indianapolis overall. Of course, income inequality is sometimes an odd measure at the neighborhood scale. If the boundaries had been drawn differently, by grouping low-income neighborhoods together and high-income neighborhoods together, this would reduce local measures of income inequality. Therefore, income inequality at the neighborhood level is better at describing local conditions than at describing structural issues in our regional economy.
By including wealth and poverty in such close proximity, however, this area does exaggerate and accentuate the disparities in foundational economic indicators like income and education that exist in our city. This area also is a microcosm of the racial disparities that exist in Indianapolis, where for every $1.00 the median black household earns, the median white household earns $1.67 (ACS 2016 5-Year Average via SAVI).
The changes in this neighborhood may further increase those disparities, as all the net gain in higher-income households, college-educated population, and millenials has been among white residents and households.
[/et_pb_text][/et_pb_column][/et_pb_row][/et_pb_section][et_pb_section fb_built="1" _builder_version="4.16" global_colors_info="{}"][et_pb_row use_custom_gutter="on" gutter_width="1" module_class=" et_pb_row_fullwidth" _builder_version="4.16" width="100%" width_tablet="100%" width_last_edited="on|desktop" max_width="100%" max_width_tablet="100%" max_width_last_edited="on|desktop" make_fullwidth="on" global_colors_info="{}" width_phone="100%" max_width_phone="100%"][et_pb_column type="4_4" _builder_version="4.16" custom_padding="|||" global_colors_info="{}" custom_padding__hover="|||"][et_pb_gallery gallery_ids="6632,6633,6634,6609,6630,6636,6631,6629,6628,6627" gallery_captions=",,,Bass Photo Company: Indiana Historical Society,Commercial nodes along Clifton Street served Northwest Indianapolis.,Commercial nodes along Clifton Street served Northwest Indianapolis.,,,," posts_number="8" show_title_and_caption="off" show_pagination="off" _builder_version="4.16" custom_margin="|||" custom_padding="|||" global_colors_info="{}"][/et_pb_gallery][/et_pb_column][/et_pb_row][/et_pb_section][et_pb_section fb_built="1" _builder_version="4.16" background_blend="soft-light" custom_padding="3px|0px|0px|0px" saved_tabs="all" global_colors_info="{}"][et_pb_row _builder_version="4.16" custom_padding="25.59375px|0px|0px|0px" global_colors_info="{}" column_structure="1_3,2_3"][et_pb_column type="1_3" _builder_version="4.16" custom_padding="|||" global_colors_info="{}" custom_padding__hover="|||"][et_pb_cta title="See How Your Neighborhood Has Changed" button_url="https://www.savi.org/savi-talks/neighborhood-change/app/" button_text="Explore the Map" _builder_version="4.16" background_color="#00bce4" custom_button="on" button_text_color="#ffffff" global_colors_info="{}" button_text_size__hover_enabled="off" button_one_text_size__hover_enabled="off" button_two_text_size__hover_enabled="off" button_text_color__hover_enabled="off" button_one_text_color__hover_enabled="off" button_two_text_color__hover_enabled="off" button_border_width__hover_enabled="off" button_one_border_width__hover_enabled="off" button_two_border_width__hover_enabled="off" button_border_color__hover_enabled="off" button_one_border_color__hover_enabled="off" button_two_border_color__hover_enabled="off" button_border_radius__hover_enabled="off" button_one_border_radius__hover_enabled="off" button_two_border_radius__hover_enabled="off" button_letter_spacing__hover_enabled="off" button_one_letter_spacing__hover_enabled="off" button_two_letter_spacing__hover_enabled="off" button_bg_color__hover_enabled="off" button_one_bg_color__hover_enabled="off" button_two_bg_color__hover_enabled="off"][/et_pb_cta][/et_pb_column][et_pb_column type="2_3" _builder_version="4.16" custom_padding="|||" global_colors_info="{}" custom_padding__hover="|||"][et_pb_text _builder_version="4.16" global_colors_info="{}"]Find more interactive content from our series on neighborhood change.
[/et_pb_text][et_pb_text _builder_version="4.16" global_colors_info="{}"]Explore the Neighborhood Change Project
[/et_pb_text][et_pb_dpblog_portfolio posts_number="10" order="ASC" include_tags="neighborhood-change" show_categories="off" show_date="on" show_excerpt="on" excerpt_limit="280" show_pagination="off" fullwidth="list" _builder_version="4.16" title_font_size="16" global_colors_info="{}"]<div class=”et_pb_portfolio_list et_pb_module et_pb_bg_layout_light et_pb_dpblog_portfolio_1″> <div id=”post-5951″ class=”et_pb_portfolio_item dp_portfolio_list_item post-5951 type-post status-publish format-standard has-post-thumbnail hentry category-demographics category-equity tag-equity tag-maps tag-neighborhood-change tag-race”> <div class=”dp_portfolio_item_left”><a href=”https://www.savi.org/2018/05/07/mapping-race/” target=””> <span class=”et_portfolio_image”> <img src=”https://www.savi.org/wp-content/uploads/2017/10/Race-Animation-compressor-400×284.gif” alt=”Story Map: Race and Migration Since 1970″ width=”400″ height=”284″ /> </span> </a></div> <div class=”dp_portfolio_item_right”> <h2><a href=”https://www.savi.org/2018/05/07/mapping-race/” target=””>Story Map: Race and Migration Since 1970</a></h2> <p class=”post-meta”><a href=”https://www.savi.org/category/demographics/” rel=”tag”>Demographics</a>, <a href=”https://www.savi.org/category/equity/” rel=”tag”>Equity</a></p> </div> </div> <!– .et_pb_portfolio_item –> </div> <!– .et_pb_portfolio –> <div class=”pagination clearfix”> <div class=”alignleft”></div> <div class=”alignright”></div> </div>[/et_pb_dpblog_portfolio][/et_pb_column][/et_pb_row][/et_pb_section]Next Up
 After Public Investment, St. Clair Place’s Housing Market Significantly Stronger
Mortgage activity in St. Clair Place shows a dramatic increase in home purchases and home value since 2007. The area is more diverse than ever and poverty is falling for people of color. But home buyers are still 76 percent white.
 Explore Changes in your Neighborhood with this SAVI App
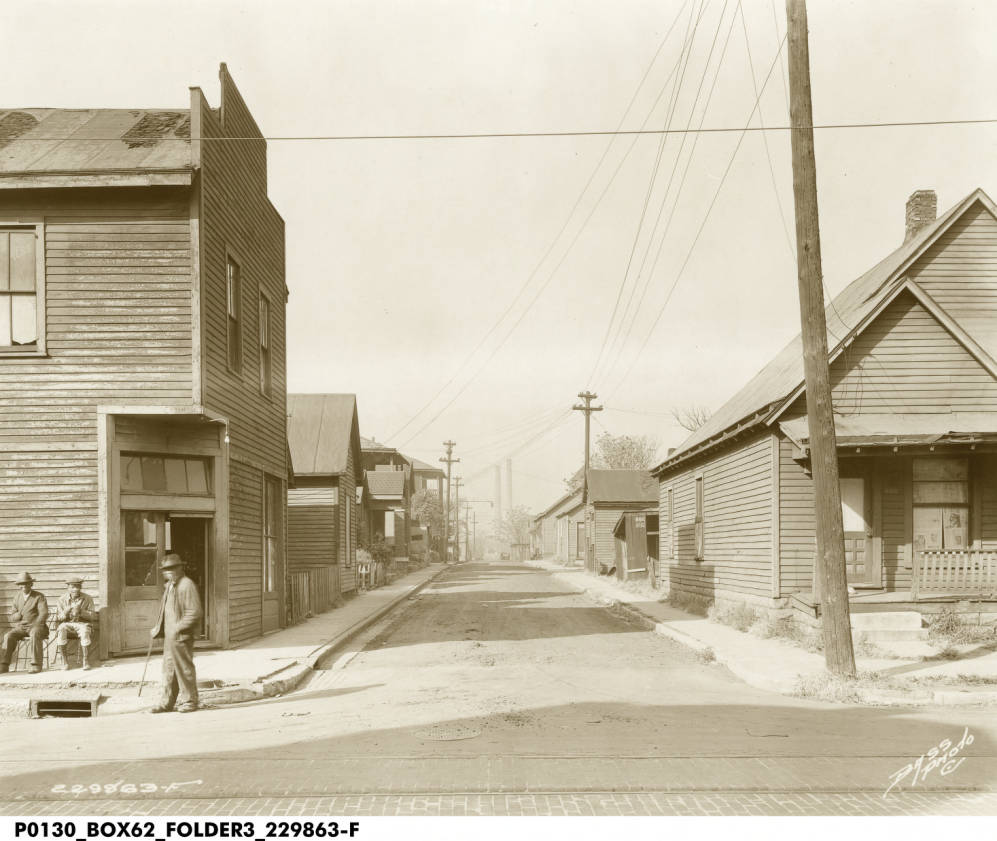 Changes in Indy’s Historic Black Neighborhoods
In the 1970s, 4,000 residents left this nearly all-black neighborhood. Why? An increasingly desegregated housing market and closure of one of the country’s first public housing projects.
 Story Map: Race and Migration Since 1970
In 1970, half of the region’s Black population lived in 12 square miles north of downtown Indianapolis. As Black residents moved into ’60s suburban communities, 120,000 White residents left the city’s core for newer suburbs.