Academic Standardized Test Scores for the Hearing Aid Assistance Program of Indiana (HAAPI) Participants and Applicants

This research was funded and produced in partnership with Hear Indiana, whose mission is to create equal opportunities for children with hearing loss through Listening & Spoken Language services.
Summary
Hear Indiana is partnering with the Polis Center to investigate educational outcomes for deaf or hard of hearing (DHH) children in Indiana who use hearing aids and communicate through spoken language. Data was requested through the Indiana Management Performance Hub (MPH) from multiple state agencies to identify this population and link to education data. Due to challenges linking records between sources, the Hearing Aid Assistance Program of Indiana (HAAPI) application data provided the best identification of this population. Furthermore, we initially set out to assess educational outcomes for this population at multiple levels including graduation rates, school attendance, and higher education enrollment. Again, data challenges narrowed our analysis to just two educational outcomes: scores from ISTEP and IREAD standardized tests.
As a result, this report summarizes our findings related to academic standardized test scores (IREAD, ISTEP) for DHH children who use hearing aids and communicate through spoken language as identified by HAAPI applicant data between 2014 and 2021. We find that these children have test scores comparable to or exceeding statewide averages in Math and English Language Arts (ELA). The findings provide evidence that DHH children who use hearing aids and communicate through spoken language can excel academically.
In addition to these key findings, we also provide a detailed summary of the data sources used and recommendations for how to both reproduce and expand upon this analysis in the future. Those recommendations are listed at the end of the report.
Key Questions
- How do academic standardized test scores (IREAD, ISTEP) for DHH children who use hearing aids and communicate through spoken language as identified by HAAPI applicant data compare to the general student population in Indiana?
- What data sources are available on DHH children in Indiana and how do they connect with educational outcome data?

Definition of Terms
Deaf or Hard of Hearing (DHH) Population
Deaf or Hard of Hearing is the umbrella term for anyone who is deaf or has less auditory access. In this report, we use “DHH” as an abbreviation when referencing this population. However, the children this report is focused on—DHH children who use hearing aids and communicate through spoken language as identified by HAAPI applicant data—are a subgroup of the total Indiana DHH population. As a result, any findings in this report should not be considered applicable to the entire DHH population, only the specific subgroup studied herein.
In the demographics section, we compare DHH children who use hearing aids and communicate through spoken language as identified by HAAPI applicant data to demographics of the DHH population at large. Once again, this is not to suggest that findings in the academic section are applicable to the overall DHH population but is simply offered as a point of comparison to better understand our dataset.
Our primary data source for demographics on the DHH population is the Census Bureau’s American Community Survey (ACS). The ACS asks respondents if they are “deaf or have serious difficulty hearing.” While worded slightly differently from “deaf or hard of hearing,” we use this question from the ACS to estimate figures on the DHH population in Indiana.
The ACS is not the only major source for data on the DHH population. Other sources such as the Census Survey of Income and Program and Participation (SIPP) find similar estimates to the ACS on the size of the DHH population in the U.S. Some CDC studies find varying estimates of hearing loss in children. Despite differences in estimates between sources, the frequency, sample size, and specificity of questions in the ACS gives us confidence in their veracity. Furthermore, SIPP and most sources cited by the CDC find a similar magnitude that less than one percent of children are deaf or hard of hearing.
Hearing Aid Assistance Program of Indiana (HAAPI)
HAAPI is a program funded by Indiana Department of Health’s Center for Deaf and Hard of Hearing Education. It is administered by Hear Indiana and provides reduced-cost hearing aids for approximately 300 children a year from age 3 through high school graduation. We use HAAPI data throughout this report to identify children who use hearing aids and communicate through spoken language, as specified by their parents on program applications. Specifically, the HAAPI dataset we received lists applicants to the program between 2014 and 2021. Applicants have a “mode of communication” listed along with their ID number. It should be noted that around 1 percent of applicants were listed more than once with different modes of communication listed each time. Or “Spoken Language” was listed in combination with other modes of communication.
For the purposes of this report, any HAAPI applicant listed as using spoken language alone or in combination with other modes of communication at any point in the HAAPI dataset was considered a child who uses hearing aids and communicates through spoken language. This totals 1,241 unique people and is the group on which analysis is performed in this report and are referred to as “HAAPI Applicants” throughout.
Spoken Language Mode of Communication
This report focuses on DHH children who use hearing aids and communicate through spoken language as identified by HAAPI applicant data. “Spoken Language Communication” means the student communicates using their home language through listening and spoken language amplification devices and speaking orally.
Data Findings
Academic Standardized Test Scores for DHH Children Who Use Hearing Aids and Communicate Through Spoken Language as Identified by HAAPI Applicant Data
The primary goal of this report is to compare educational outcomes for DHH children who use hearing aids and communicate through spoken language as identified by HAAPI applicant data to the general student population. To assess educational outcomes, we integrated HAAPI program applicant data with ISTEP and IREAD data from the Indiana Department of Education and compared scores from group of interest to statewide averages. Throughout this section, “HAAPI Applicants” is used as shorthand for “DHH children who use hearing aids and communicate through spoken language as identified by HAAPI applicant data” although they represent a subset of all HAAPI applicants.
ISTEP
ISTEP (Indiana Statewide Testing for Educational Progress) was the statewide academic standardized test administered to all Indiana students grades 3-8 and high school sophomores between 1987 and 2018. The test was split into different subjects for different grade levels, but all students look an ELA (English Language Arts) and Math assessment each time the test was administered. While these tests are not the only metrics to consider when assessing academic performance, the consistency with which the test was administered allows a direct comparison between various subgroups.
We examine performance by grade. To have subgroups that are large enough to be reliable and avoid any privacy concerns, we combine results from multiple school years. Data is aggregated at the grade level for grades 3-8 between 2011 and 2018. For grade 10, data is from years 2016-2019. All years were not available for all grades due to data constraints. Statewide results represent a simple average of school years across the timespan.
ISTEP – Math
When combining scores from all grades and all years in our dataset, 68 percent of students statewide passed the ISTEP Math exam compared with 65 percent of HAAPI applicants.
ISTEP - English Language Arts (ELA)
IREAD
IREAD (Indiana Reading Evaluation and Determination) is Indiana’s current statewide academic standardized reading test administered to all students in grade three. According to the Department of Education, the intent of the test is “to ensure each student receives the appropriate reading remediation based on IREAD-3 test data and their individual learning needs.”
Our dataset aggregates scores by year for HAAPI applicants for each year between 2012 and 2016. Statewide comparison data is only available for the year 2016. We have applied the 2016 statewide pass rate as a baseline comparison for each year in our dataset.
Academic Standardized Test Performance Summary
Test scores are better for HAAPI applicants than the statewide average in English Language Arts, and slightly lower in Math and 3rd grade Reading. Averaging all available years, ISTEP pass rates were 70 percent for both the general population and HAAPI applicants.
Demographics of DHH Children Who Use Hearing Aids and Communicate Through Spoken Language as Identified by HAAPI Applicant Data
While not the primary aim of this report, this section shows key demographics of DHH children who use hearing aids and communicate through spoken language as identified by HAAPI applicant data. As with the section above, “HAAPI applicants” is used as shorthand throughout to identify this group. Additionally, we compare demographics of this group to data on the total deaf or hard of hearing youth population in Indiana from the Census Bureau’s American Community Survey (ACS). Again, this is not to suggest that our findings on test scores are applicable to all DHH children in Indiana but only to better understand our dataset.
Total Deaf or Hard of Hearing Youth Population in Indiana
The American Community Survey asks respondents if they are “deaf or have serious difficulty hearing”. Of all Hoosiers under 18 years of age, 0.6 percent fall in this category, which includes about 9,000 children.
Race & Ethnicity
According to the ACS, 70 percent of children who are deaf or have a serious difficulty hearing are White, 15 percent are Hispanic, 8 percent are Black, 5 percent are Multiracial, and 1 percent are Asian.
The racial breakdown from ACS shows a higher percentage of Hispanic and Black children are deaf or have a hearing difficulty than the HAAPI applicant data. Seventy-nine percent of children in the HAAPI applicant data are White, 7 percent are Hispanic, and 4 percent are Black.
Second, the HAAPI applicant data is not fully representative of the deaf or hard of hearing population. HAAPI is one way for Indiana DHH children to obtain hearing aids, but their families may also receive them through their insurers. Medicaid, for example, provides hearing aids to DHH children potentially excluding some low-income Hoosiers from our HAAPI dataset. Because Black and Hispanic Hoosiers are more likely to use Medicaid compared to their share of the total population, this could make our dataset more White than the deaf or hard of hearing population at large. (People who identify as Black or Hispanic make up 17 percent of Indiana’s population but 29 percent of Indiana Medicaid participants.) Also, some deaf and hard of hearing children receive cochlear implants rather than hearing aids—these children are not represented in this dataset.
Additionally, modes of communication vary widely among the deaf or hard of hearing population. For example, hearing aid users can also use ASL (American Sign Language) alone or in combination with spoken language. There are many other combinations of communication modes available as well. Our analysis is restricted to only hearing aid users that were recorded as using spoken language as their mode of communication in HAAPI applicant data. Our recommendations at the end of this document suggest including these other populations in future analyses.
Finally, race and ethnicity data were initially only available for 82 percent of records in the HAAPI applicant dataset we were provided. Through combining unique records in the HAAPI data with records in FSSA (Indiana Family & Social Services Administration) and records in IDOE (Indiana Department of Education) K-12 Attendance datasets, we were able to identify a race or ethnicity for 97 percent of unique HAAPI applicants. It’s possible that applicants missing this data have slightly skewed the overall numbers.
Gender

Data Overview, Process, & Recommendations
In addition to understanding educational outcomes for DHH children who use hearing aids and communicate through spoken language as identified by HAAPI applicant data, we also sought to provide an overview of the data available about this population. This section describes the process we followed to complete the analysis and gives recommendations for ways to improve and expand upon it moving forward.
Data Overview
The Polis Center worked with the Indiana Management Performance Hub (MPH) to complete the analysis in this report. MPH is Indiana’s data clearinghouse, storing and distributing data from sources across state government. Our initial data request included the following sources, each detailed in the subsections below.
- Indiana Department of Health (IDOH)
- Indiana Family and Social Services Administration (FSSA)
- Indiana Department of Education (IDOE)
Indiana Department of Health (IDOH)
We requested two datasets from IDOH: the Early Hearing Detection and Intervention (EHDI) screening and the Hearing Aid Assistance Program of Indiana (HAAPI).
EHDI
Early Hearing Detection and Intervention (EHDI) screening program provides universal newborn hearing screenings for infants in Indiana. This dataset provided us with 107,213 rows of screening data for years 2008-2013 and 2016-2020.
What’s Included:
- Demographic information like race/ethnicity, mother’s education level, and location
- Age when screening occurred and results of the screening
HAAPI
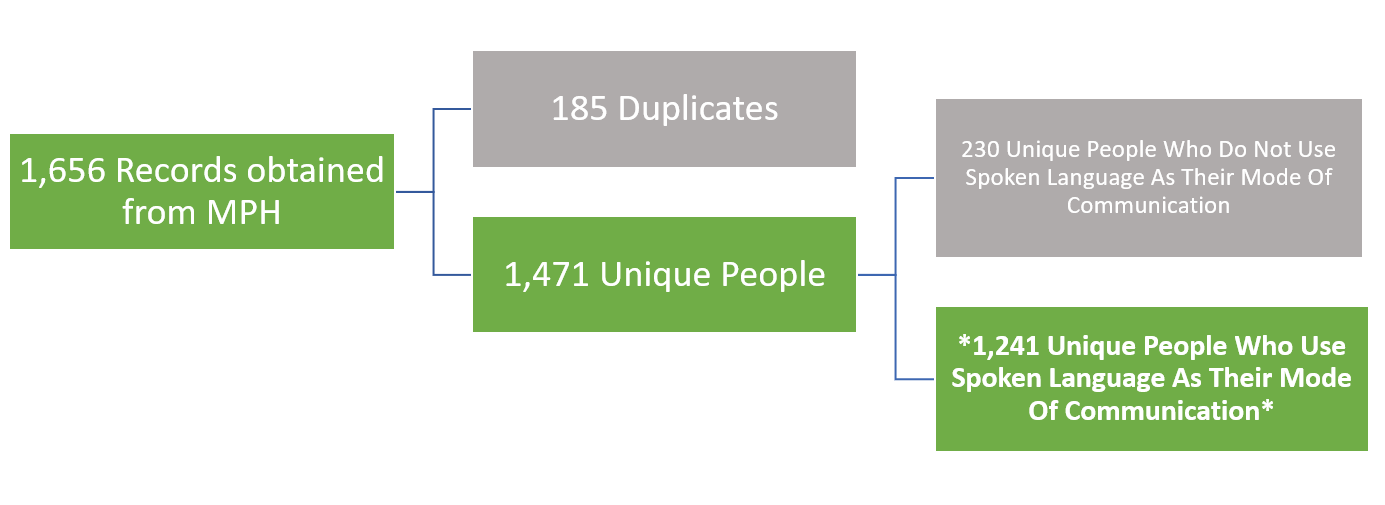
The Hearing Aid Assistance Program of Indiana provides hearing aids to children with hearing loss between ages 3 and graduating high school. This dataset provided us with 1,656 rows of program applicant data for years 2014-2021. Some rows were duplicates and once they were removed, 1,471 unique people remained. Of those 1,471 unique people, 1,241 were identified using spoken language as their mode of communication alone or in combination with other modes of communication. Analysis in this report was performed on those 1,241 unique people
What’s Included:
- Demographic information like gender and race/ethnicity
- When the patient got a hearing aid and its status
- Hearing levels reported by the program applicant

Indiana Family and Social Services Administration (FSSA)
We requested one dataset from FSSA on any hearing and ear-related claims.
FSSA Hearing and Ear-Related Claims
As the administrator of Indiana’s Medicaid program, FSSA receives claims from patients on a wide range of medical services—hearing issues included. This dataset provided us with 244,217 rows of claim data for years 2010-2019.
What’s Included:
- Demographic information like race/ethnicity
- Claim type and amount paid on the claim
Indiana Department of Education (IDOE)
We requested six datasets from IDOE on academic standardized test outcomes, school attendance, high school graduation, and college enrollment.
ISTEP
ISTEP was the statewide academic standardized test administered to all Indiana students grades 3-8 and high school sophomore between 1987 and 2021. This dataset provided us with 82,720 rows of data for 2009-2021 school years.
What’s Included:
- Proficiency data on math, English Language (ELA), social studies, and science
ISTAR
ISTAR is the alternative statewide academic standardized test administered to all Indiana students with “significant cognitive disabilities” grades 3-8 and high school sophomores. This dataset provided us with 6,517 rows of test score data for years 2007-2021.
What’s Included:
- Proficiency data on math, English Language (ELA), social studies, science, and biology
IREAD
IREAD is Indiana’s current statewide academic standardized reading test administered to all students in grade 3. This dataset provided us with 45,159 rows of test score data for years 2012-2016.
What’s Included:
- Proficiency data on reading for third graders
High School Cohort
The Indiana Department of Education collects data on every high school in the state including demographics and academic achievement measures. This dataset provided us with 87,347 rows of high school student data for graduation years 2011-2025.
What’s Included:
- Descriptive fields like socioeconomic status, special education status, English-learner status, high-ability status, and homelessness status
- Academic data on achievement in math, algebra, and English Language (ELA). Also, whether student took AP Exams or was in an honors program
- ACT and SAT scores
Degree Enrollment
The Department of Education also collects college enrollment and degree attainment data on high school students entering postsecondary degree granting institutions. This dataset provided us with 3,141 rows of college enrollment and attainment data for years 2015-2021.
What’s Included:
- Descriptive fields like veteran status, residency status, financial aid status, Pell Grant status, and 21st Century Scholars status
- Degree types (associate, bachelor, etc.)
K-12 Attendance
The IDOE keeps track of attendance records at the school level for all K-12 schools in the state. This dataset provided us with 247,733 rows of college enrollment and attainment data for years 2004-2021.
What’s Included:
- Attendance fields by various school types, school location, race/ethnicity, gender, and school year
- Enrolled Days
- Attended Days
- Absent/Excused Days
- Absent/Total Days
Process
As described in the previous section, The Polis Center requested datasets from the Indiana Management Performance Hub (MPH) to identify DHH children in Indiana and their educational outcomes. MPH gathered the requested datasets and attempted to link records between datasets using unique identifiers. MPH uses a record linkage algorithm that utilizes millions of state records and runs weekly on their system. The heaviest weight in matching is placed on Social Security Number, though First Name, Last Name, DOB, Race, Gender, and Ethnicity are all also used.
The goal of this process was to compile a large dataset that includes data about each child appearing in any of the systems and attach to each child’s record any information about his or her educational outcomes and services received. This process required the same demographic identifying data be present in all the data sets so a child’s record can be appropriately matched to its associated record in other datasets.
As mentioned before, some of the datasets we requested did not overlap in ways that were conducive to our analysis. To be an effective dataset for analysis, a source needed to identify children’s DHH status, whether they use hearing aids, and what their mode of communication is. Additionally, the source needed to link those identified children to education data to determine any outcomes and compare them to the general population.
The Polis Center created this interactive visualization (available in the online version of this report) to demonstrate the ability or inability to establish overlap between data sources. Each bubble represents a different dataset, while each gray line shows the number of records that match between each source.
For this analysis, Hear Indiana prioritized academic standardized test results for children who use hearing aids or cochlear implants and who use spoken language communication. Data on HAAPI applicants provided the closest available approximation to this population, though it only includes information on children who received hearing aids, not cochlear implants. A substantial share of spoken-language HAAPI applicant children (515, or 36 percent) also were in the ISTEP table and 337 (23 percent) were in the IREAD table. This allowed the analysis of academic test results in primary, intermediate, and secondary schools for HAAPI applicants.
Some of the other datasets were not necessary to answer our research questions. FSSA hearing claims contain diagnosis codes that can identify children with hearing loss, but because they are Medicaid claims, this represents mostly low-income children. It is also not specifically those with hearing aids, cochlear implants, or listening and spoken language therapy, so these data cannot be used to answer questions about outcomes for children who receive those treatments.
Early hearing screening (EHDI) data measures hearing levels of newborn children and degree of hearing loss. This dataset could be used to build a comparison group of overall deaf and hard of hearing children and to provide more nuanced information about when hearing loss was detected and the degree of hearing loss for HAAPI applicants. However, EHDI data connects poorly with other datasets and does not identify use of hearing aids. A major factor in the lack of connection is that since EHDI data is based mostly on newborn population, many of those people are simply not old enough to exist in some of the other datasets. The oldest people in the EHDI dataset are now high school freshmen. This oldest group also does not overlap the end of 2016 IREAD data which is administered in 3rd grade.
Recommendations
To improve and expand on this research report, The Polis Center makes several recommendations for future efforts.
Our initial approach was to request snapshots from datasets based on certain parameters (individuals who received service between certain dates or had certain claims or diagnosis codes related to hearing loss). After discussions with MPH, there would be more matches across data sources if we used the HAAPI applicants to build a cohort. MPH would then look for that set specific of individuals, based on their unique identifier, in datasets from FSSA, ISDH, and IDOE. According to MPH, this approach is more likely to result in higher match rates than the alternative (requesting records about a very large number of people and hoping that there is significant overlap between datasets).
2) Find data on children with cochlear implants
While this research was successful in understanding test scores for HAAPI applicants using hearing aids and spoken language, there are many deaf or hard of hearing children who use cochlear implants. None of the data sources we requested had information on this population, potentially leading to gaps in understanding how deaf or hard of hearing children perform academically. Future research should attempt to include this group.
3) Compare academic standardized test outcomes for children who use hearing aids and communicate through spoken language to those who use other modes of communication
As stated earlier, our analysis is restricted to only hearing aid users that were ever recorded as using spoken language as their mode of communication. However, there are other modes of communication (like ASL) that can be used alone or in combination with spoken language alongside or without hearing aids. Future analyses could attempt to compare academic standardized test scores among students using these various modes of communication and/or amplification devices.
4) Create a control group of other deaf or hard of hearing children who do not use any form of amplification
To truly understand the impact of support systems like hearing aids on educational outcomes, a control group is needed of children who do not use them. Preferably, we would recommend a dataset of DHH children moving through the education system who use neither hearing aids nor cochlear implants, but use spoken language as their mode of communication.
5) Find more expansive data on children using hearing aids
The HAAPI program is useful for identifying a group of children using hearing aids, but it is not inclusive of all children who use them. Indiana children may get their hearing aids through their family’s insurer, including Medicaid or private insurers, rather than HAAPI. Additionally, the HAAPI data we received did not have data on the amount of listening and spoken language therapy (nor any other form of therapy or school services) children had received in addition to their hearing aids. It’s possible that a link exists between the amount of therapy and school services a child receives and educational outcomes.
6) Provide more localized analysis using county of residence
In future research, children’s county of residence could be used to provide county-level analysis. This could generate indicators such as total HAAPI applicants in each county and per capita rates of participation by county. If the total number of records could be improved by 1) additional years of program data from HAAPI, 2) better matches with other data sources based on recommendation #1, and 3) additional records in our dataset by expanding to including children with cochlear implants or other children with hearing aids outside the HAAPI program, then outcomes could be analyzed in some counties with enough data for reliable analysis.
References
Indiana Department of Education, IREAD-3. https://www.in.gov/doe/students/assessment/iread-3/
Census Reporter, Topics - Disability. https://censusreporter.org/topics/disability/
Kaiser Family Foundation, Distribution of the Nonelderly with Medicaid by Race/Ethnicity. https://www.kff.org/medicaid/state-indicator/medicaid-distribution-nonelderly-by-raceethnicity/https://www.cdc.gov/violenceprevention/aces/index.html
Cremers, C W et al. “The sex-ratio in childhood deafness, an analysis of the male predominance” International Journal of Pediatric Otorhinolaryngology vol. 30,2 (1994): doi:10.1016/0165-5876(94)90192-9. https://pubmed.ncbi.nlm.nih.gov/8063495/.
Data Linking Visualization. https://embed.kumu.io/5335e0fabd4dcc4ab4602cf7a9e0f0a2

