Equity in Economic Opportunity: How Race, Place, and Class Impact Economic Mobility in Indianapolis
Research from Harvard Economist Raj Chetty examines how the conditions in which children grew up relate to their earnings in adulthood.1 While this study was nationwide, we focus on highlighting the results in Indianapolis, putting that information in local context, and deepening the research based on local conditions. We also recommend further research and policy implications.
We find that Indianapolis has low economic opportunity overall, especially for children of low-income families. Race disparities are stark: Black children of low-income families earn $9,000 less than White children at age 35. But neighborhood disparities exist, as well. Children earn more as adults when their neighborhood has more families with high incomes, even when their own parents’ income is low. Children of segregated neighborhoods also earn less as adults.
Measuring Economic Opportunity
Economic opportunity in this report is defined as the ability of children born to low-income families to earn enough as adults to support their household.
To provide a simple, clear comparison across cities and neighborhoods, we focus on one indicator of economic opportunity: For people born to low-income parents, how much does their household earn once they reach adulthood?
We examine outcomes for people who were born into low-income families because this represents the greatest need for policy interventions. If children remain in the economic situation into which they were born, this result is of most concern for children born to low-income families. The children in this study were born between 1978 and 1983. Low-income families are defined as those with household income at the 25th percentile compared to other families with children born at the same time. In other word, 75 percent of U.S. families at a similar stage of life earned more money than these low-income families. This equates to $27,000 in 2015 dollars.
| Parents’ household income (percentile) | Parents’ household income (dollars) |
| 10th | $13,200 |
| 25th | $27,000 |
| 50th (median) | $55,800 |
| 75th | $94,300 |
| 90th | $141,700 |
The economic outcome for these children is measured as their household income in 2015, or when children born in the target years were 32 to 37 years old. Income refers to household income, including an individual and spouse if present, as measured in constant dollars, which removes the effect of inflation. We also represent the outcome as a percentile, which compares household income ranks against others in the same age cohort.
Much of this data is about place, both cities and neighborhoods.2 When we discuss cities, we are referring to metropolitan areas. When referring to Indianapolis in this report, we mean the metropolitan area. When we discuss neighborhoods, we are referring to census tracts (small areas of a county with between 2,500 – 7,500 residents). Neighborhood-level analysis includes all the census tracts within the 11-county Indianapolis metropolitan area.3
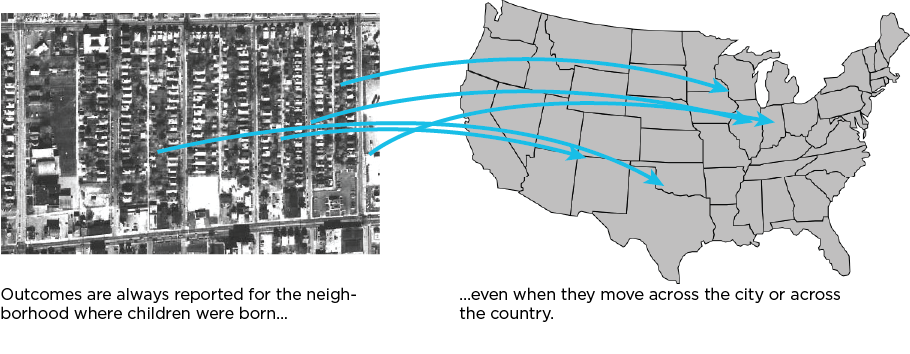
Outcomes are generally reported for children who were born in a specific city or neighborhood without regard to where they live as adults. For children born in Indianapolis but living elsewhere in adulthood, their outcomes are still attributed to Indianapolis and the neighborhood where they were born. This allows us to see the impact of location during a person’s childhood rather than simply describing the characteristics of people who live in a place now.
These outcomes represent opportunity in Indianapolis and its neighborhoods in the 1980s. There is a 35-year lag between when these children were born and when their outcomes were measured. To understand the current state of opportunity for children born now, we would need to wait until 2055 to measure their outcomes. Still, these data give us the ability to track a large cohort of children across a long time period and compare childhood conditions to outcomes. Many of the neighborhoods identified as low-opportunity places still struggle with conditions like low incomes, and many of the systems that led to racial inequity persists.
What is the state of economic mobility for low-income children?
Economic mobility in Indianapolis is lower than almost all other large cities.
The following map shows the eventual incomes of children who were born into low-income households and spent their childhoods in the areas shown. The starting point for all these children was the same: They were born into families earning $27,000 (the 25th percentile nationally).
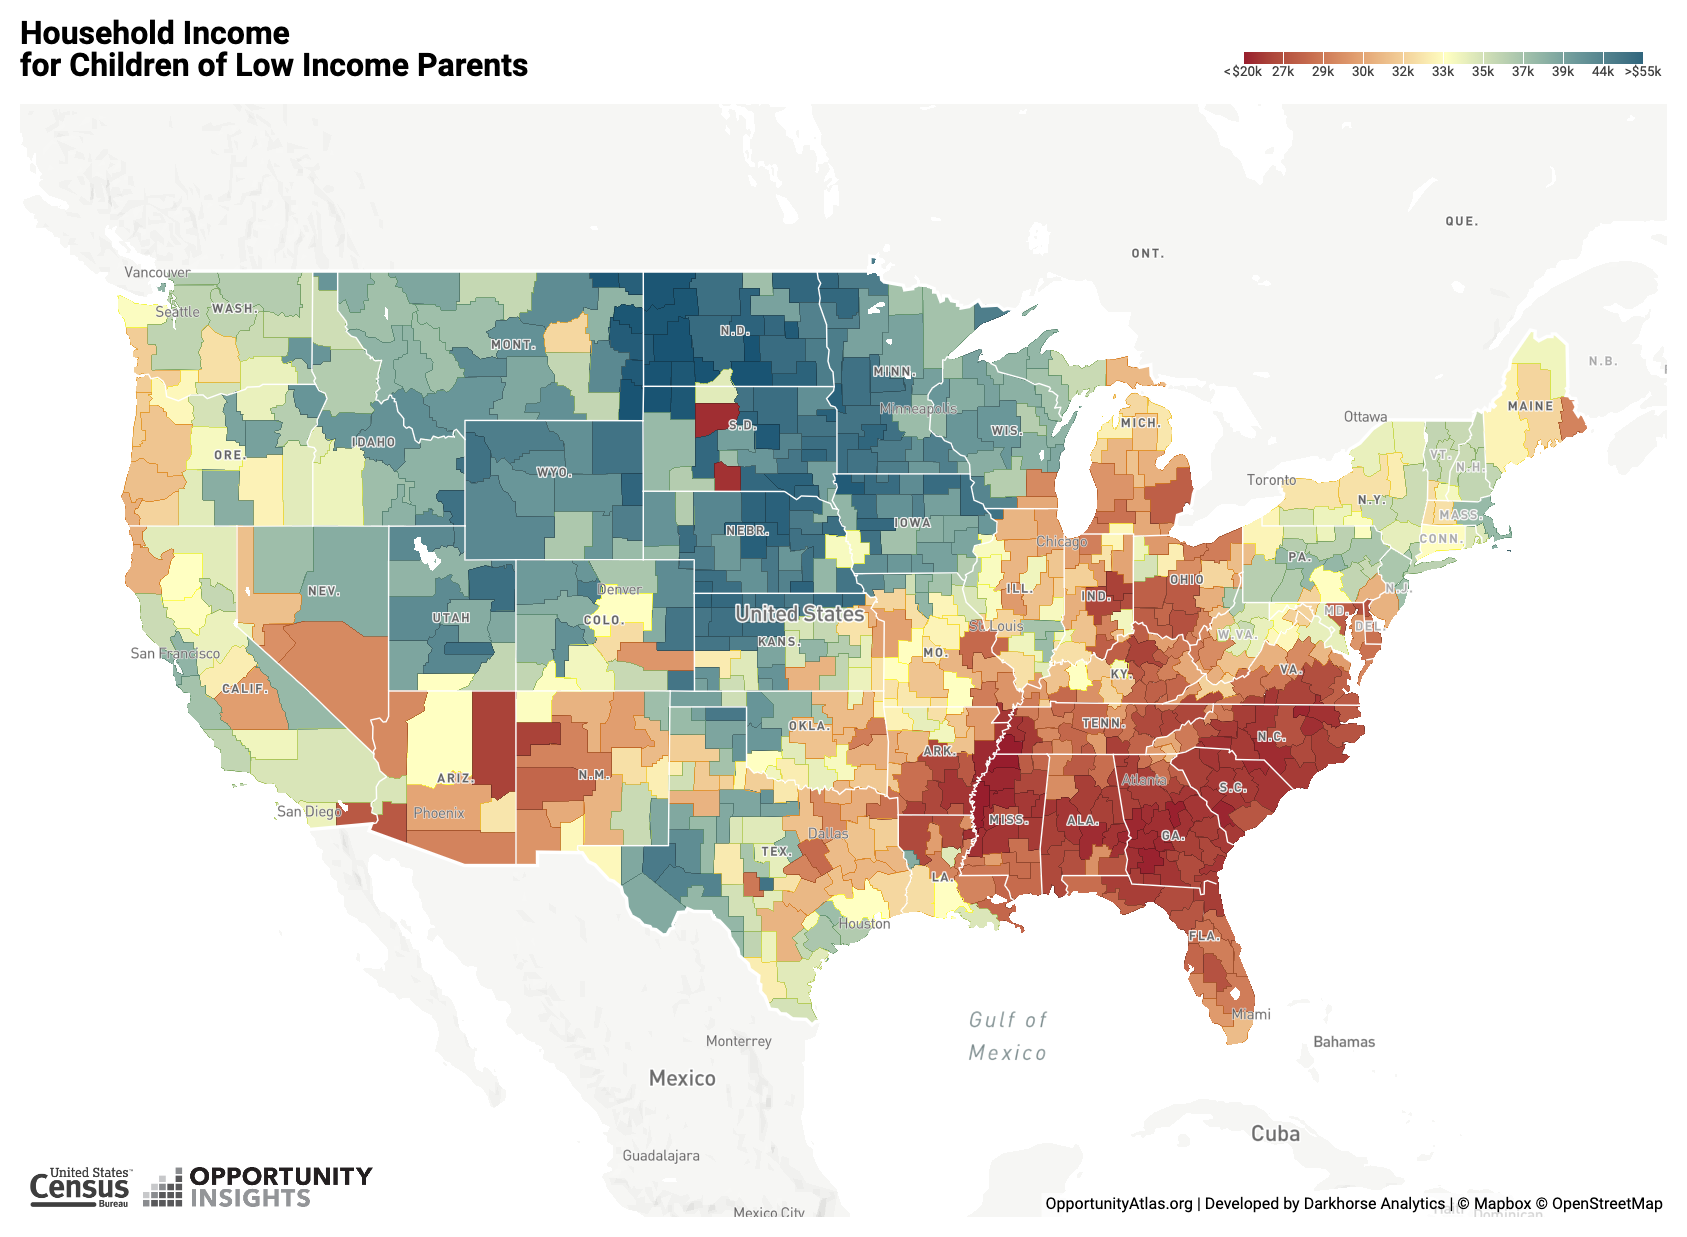
The outcomes vary widely between regions and cities. Children who grew up in Dubuque, Iowa earned $46,000 on average when they were age 35. Children who grew up in Minneapolis earned $36,000, and children from Nashville earned $29,000. In general, people who grew up in the Midwest and Southeast, for example, tended to have much lower incomes relative to people who grow up in the Northern Great Plains and to a lesser extent, the Northeast.
Low-income children born in Indianapolis grew up to earn $27,000 per year on average, the same as their parents’ income 35 years earlier. This means mobility in Indianapolis is worse than for any other city in the Midwest, except for Muncie and Anderson. In fact, outcomes in Indianapolis for low-income children are significantly worse than nearly all large cities, ranking 48th out of the 50 largest cities, trailed only by Atlanta and Charlotte.
In most cities, low-income children grew up to earn more than their parents. For example, in Pittsburgh and Chicago the average low-income child earned $36,000 and $31,000, respectively.
The following chart shows the distribution of the 50 largest cities in terms of economic mobility for low-income children, clustered by geographic region. Each point on the chart represents a city, and the placement of the point is based on the adult income of children who grew up in the noted city. This reveals that Indianapolis is less like its Midwest peers than it is like the Southern cities of Atlanta and New Orleans.
The low ranking of the Indianapolis area is driven by especially poor economic mobility for low-income white children. Central Indiana commuting zones (Indianapolis, Muncie, and Columbus) all rank in the bottom half of the bottom one percent of all zones in the country for low-income white children. Conversely, outcomes for black children in Indianapolis are in the 23rd percentile nationally.
Poor mobility for white children is in part due to high incarceration rates. Amongst the largest 100 cities in the U.S., Indianapolis has the second highest incarceration rate for white male low-income children growing up in the 1980s and 1990s. To be clear, the incarceration rate for black males is about three times higher than the white rate. But the black incarceration is average compared to other cities, and therefore does not explain Indianapolis’ comparatively low economic mobility.
What can we learn from Indianapolis basic opportunity indicators?
Parents’ income plays a big role in children’s economic opportunity.
Children born in Indianapolis in the early 1980s grew up to earn $43,000 on average in 2015. High income families in the target years earned about $94,000 annually. Children of high-income families in Indianapolis grew up to earn $50,000 per year on average. Low-income families earned $27,000 on average, and their children grew up to earn $27,000 per year.
We can learn two things about opportunity in Indianapolis from these results. First, there is a large gap between the opportunity of children born to high- or low-income families. The financial situation of a child’s parents can influence his or her economic mobility.
The opportunity gap between children born to high-income and low-income families is smaller in Indianapolis than in 88 percent of other large cities. In Indianapolis, children of low-income families earn 46 cents for every dollar earned by children of high-income families. For the average city, this rate is 38 cents.
Second, even those born to high income families struggle to stay in that category by adulthood. By the time they reach age 35, children born to high-income parents earned about half their parent’s income. Of course, earnings tend to rise as people get older. But because we are comparing parental income when a child was born to that child’s income at age 35, the influence of age is mitigated. The parents and children were generally at similar stages in life when income was measured.
Disparities in economic mobility
An individual’s race plays a big role in economic mobility. The place you grow up also matters as do the. socioeconomic characteristics of the neighborhood.
Race
A child’s race plays a major role in explaining the variation in economic mobility. Overall, children born to families with low incomes are more likely to stay at that economic level than to move to any other level. This lack of mobility is worse for Black children. Forty-eight percent of Black boys remain low-income in adulthood. Only 31 percent of White boys remain low-income. (These rates represent national trends.)
In Indianapolis, Black children born to low-income families grew up to earn $9,000 less than White children born to low-income families. Black children earned $22,000 per year on average compared to $31,000 for White children. Even Black boys born to high-income parents are half as likely to have high incomes in adulthood compared to White boys and twice as likely to have low incomes. One fifth of high-income Black children fall to the lowest income bracket as adults.
This gap is significant. In 2015, $9,000 represented 11 months of rent in the average Central Indiana apartment.4 This racial opportunity gap is smaller than other large cities. However, the small gap is driven more by poor outcomes for White children than by good outcomes for Black children. Economic mobility for low-income White children in Indianapolis ranks last among the 50 largest cities.
Place
When examining geographic variability, one might reason that different people live in different places, so it is impossible to tell if the pattern is due to this sorting (e.g., by race) or if there is something independently important about the places themselves. Chetty concludes that place has an influence on economic mobility, which is independent from an individual’s demographics. He demonstrates the effect of neighborhoods by measuring intergenerational economic mobility of children that move between neighborhoods at different ages. As it turns out, every year that a child spends in a disadvantaged neighborhood has an incrementally negative effect on their outcomes as adults, regardless of their race, income, or other demographic characteristics. A child that moves to a higher opportunity area by age 5, for example, does better in adulthood than a child that moves at age 6, and so on.
In Indianapolis, a child’s economic mobility directly relates to the place s/he lived as a child. The chart below shows the outcome of all children born to families with a low household income (in the 25th percentile), and their respective household incomes as adults. The corresponding map demonstrates spatial patterns – such as those who did not improve their economic outcomes are those who grew up in neighborhoods with lower socio-economic status overall within the inner cities, and those with improved outcomes grew up in communities with higher overall socio-economic status.
Does the local economy make the biggest impact?
The common and intuitive understanding is that the economic health of a city plays a major factor in the economic well-being of its residents, and this outcome is driven by factors related to the number and quality of jobs. Tax break incentives encourage major businesses to relocate their headquarters, those businesses bring new, high paying jobs, and benefits are assumed to accrue to local residents.
In fact, neither job growth nor wage growth contribute significantly to improved mobility for low-income children. Comparing the rate of job growth from 1990-2010 to intergenerational mobility, you can see that many areas of high job growth also have really low levels of upward mobility. Among the 50 largest cities, Indianapolis shows moderate levels of job growth, but low-income children from Indianapolis still have very low earnings in adulthood. The pattern is quite similar for wage growth. Statistically, there is no relationship between wage growth and low-income mobility.
Economic growth does not equate with economic opportunity for low-income children.
Even cities with high wage growth do not consistently have high economic opportunity.
Five factors related to economic mobility
Community socioeconomic factor
How it is measured
Income inequality
Size of the middle class
School quality
3rd grade math test results
Racial segregation
Thiel’s index (a measure that compares racial diversity in a census tract to the overall racial makeup of city)
Social capital
Census response rate
Family structure
Share of single-parent families
Factors that contribute to economic mobility
Chetty finds that there are five factors related to the place you live that correlate most clearly with positive economic outcomes nationwide. These are access to high quality schools, high social capital, a high share of two-parent families, low racial segregation, and low economic inequality.
The strength of these relationship varies between regions and cities, however, and this model often fails to explain local variation. For example, Indianapolis has very poor mobility outcomes, but generally ranks about average in terms of these five socioeconomic factors. As a comparison, in the chart below showing the data for the 50 largest cities, we highlight Columbus, which has low mobility, and Pittsburgh, with high mobility. Neither performs markedly better or worse across all measure than Indianapolis.
To understand how the influence of these five factors varies between cities and regions, we used a statistical method called a “cluster analysis”, where groups are discovered that maximize the similarity of cities within the group and maximize the differences between each group.
We discovered four significant clusters that were similar along six indicators, the five factors as well as economic mobility itself. For some clusters, economic mobility seems to be linked to the five factors. A group of mostly White, northern cities has high mobility and performs well in each of the five factors. A group of cities with large Black populations has poor mobility outcomes on average and tends to perform poorly in the five factors.
However, two other groups do not follow the relationship between socioeconomic factors and mobility as clearly. A group of diverse cities located mostly in the Southwest and on the coasts has high average mobility but poor performance in socioeconomic factors. A group of Midwestern and Southern cities with large White populations have poor mobility despite average performance among socioeconomic factors. Indianapolis falls into this group.
How to read this chart
Darker blue rectangles represent worse socioeconomic conditions.
Lighter green rectangles represent worse opportunity outcomes.
Influences on mobility in Indianapolis neighborhoods
Because this model does not fit Indianapolis particularly well, we will be working to improve these definitions and the model. Our future research effort will aim to develop a statistical model that can describe what neighborhood conditions contribute to economic mobility in Indianapolis.
In the meantime, we identified several clear relationships between the environment where children grew up in Indianapolis and their economic outcomes as adults–income of the neighborhood, history of redlining in the neighborhood, and share of single parent families–shown in the charts below.
In the following series of charts, each line represents a census tract. The placement of the line indicates the income of the average child born to low-income parents in that particular census tract in Indianapolis. There are about 400 census tracts in the Indianapolis Metropolitan Area, and each is represented on every chart.
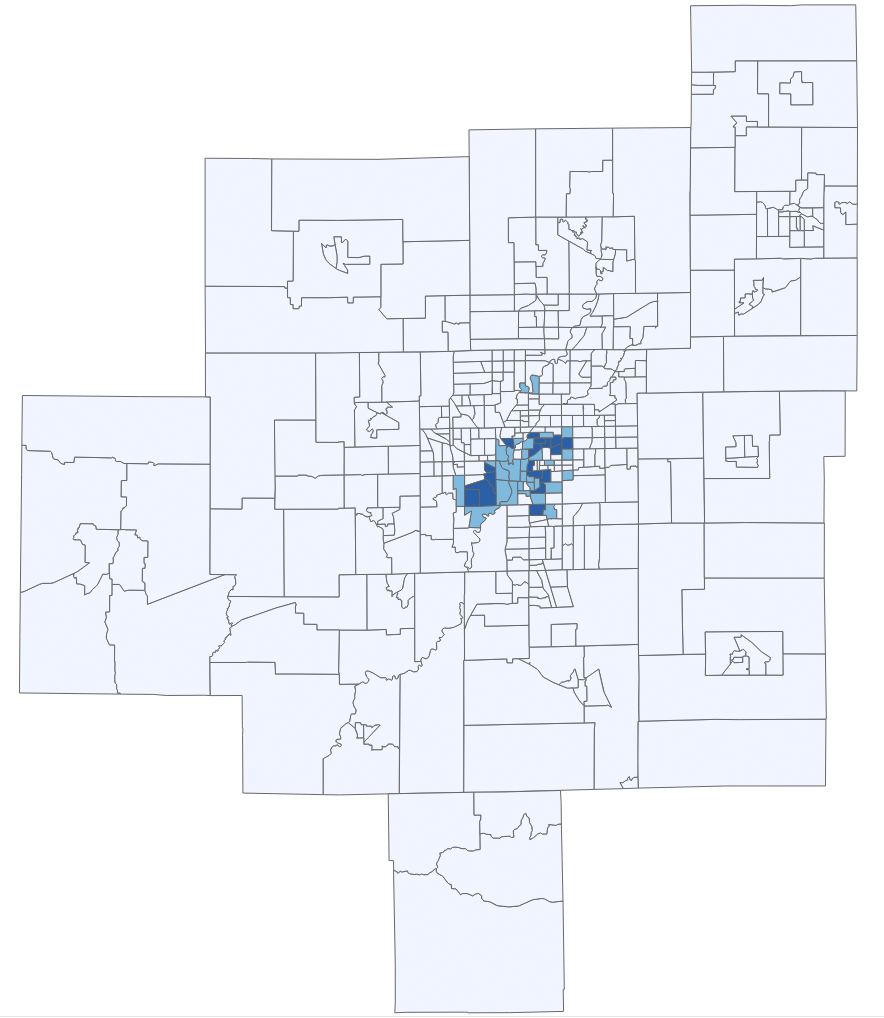
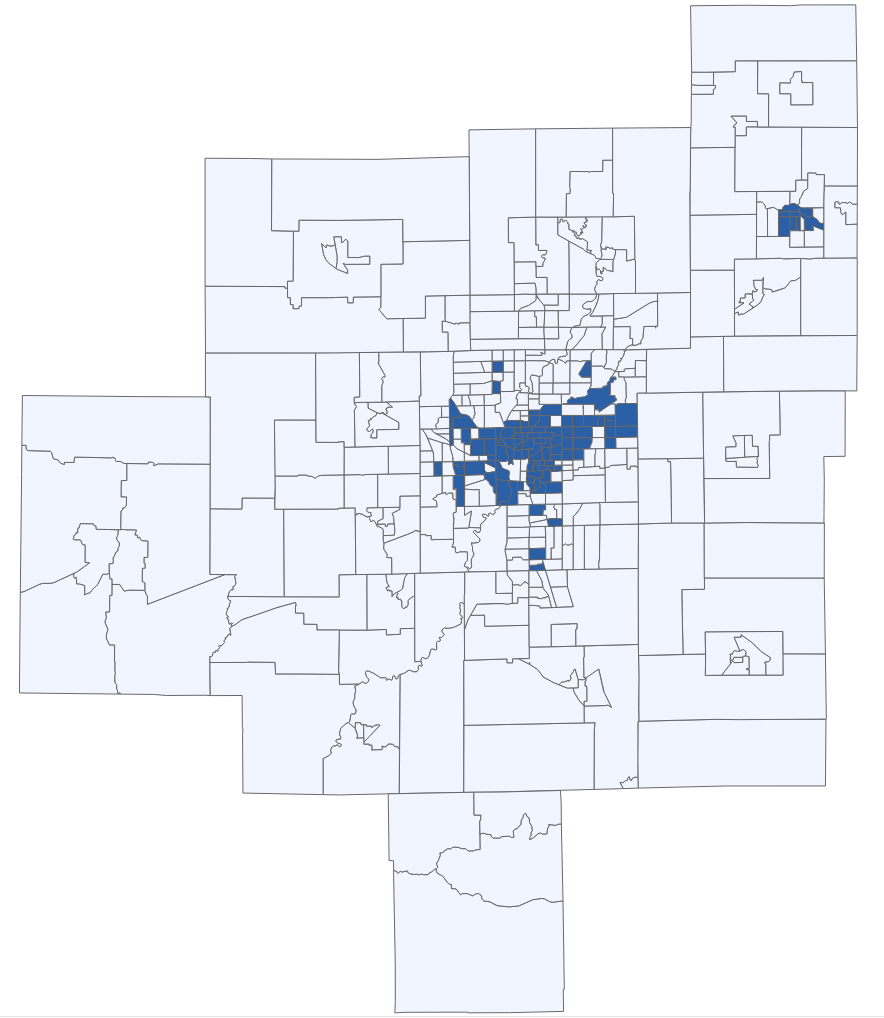
Neighborhoods are highlighted in blue on each chart and the map based on the environmental factor we explore. Highlights indicate neighborhoods with certain conditions, such as a low median household income. When comparing these charts, remember that the characteristics of the people do not change from chart to chart: These always represent children of all races and genders born to parents earning $27,000 per year. Their economic outcomes vary based on the community in which they grow up.
The top axis in the chart represents the starting point for these children, which is always $27,000 per year, shown as the 25th percentile in the chart. The bottom axis represents, for the average low-income child from that tract, how their household income ranks against other U.S. children born in the same year. For context, the following table shows the actual incomes that each percentile represents. Note that the 25th percentile, though it is the same rank as the parents’ household income, represent fewer real dollars ($15,600 compared to $27,000).
Translating children’s income percentile to dollar amounts
| Household income for grown children (percentile) | Household income for grown children (dollars) |
| 10th | $25 |
| 25th | $15,600 |
| 50th (median) | $42,300 |
| 75th | $79,100 |
| 90th | $121,500 |
These charts show the average outcomes for low-income children from each of Central Indiana’s 400 census tracts. They all start at the same place: Their parents income is at the 25th percentile ($27,000). Depending on which census tract they grow up in, their outcomes vary widely.
Each chart shows the same neighborhoods, but we highlight neighborhoods on the chart and map that have certain characteristics. This helps us visualize how neighborhood characteristics impact economic outcomes.
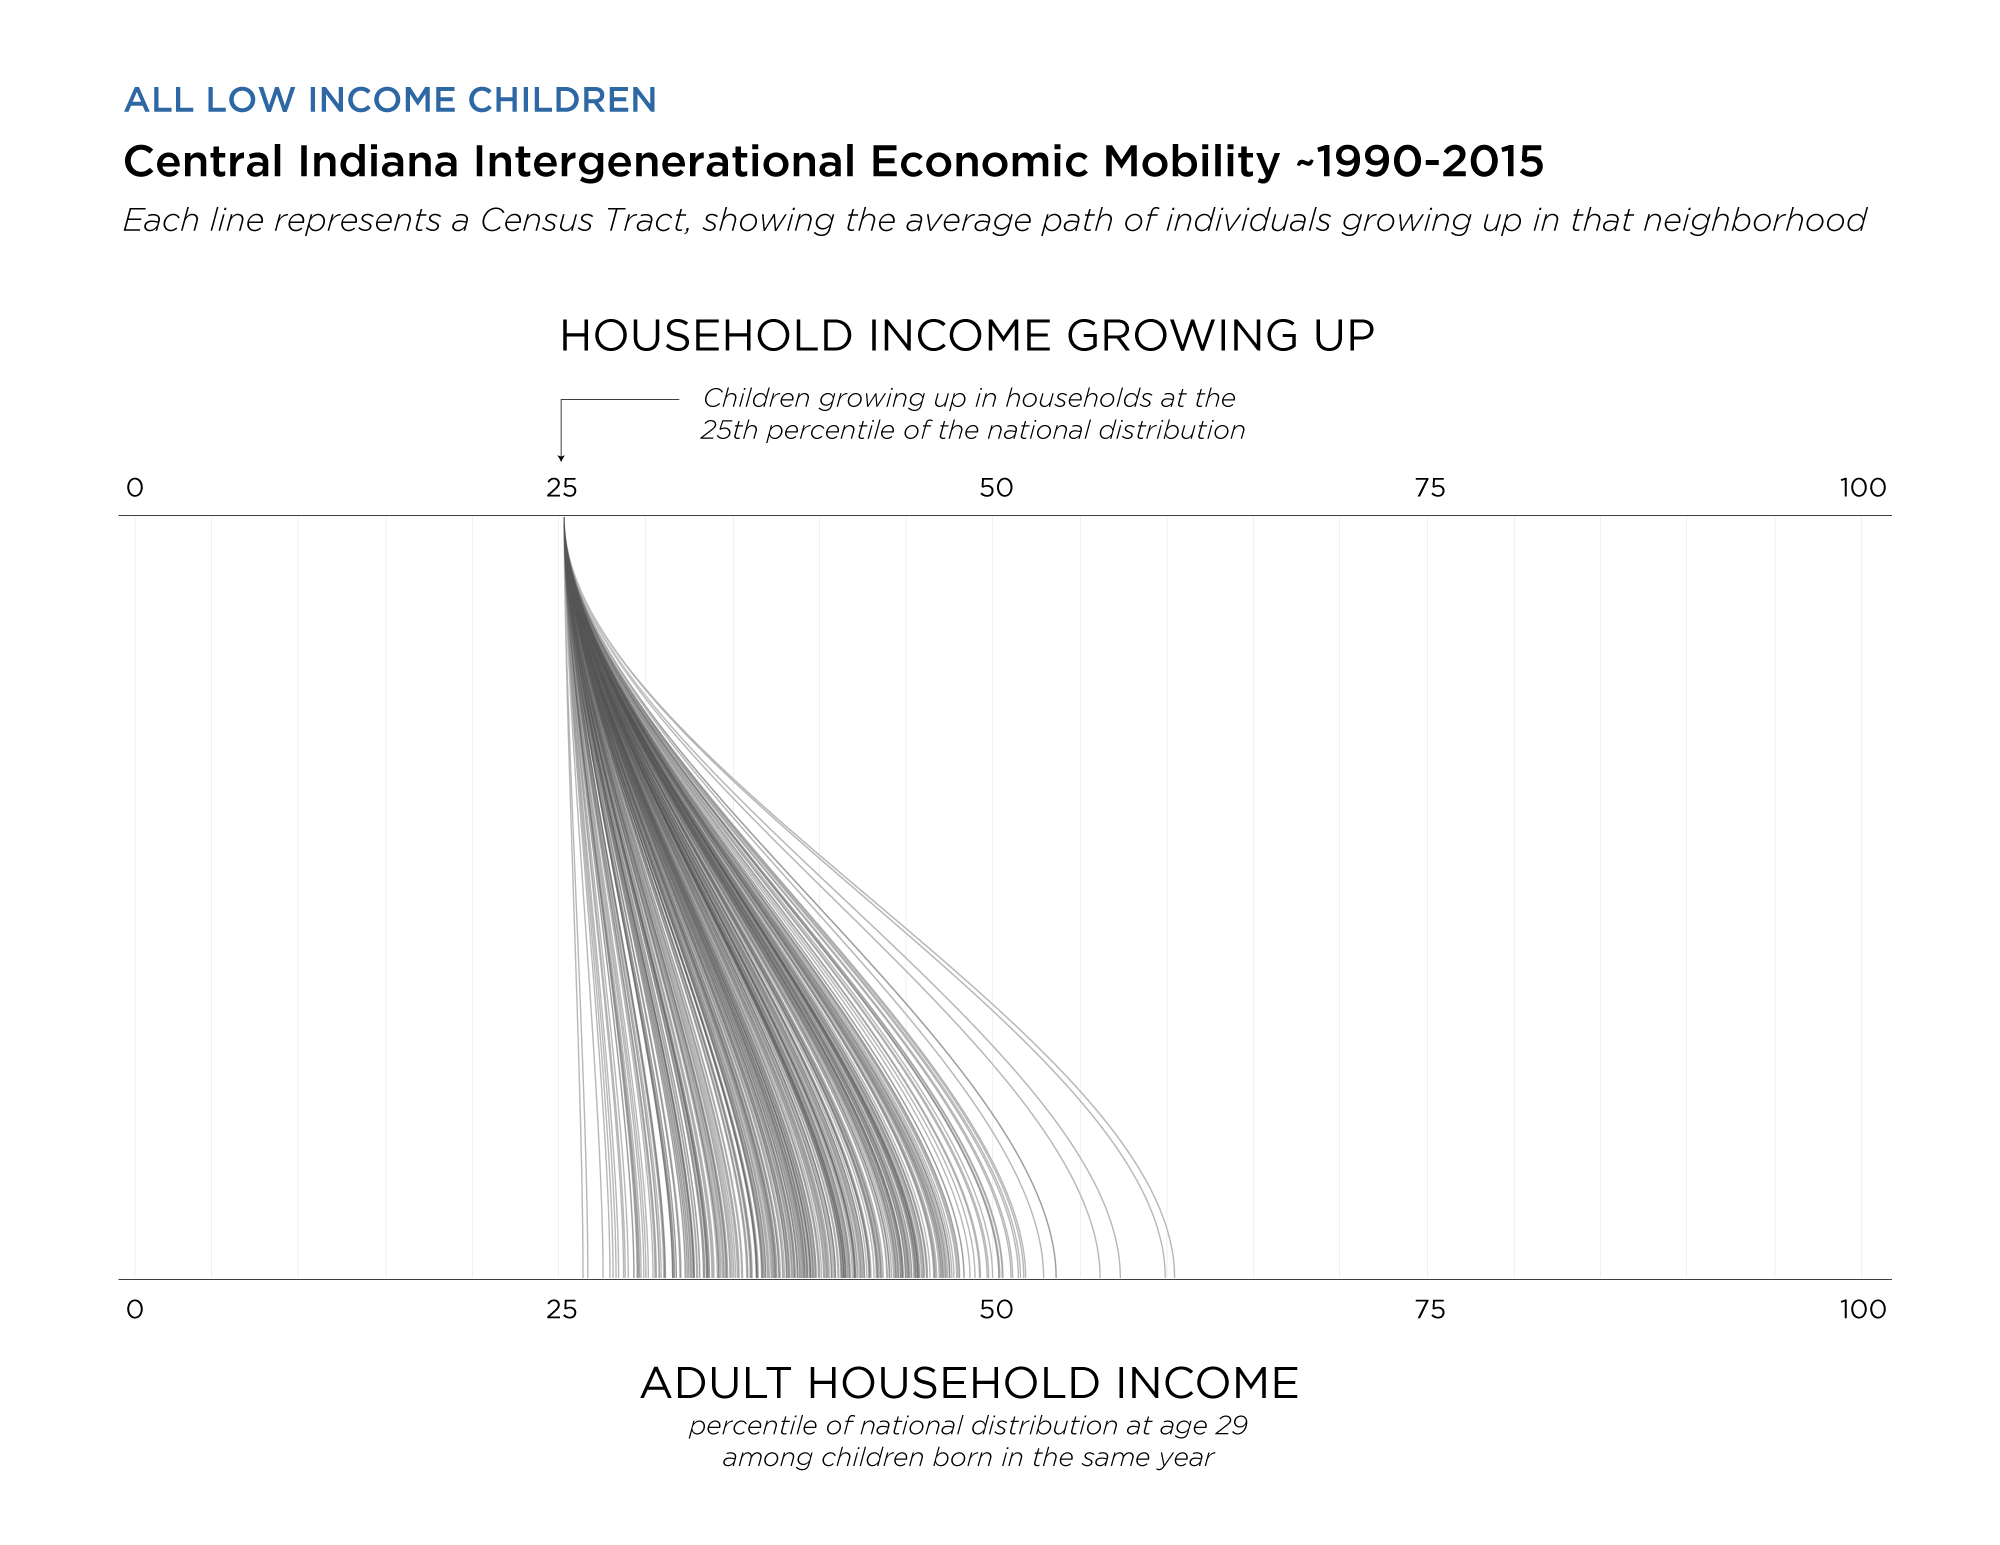
In general, the average economic outcome for low-income children falls between the 25th percentile and the 50th percentile. There are very few neighborhoods where low-income children tend to rise to incomes over the 50th percentile. Still, even a rise from the 25th percentile to the 35th percentile equates to over $10,000 in additional income.
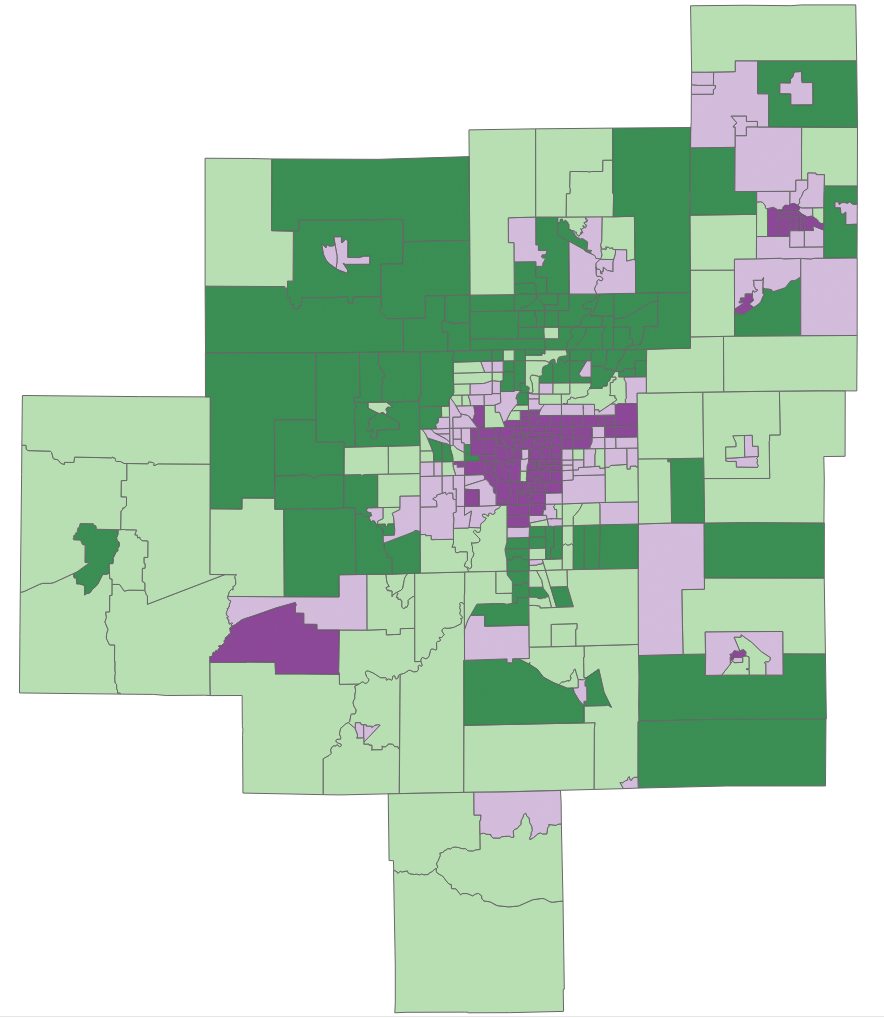
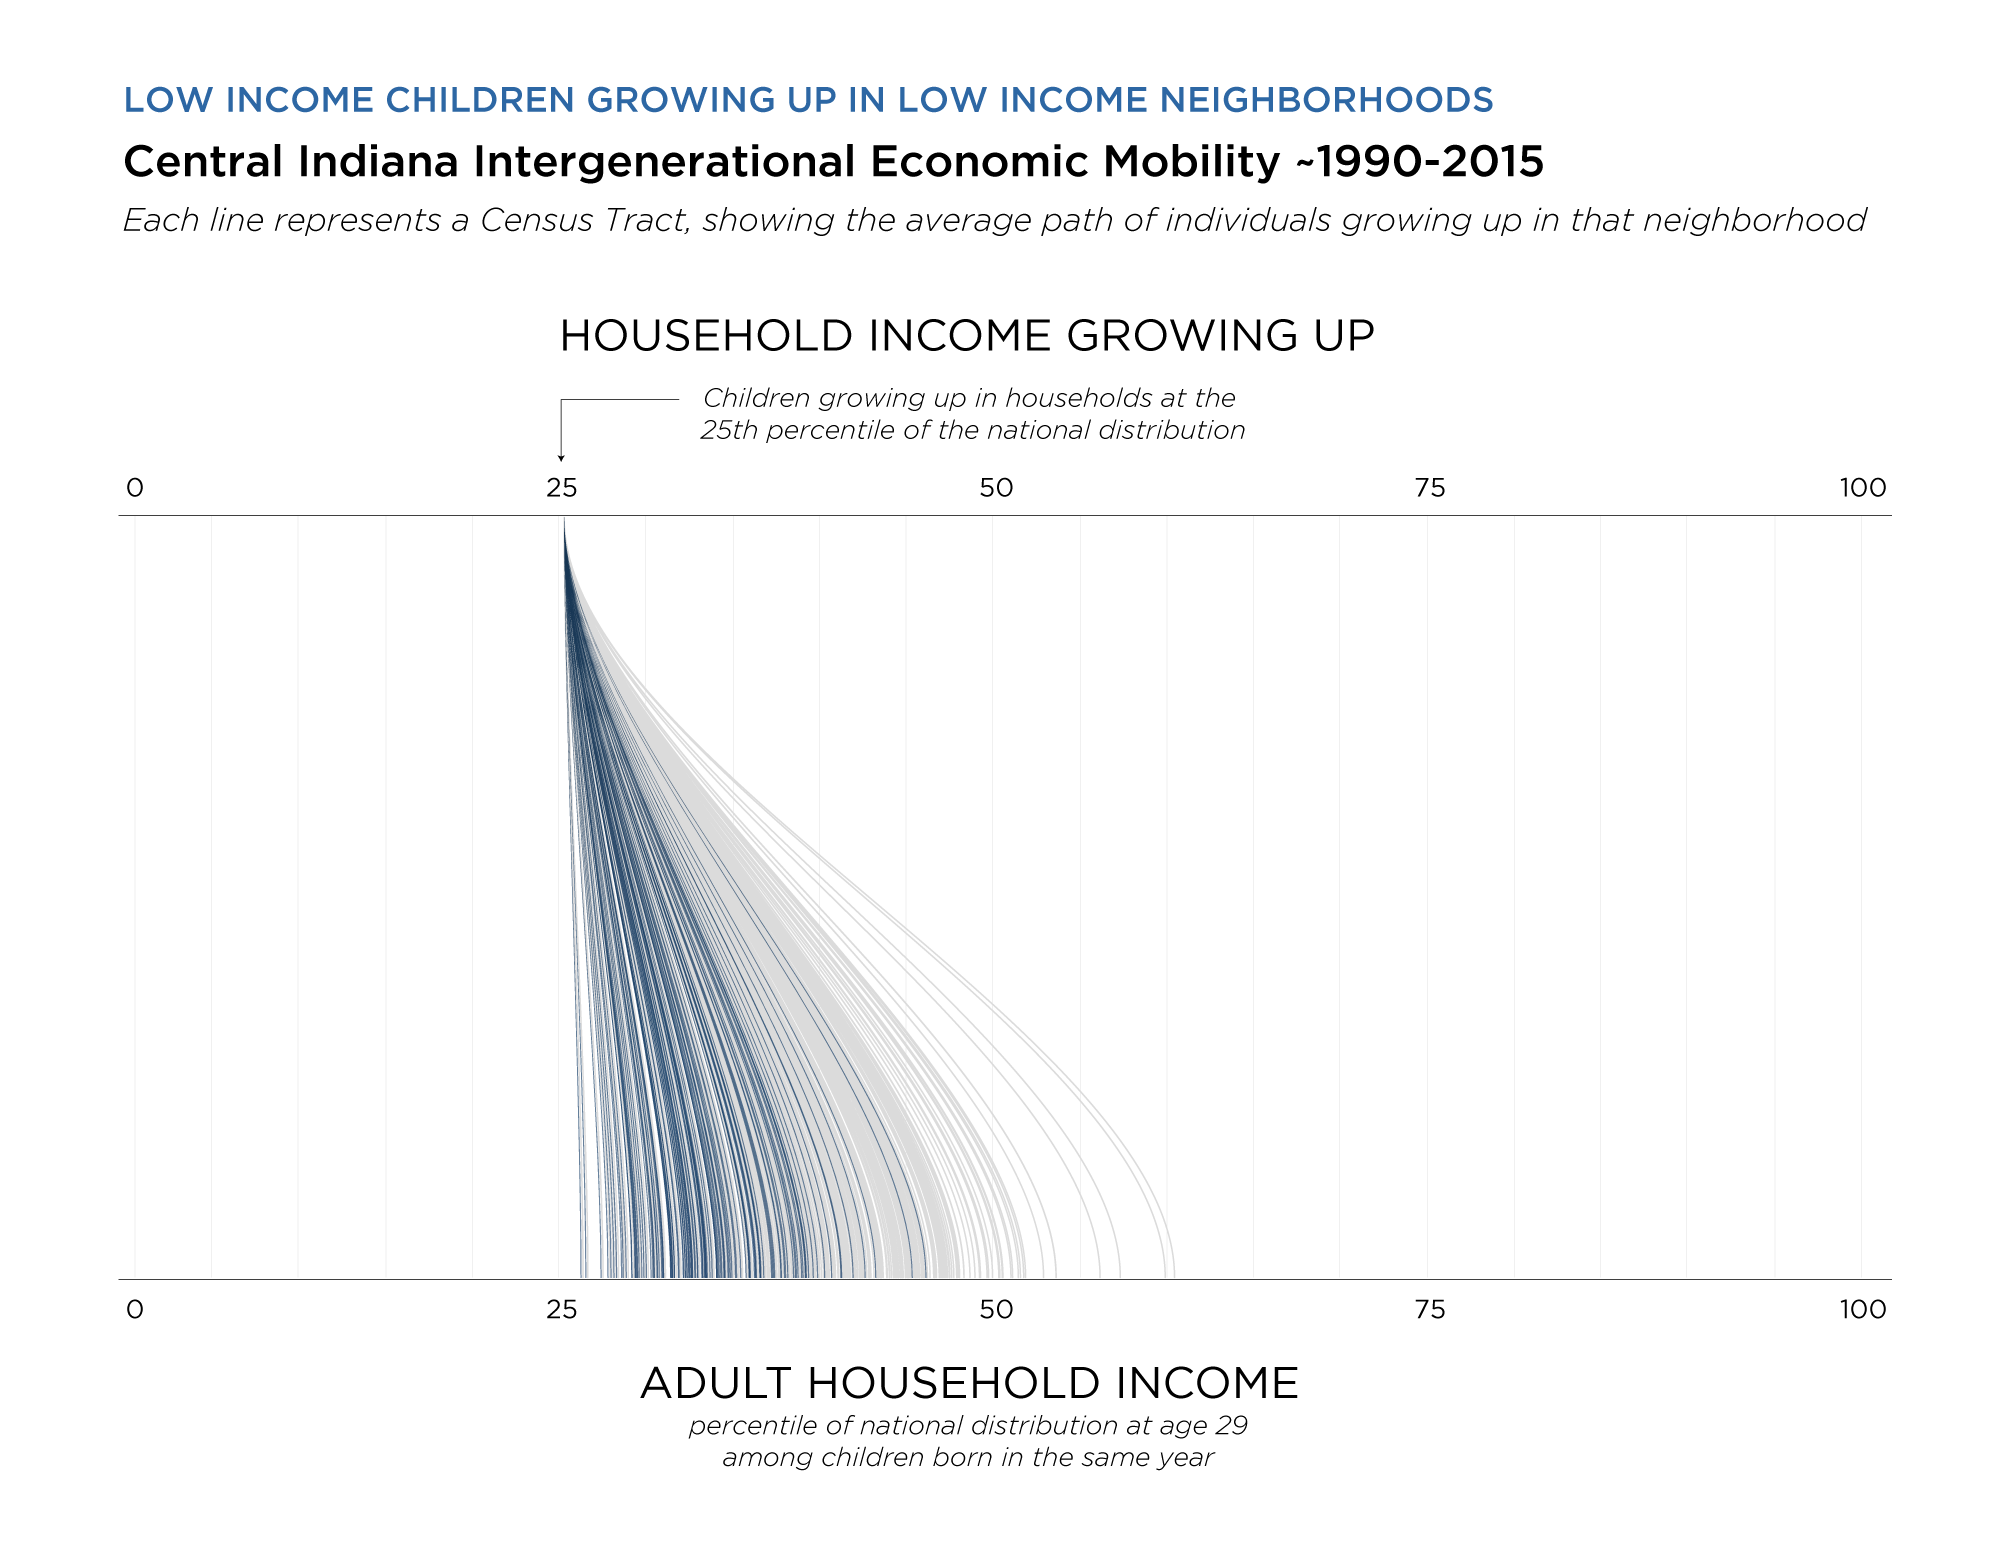
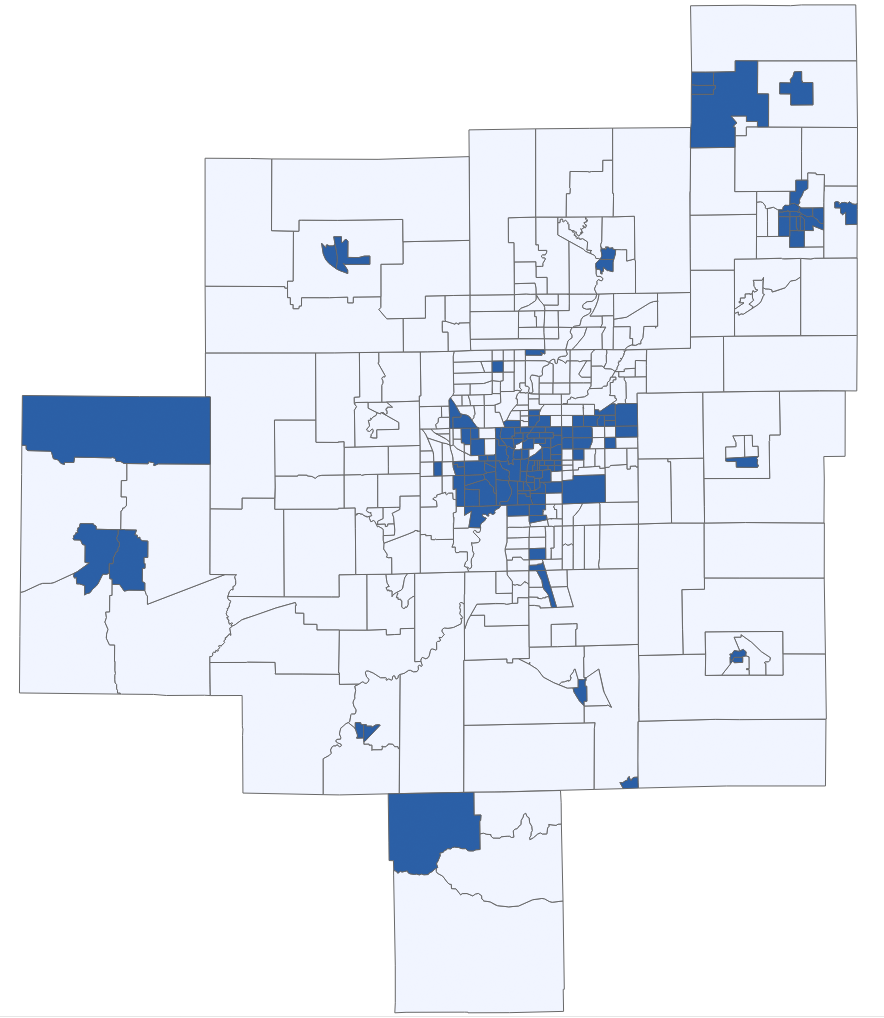
Even when family income remains constant, the income of people in the community in which they live impacts a child’s economic outcomes. The highlighted communities are the bottom third of neighborhoods according to median household income. They are mostly located in the center, east, and west of the city of Indianapolis, as well as central parts of smaller cities and towns through the region. The highlighted lines on the chart reveal that children from low-income households who grow up in low-income neighborhoods have the lowest economic mobility outcomes.
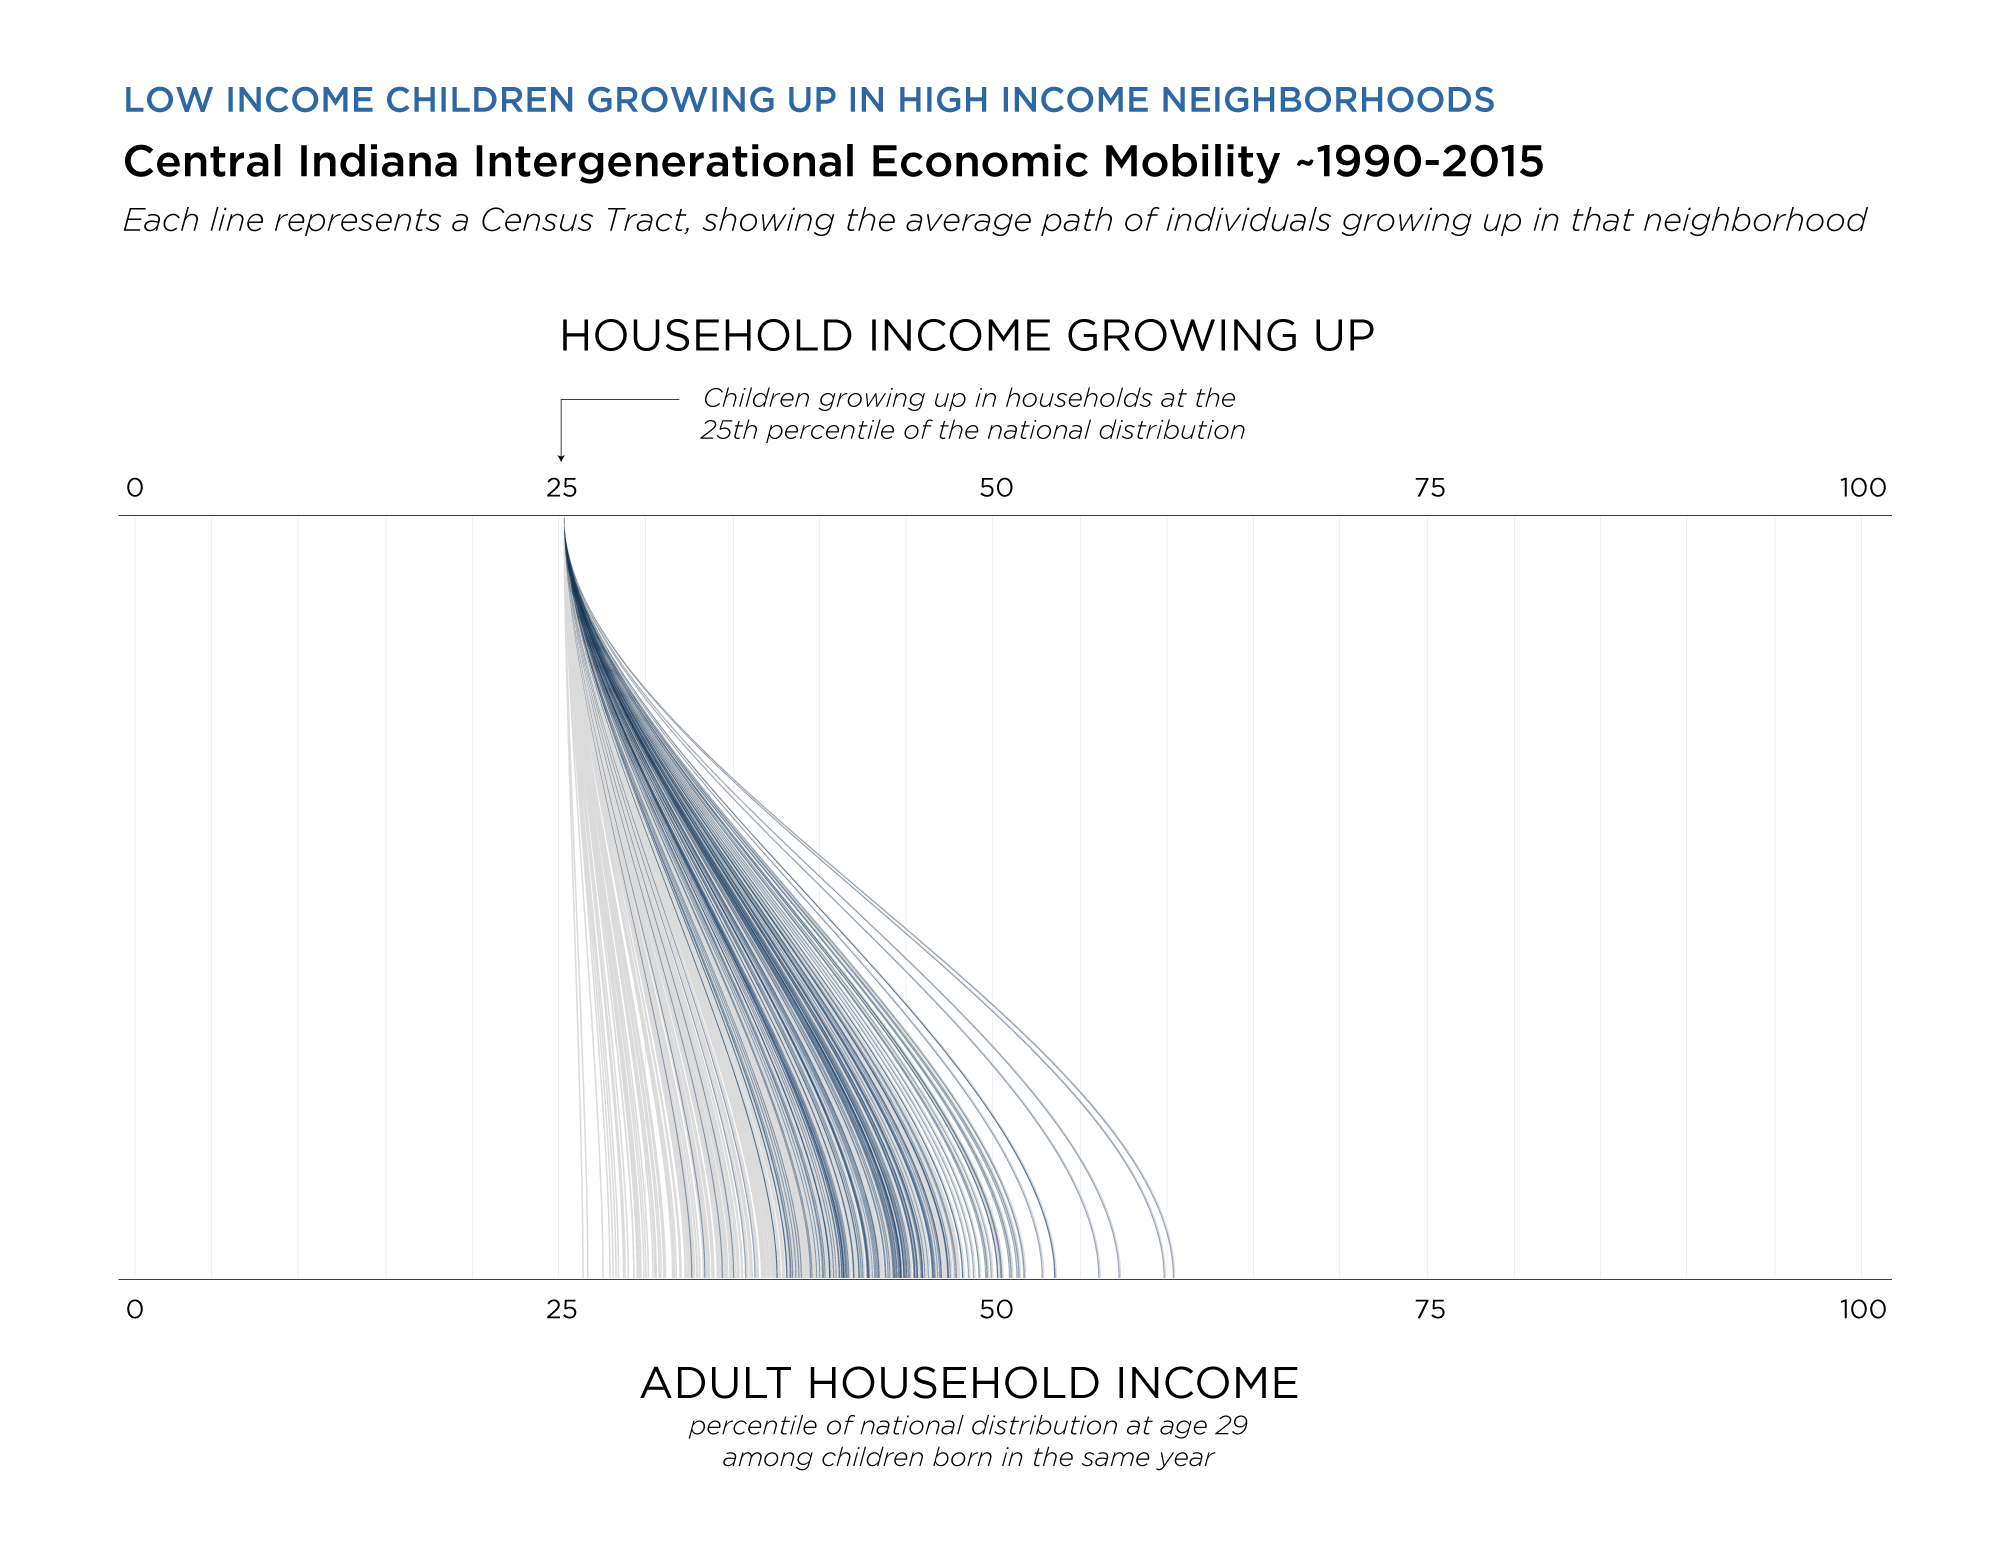
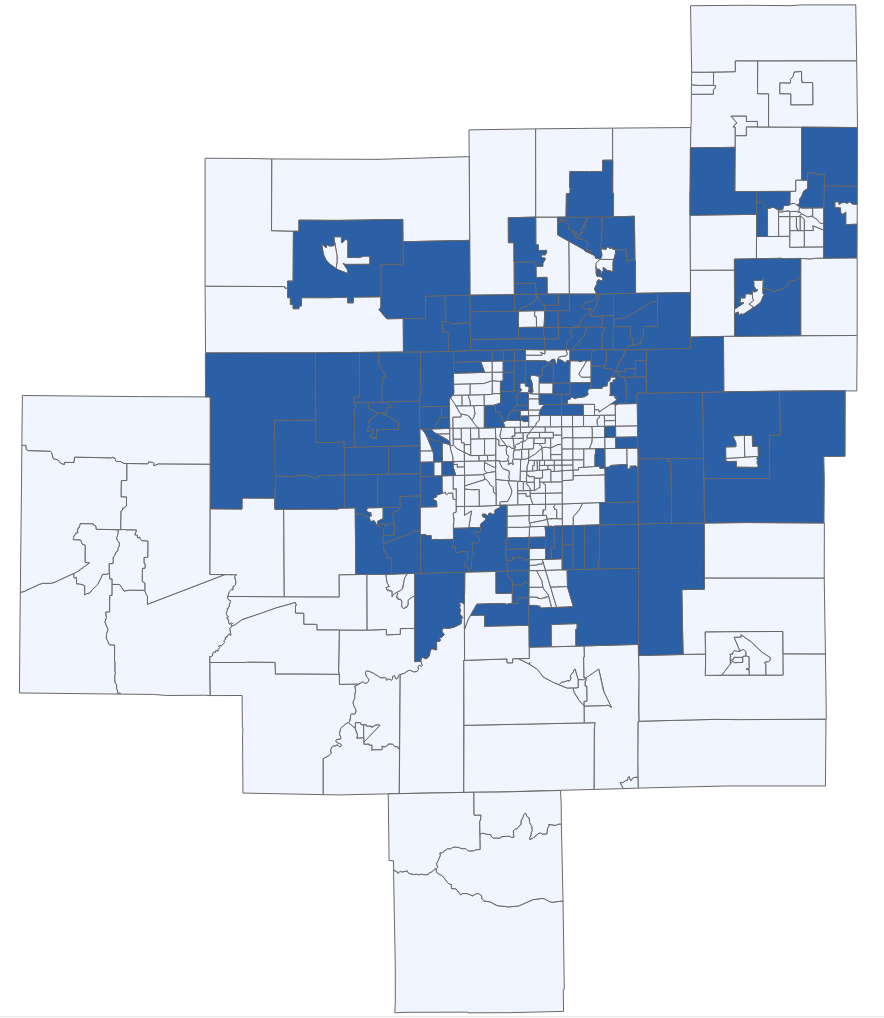
When low-income children grow up in high-income neighborhoods, they have markedly improved outcomes. These communities, located in the suburbs of Indianapolis and some rural parts of Hancock and Hendricks counties, are the highest third of census tracts according to median household income.
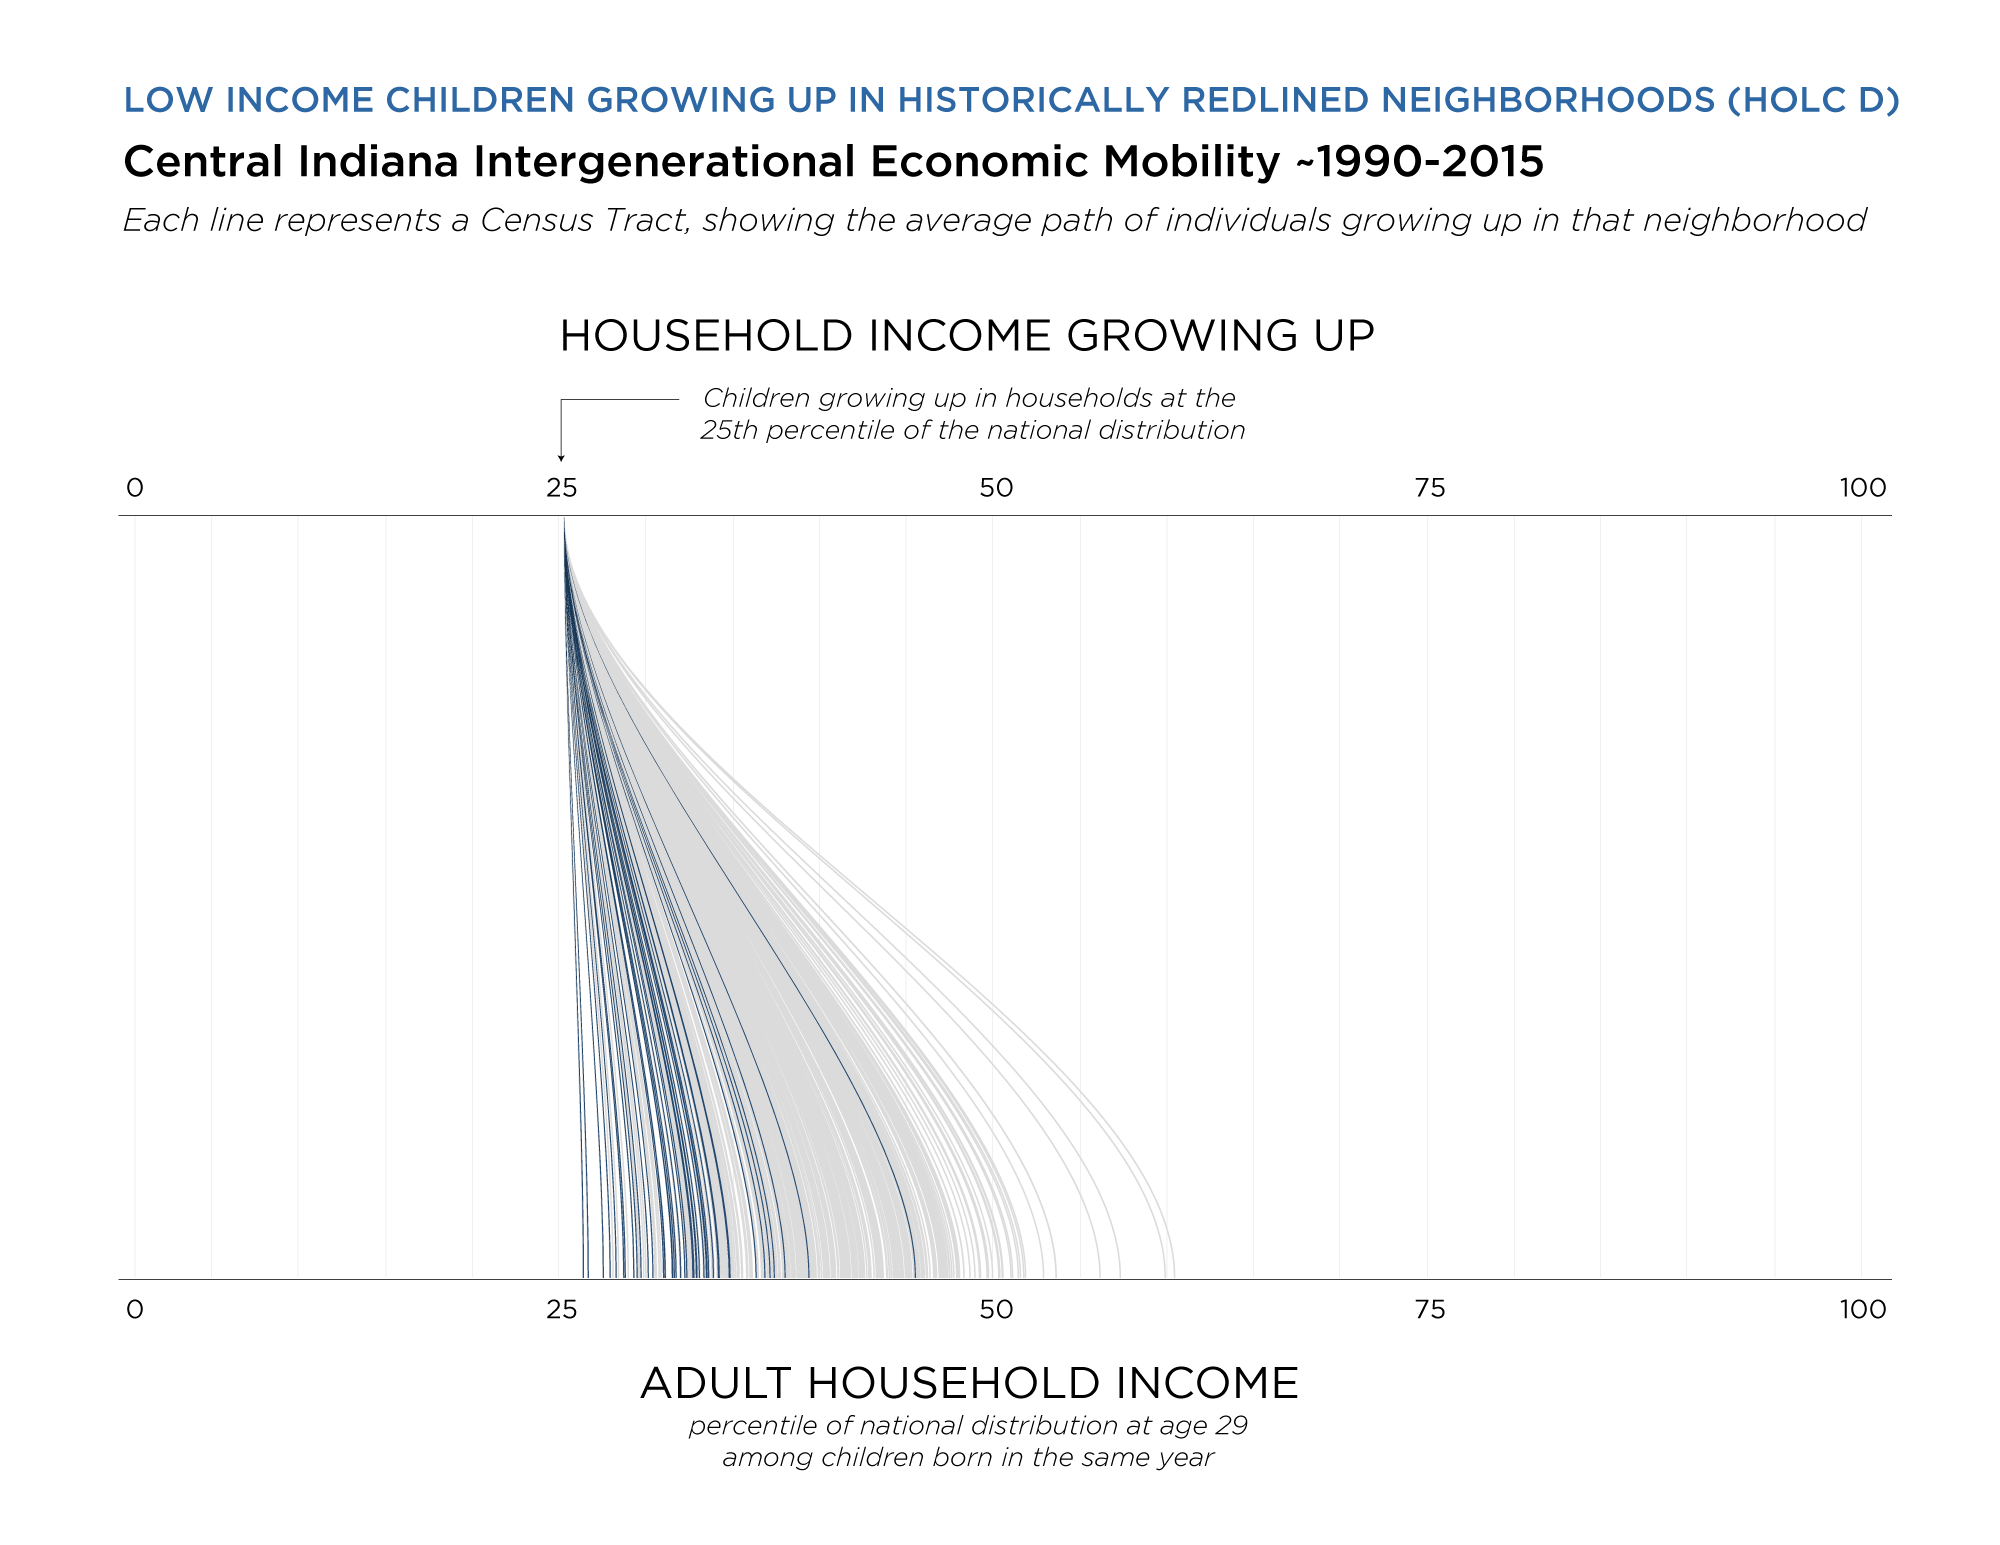
The highlighted neighborhoods are places where at least half of the census tract fell into a Redlined area, where federal housing authorities discouraged mortgage lending in Black communities. This occurred in the 1930s, but children growing up here in the 1980s have poorer outcomes than those growing up in other neighborhoods.
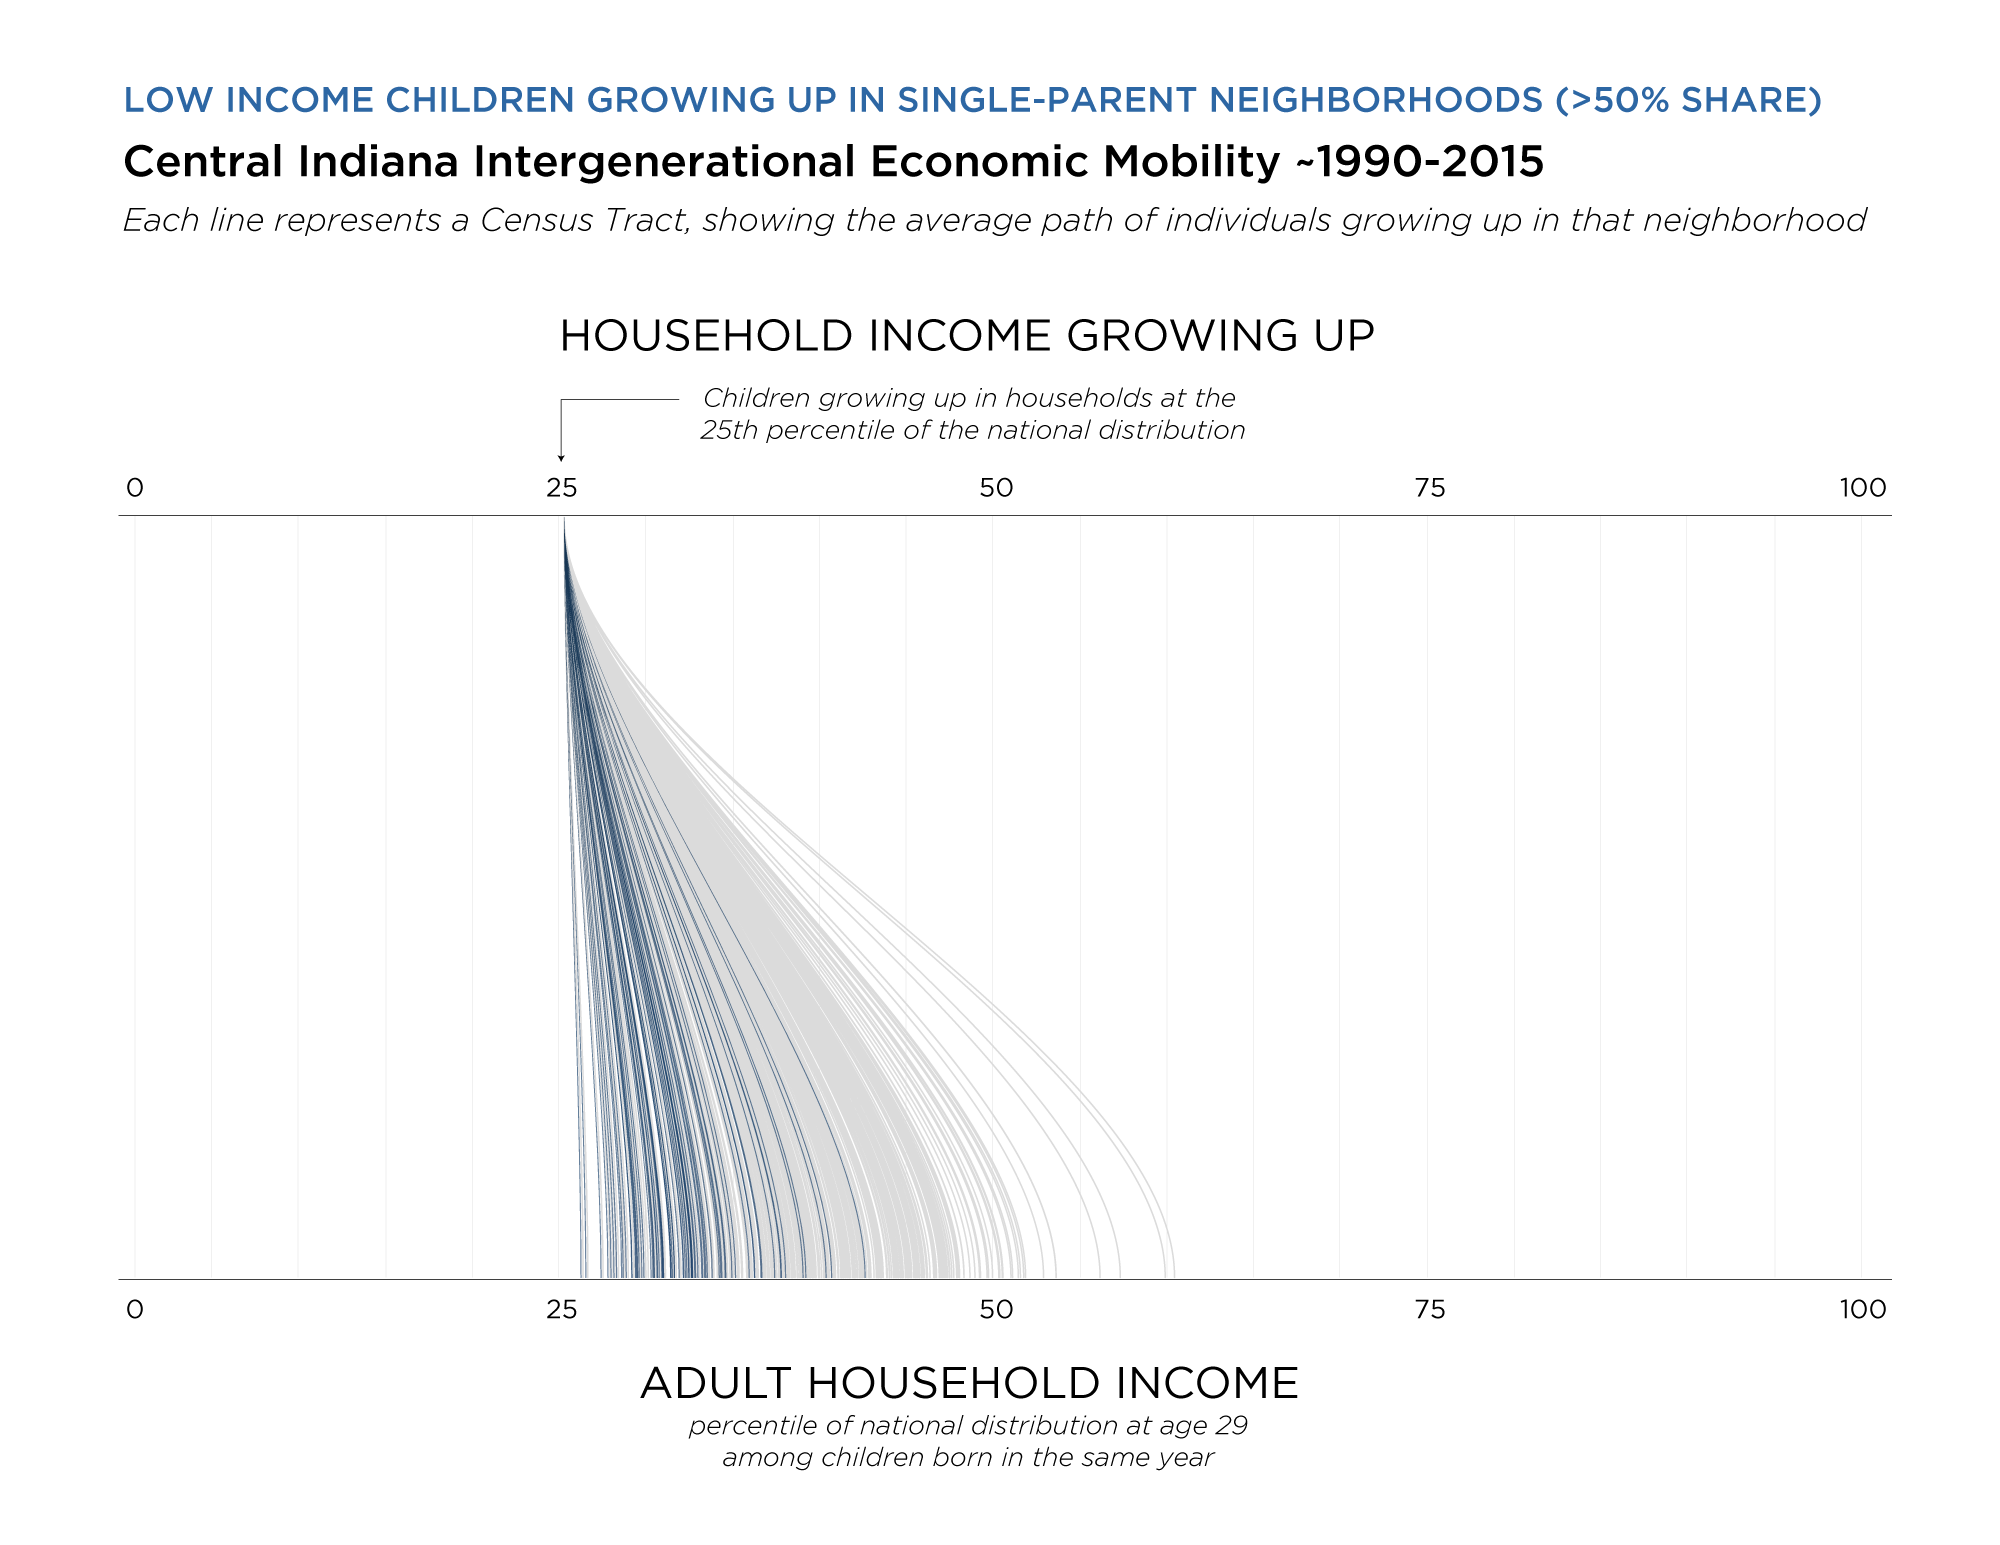
The highlighted neighborhoods are places where over half of households are single-parent families. These are mostly located in the Indianapolis urban core and Anderson.
High-opportunity neighborhoods with affordable housing
Among the high opportunity neighborhoods in the Indianapolis area, there are about 6,000 homes valued under $100,000 and 4,000 rentals with rents under $800 per month.5 In a few high-opportunity neighborhoods, a majority of homes are valued under $150,000. These are mostly located in the suburban edges of Marion County, including the northern edge of Pike Township, the southern edge of Franklin Township, and neighborhoods near Interstate 465 on Indianapolis’ west side.
Further research questions and opportunities
How can we improve our understanding what influences economic mobility at the neighborhood level?
To better explain the disparities we see across Indianapolis neighborhoods, we need to refine and localize the model, including more locally relevant definitions and new influencers or factors.
Refining definitions
At the neighborhood scale, many of these concepts are difficult to measure or need to be measured differently. For example, while a segregated city can be measured by examining if people of different races live in different geographic locations, this becomes more difficult at the neighborhood level. Are segregated neighborhoods places where one group is the overwhelming majority, or places where people of different races tend not to mix and integrate with each other within the neighborhood? Similarly, does income inequality make sense at the neighborhood scale?
Often, measures of segregation, inequality, and dissimilarity say as much about where boundaries are drawn as they do about social conditions in the area. A neighborhood with high income inequality according to the Gini index could “improve” its score if it were divided along a boundary that separates wealthy residents from low-income residents. But the underlying social conditions in the area would not have changed at all.
School quality is particularly difficult to measure at the census tract level. Chetty’s research used outcomes from school districts. In Indianapolis, students do not always live in the district where they attend school. This becomes particularly difficult at the census tract level. Students rarely live in the same census tract as their school. For example, among Indianapolis Public Schools and charter schools within Marion County, the median student lived three miles from their school during the 2019-2020 school year.6
Creating a statistical model
The patterns in the previous charts are clear, but these neighborhood characteristics overlap: income, race, family structure, and segregation have similar geographic patterns. A robust multilinear regression model could explain which factors, among these and a host of other variables, significantly contribute to economic mobility. Our preliminary version of this model suggests that segregation, both in terms of racial and educational (or class) segregation are important factors. Neighborhoods with high segregation tend to have low mobility. We will continue refining this model for future publication.
Such a model has two benefits. First, it helps us understand what factors influenced mobility in the 1980s, which, as we have learned, varies significantly between regions and cities. In Indianapolis specifically, perhaps a different set of indicators impact the outcomes of low-income children.
Second, this model could predict which neighborhoods have high or low opportunity for children being born now. As a rule, economic outcomes for today’s children cannot be measured until decades have passed. But with a predictive model, we could estimate what opportunity might look like in each tract and how that has changed since the 1980s. Are gentrified tracts near downtown predicted to perform differently than they once did? Are there changes to opportunity in the outlying counties as suburbanization has spread further into the exurbs?
Understanding impact on residents and communities
In addition to a quantitative approach to explaining mobility, qualitative research is needed to understand the experiences of people living and working in communities across Indianapolis. With the summary of mobility patterns in this report, we are well-positioned to engage residents, community leaders, and other stakeholders with questions about how their experiences match those outlined in this research. What barriers to mobility existed in their communities, and what is being done to address those?
Building Economic Opportunity: Approach and Solutions
Using these Data at the Neighborhood Level
To demonstrate how these data can be used at a local level, we explore two neighborhood areas northeast and northwest of downtown Indianapolis.
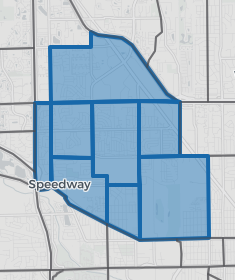
Northwest Area
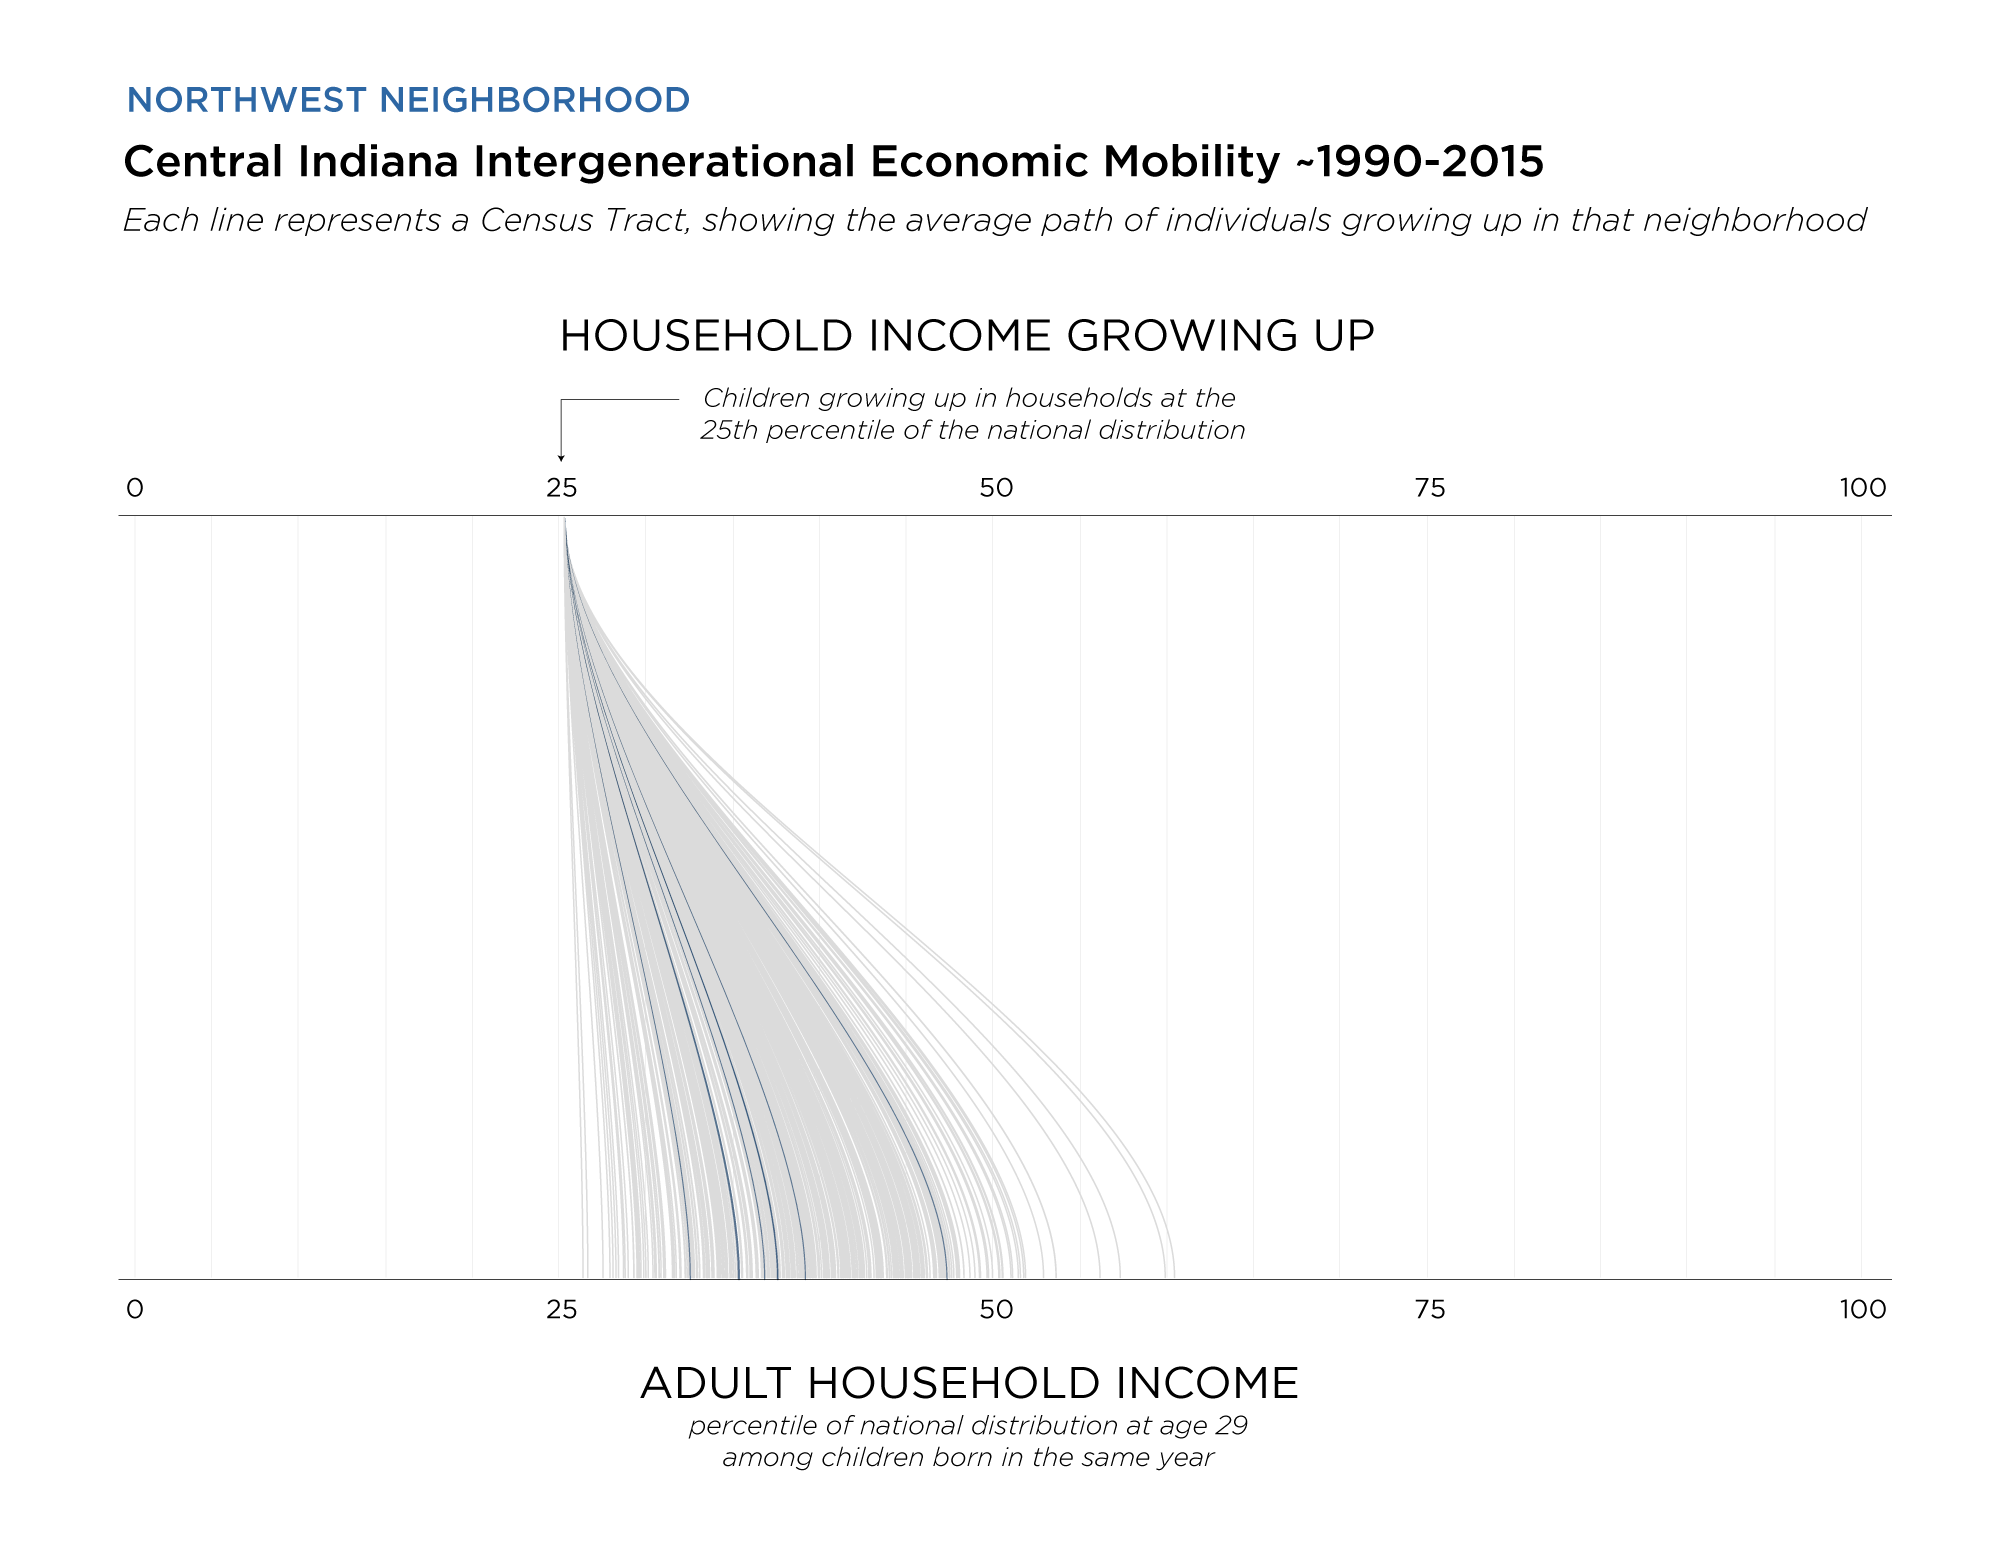
The northwest area is made up of seven census tracts between Tibbs Avenue, Interstates 65 and 465, and Crawfordsville Road. The average income for children born to low-income families in these tracts range from $22,000 to $37,000. Most tracts have outcomes at or below the city-wide average of $27,000.
One tract stands out as having increased economic mobility. For the southwestern tract that makes up a portion of speedway, the average low-income child earns $37,000 in adulthood. However, this difference is more about demographics than increased opportunity in the tract. Almost all children born in this tract during the study period were White, and White children earn more in adulthood on average.
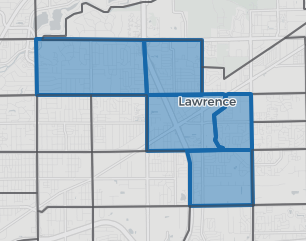
Northeast Area
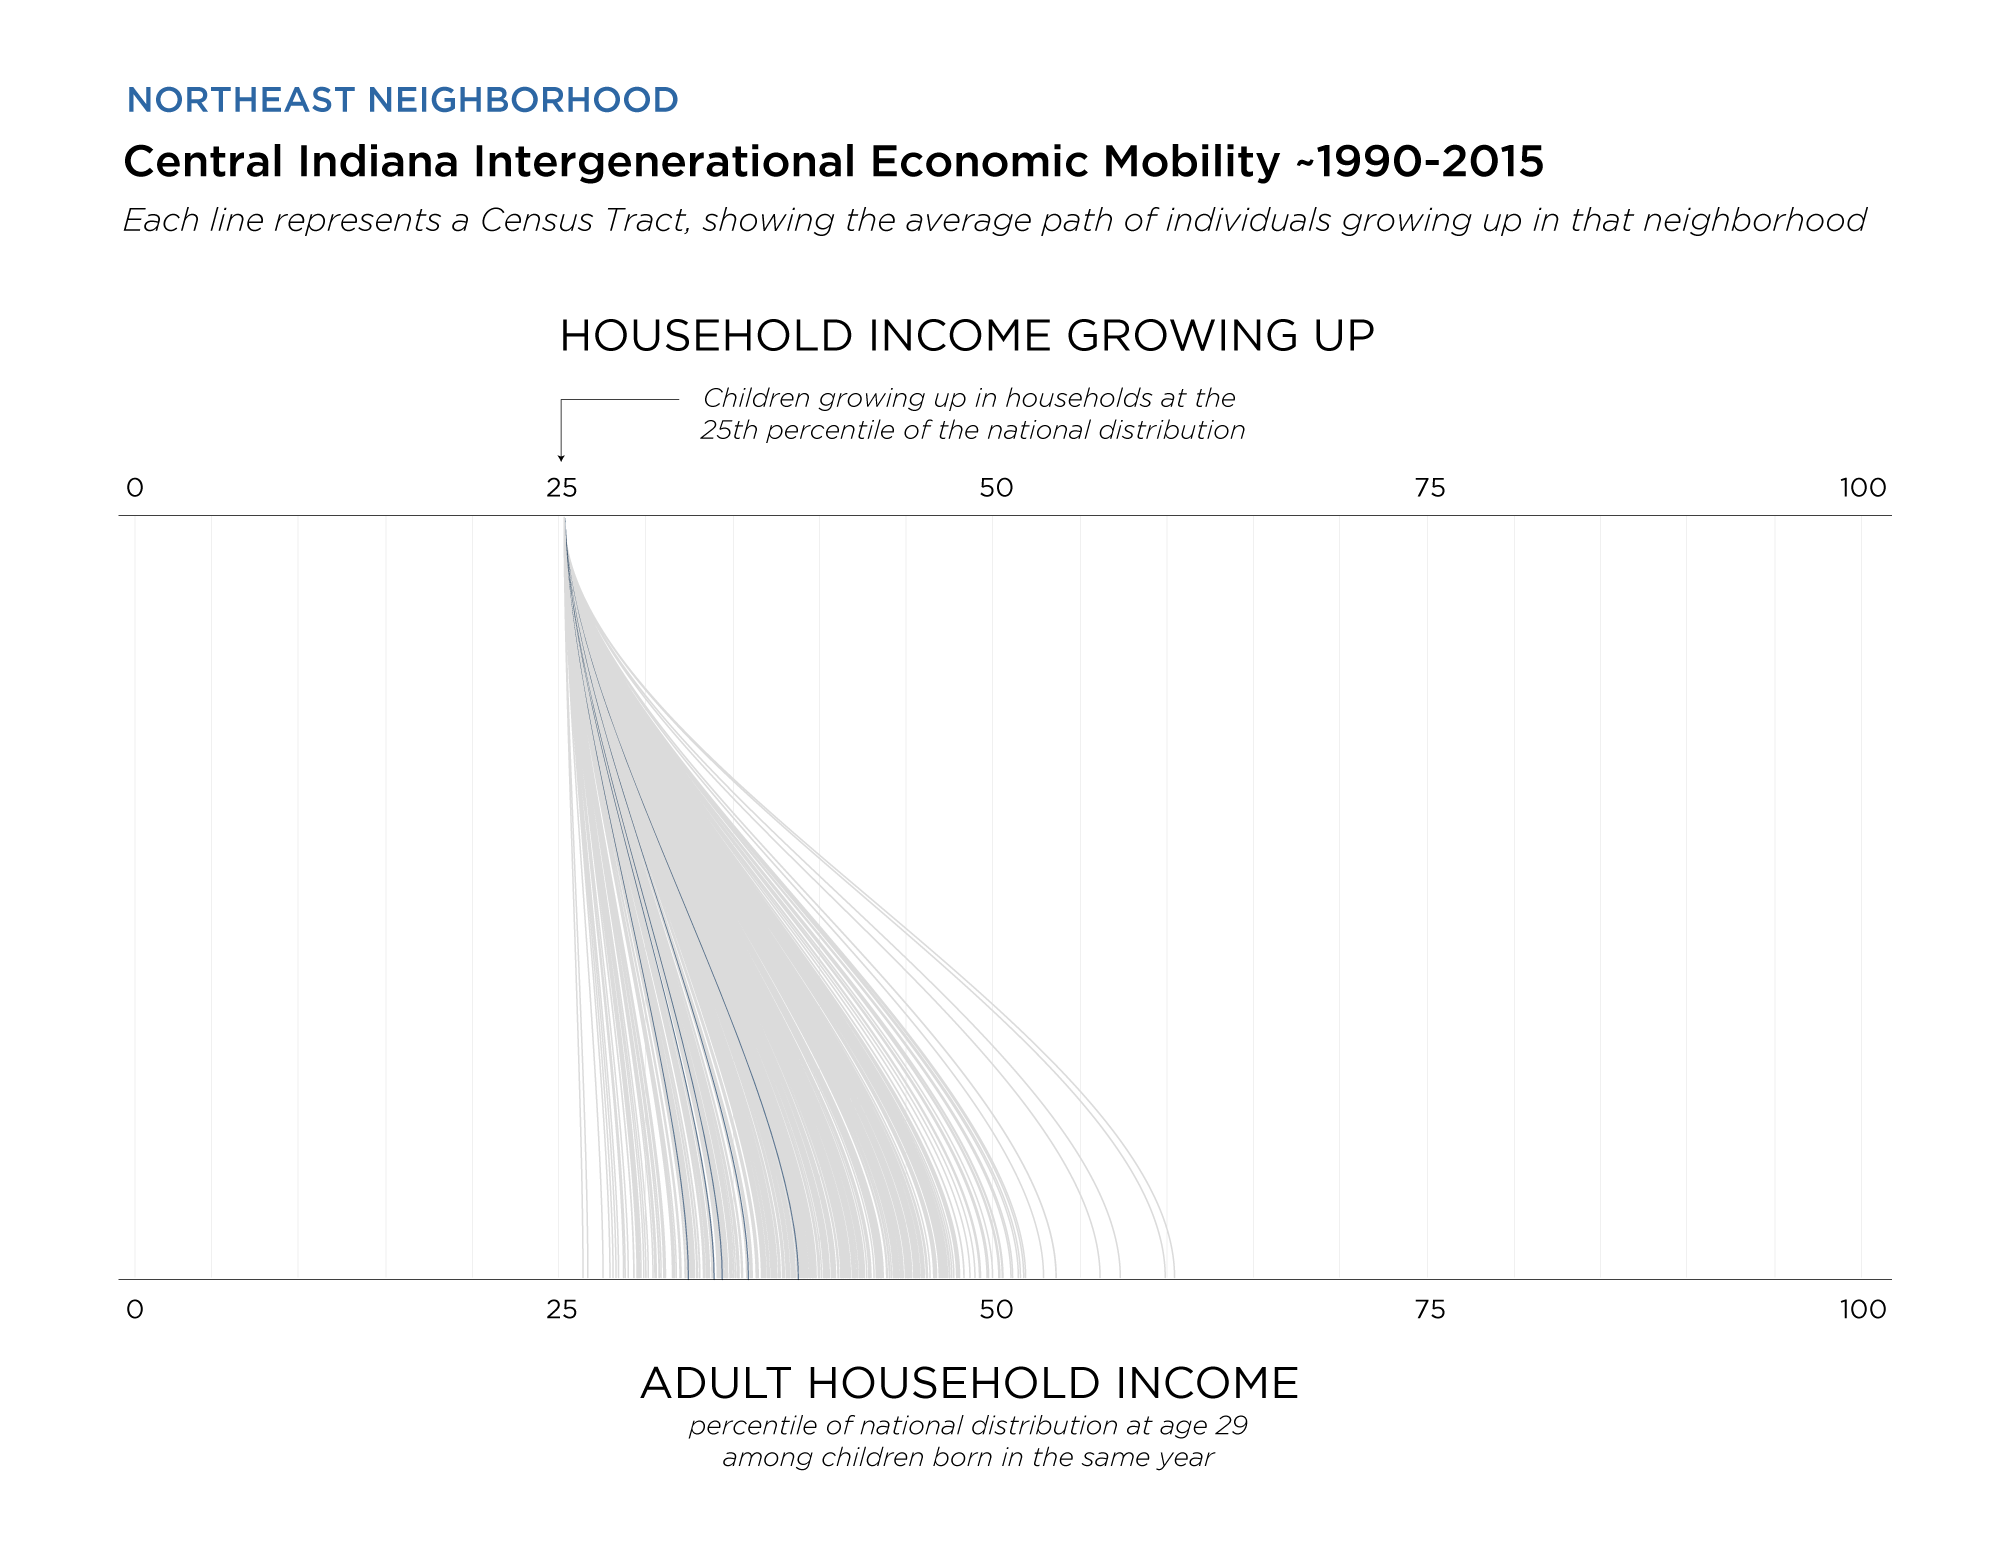
The northeast area is made up of five census tracts south of 56th Street and west of Post Road. The outcomes for low-income children here were at or below the city-wide average, ranging from $22,000 to $27,000. This is the same range of outcomes as the northeast area, with the exception of one tract in Speedway.
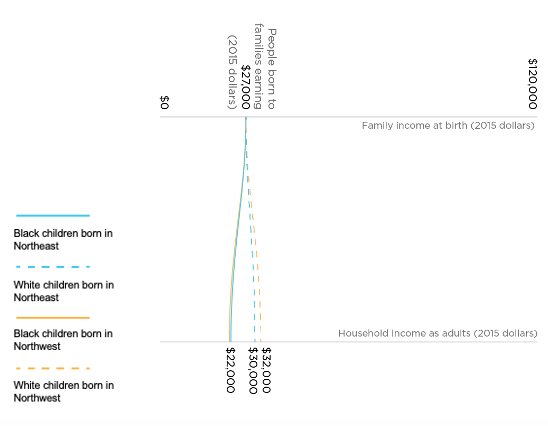
The chart below show how outcomes diverge for White and Black children born in these neighborhoods. On average, low-income White children from the northeast and northwest areas grew up to earn between $30,000 and $32,000. Black children grew up to earn $22,000. This racial opportunity gap is about the same size ($8,000-$10,000) in these neighborhoods as for the city overall ($9,000).
In light of this and other community level data, one organizer is working to strengthen asset-based community development in her neighborhood. Based on the importance of social capital, illustrated in this analysis of economic opportunity, she and her organization are championing the involvement of community members in the “ground floor” of community development efforts. By valuing feedback from neighbors, she ensures development efforts meet the needs of community members and the process itself builds ties between people that can lead to increased social capital.
Strengthening Communities from Within
Arguably, low-mobility communities may be able to be transformed into high-mobility communities, given increased levels of various forms of capital. One approach to understanding how this occurs is Endogenous Growth Theory (EGT),7 8 9 which is based on the idea that economic growth comes primarily from within any given community, and is dependent on four variables: physical capital, human capital, technology, and labor. Physical capital includes infrastructure, such as roads, transportation systems (available cars and/or public transportation), clean water, buildings, electrical service, and developed land. Human capital can be measured in terms of health and education—therefore improving health and education of neighborhood residents would improve the human capital in a community. Technology includes not only hardware, software, and connectivity, but also expert knowledge. Finally, labor is the availability of workers.
All forms of capital that EGT proposes can potentially be interventions by government or private (often nonprofit) sources. In the past, government policy restricted physical capital improvements in what are now lower-opportunity neighborhoods, resulting in poor roads with few streetlamps, non-potable water, and unsafe housing. Addressing the long-term effects of these government policies requires public re-investment in the infrastructure in these neighborhoods. Similarly, human capital disparities resulted when public money was diverted from lower-income communities into higher-income communities by restricting education funding to local property taxes, and inaccessibility of affordable, quality healthcare among lower-income communities. More equitable distribution of education funding and increased access to affordable health insurance and neighborhood primary care clinics are potential changes that could address human capital disparities, but are largely impacted by public policy. Finally, labor is negatively impacted in low-opportunity neighborhoods when adults in single-family homes face challenges maintaining employment and raising their children, and by the disproportionate number of community members who were previously incarcerated. Labor deficits also relate to human capital deficits, when high-paying employment opportunities are less available to people with disabilities and those without a high school education or equivalent.
Social capital can have as strong an impact on economic opportunity as all the endogenous growth variables combined. However, social capital is typically a development from the health of a given community, not necessarily a causal factor itself. Social capital can have various forms: bonding capital represents community trust and reciprocity among neighbors for sharing of needed resources; bridging capital represents how well connected a community is to other communities, particularly their ability to get or exchange resources from other communities; and linking capital represents how well connected a community is to centers of power, including experts, government workers, political operatives, and economic resources. Many segregated communities have reliable levels of bonding capital. Moving families out of low-opportunity, low-mobility communities can be harmful because it can lead to cutting off ties from social resources, such as bonding capital, which means families may not have access to help when they need it, such as an emergency babysitter, help with a car repair, or a ride to work. While typically lacking in communities that were previously stripped of resources, bridging and linking social capital can be remediated by intentionally investing in a community’s ability to access outside resources and increasing connections with, and trust in, public services.
Finally, the origin of many of the problems these communities face is early law and policy that stripped communities of color of all these forms of capital. From enslavement to segregation, and from continued segregation to diversion of public resources largely white, middle-class communities, the cost of those political choices continues to be felt throughout our society in terms of strained race relationships, and particularly in communities of color that continue to lack needed resources, limiting economic opportunity. To foster equitability of opportunity, sweeping investments must be made, targeting those communities that were previously disenfranchised by law. This includes directly addressing the permanent inequities impacting communities of color, including through reparations at an individual level, compensating those families who have not been able to build assets because law and policy from previous eras explicitly prevented their parents and grandparents from building assets.10 11 12 13 Further, multiple global and U.S. studies have shown that cash transfers to poor families have significant benefits not only to those families, but to the broader economic stability of that community, since that money is typically spent at local businesses.14 15 16 17 18
Not until a combination of neighborhood reinvestment and individual reparations to those harmed by past policies have been made, can we expect to see equalized economic opportunity in those neighborhoods Chetty measured as ‘low-mobility.’
The actors involved in building economic opportunity and those in the community they target with these initiatives may be understood in terms of a typology, in which public or private actors provide opportunities or resources on a community level, or directly to individuals who benefit from these.
Taking Action to Create Economic Opportunities
Addressing “wicked problems” like low economic opportunity in our communities does not have a simple solution. It requires careful planning that actively engages community members who are disproportionately impacted by these inequities. Additionally, such solutions require a variety of public and private (typically nonprofit) actors to pool their resources and expertise – building opportunity in our communities will not be as successful if these actors work in isolation from each other. These public-private partnerships have the potential to make a big impact when targeted at under-appreciated communities.
The actors involved in building economic opportunity and those in the community they target with these initiatives may be understood in terms of a typology, in which public or private actors provide opportunities or resources on a community level, or directly to individuals who benefit from these.

The resources that public and private actors provide may be coordinated across discrete initiatives to address community or individual needs or may be leveraged to fund and staff larger projects. Either way, strategic planning among these actors is important to maximize the potential benefit of community-based economic opportunity improvements.
One example of a public-private partnership formed to address the findings of the Opportunity Atlas is the Charlotte-Mecklenburg Leading on Opportunity initiative. 1 Upon learning that Charlotte was ranked last in economic mobility by the Opportunity Atlas, a group of public and private leaders in the Charlotte-Mecklenburg area convened as a task force in 2015 to create a comprehensive plan to address economic mobility inequities in their communities. The plan they developed accounts for the factors that lead to enduring conditions of economic inequity by creating an action plan that acknowledges both the enduring impact of segregation as well as the effects of social capital in communities. It focuses on determinants likely to impact economic opportunity, social mobility, and quality of life for individuals, including early childcare and education, college and career readiness, and child and family stability. Indicators at the individual, family, community, and system levels are used to assess progress related to opportunity determinants.
In Central Indiana, a variety of place-based initiatives have targeted communities with a history of disinvestment and economic disparities with the intention of improving the flow of economic resources to and within neighborhoods and their residents. Some of these initiatives include the resources and work of state and local government in combination with private resources, while others lie in the domain of the nonprofit sector. In the case of tax credit programs that provide capital for affordable multifamily housing (Low-Income Housing Tax Credit, LIHTC) or businesses in low-income areas (New Markets Tax Credit Program, NMTC), local and philanthropic resources are leveraged to meet requirements set by the federal government or increase competitiveness during the application process. Additionally, nonprofit community development financial institutions (Community Development Financial Institutions, CDFIs), such as Local Initiatives Support Corporation (LISC) Indianapolis, are uniquely poised to invest in communities by leveraging their own financial tools with aforementioned public resources or private resources to target low-income areas. LISC supports place-based development through its ongoing community-based Quality-of-Life and Great Places 2020 initiatives and continues to do so while encouraging expansion of inclusive entrepreneurship and job creation opportunities that harness the existing talent of participating communities.19
Public and private resources are also used to provide direct support to individuals, whether or not they remain in a community or move to another community. For instance, government cash assistance or payments that give families the opportunity to address their immediate needs and take advantage of other opportunities, or local credit unions that offer families and small businesses higher risk financing options at lower interest rates than commercial banks. Community programs, such as the Centers for Working Families, provide evidence-based financial and employment counseling to families working to achieve financial stability. These and other opportunities allow families the opportunity to achieve economic mobility within their own communities, encouraging economic investment, stabilization, and growth in these areas.
Limitations
- We selected the 25th percentile as the cohort to analyze. This excludes children who fall in even lower income brackets.
- Definitions of the factors are based on a national model and may need to be localized. Our next effort at a neighborhood-level model of opportunity will make progress on this front.
- The neighborhood outcomes we observe are averages. Within each neighborhood, there are many people with widely varying outcomes. There are limits to what we can learn by analyzing this aggregated data.
- Many of the factors that clearly correlate with poor economic outcomes are correlated with each other as well. It is difficult to determine causal relationships when that is the case. Again, a neighborhood-level model with make progress here.
- Chetty, Raj, John Friedman, Nathaniel Hendren, Maggie R. Jones, and Sonya Porter. Working Paper. “The Opportunity Atlas: Mapping the Childhood Roots of Social Mobility”.
- Chetty, et al. use commuting zones to define metropolitan areas. By this definition, the Indianapolis metropolitan area includes Marion County as well as Boone, Hamilton, Hendricks, Hancock, Morgan, Johnson, Shelby, Rush, and Brown counties.
- The 11-county Indianapolis Metropolitan Area is defined by the U.S. Census Bureau and includes Marion County as well as Boone, Hamilton, Madison, Putnam, Hendricks, Hancock, Morgan, Johnson, Shelby, and Brown counties.
- The median rent in the Indianapolis Metropolitan Area was $808 in 2015 according to information from American Community Survey via SAVI Community Information System (5-year average).
- American Community Survey 2019, 5-Year Average
- SAVI School Insights (https://profiles.savi.org/schoolinsights/)
- Akcigit, U, Nicholas, T. 2019. “History, microdata, endogenous growth.” Annual Review of Economics 11: 615-33.
- Osiobe, Ejiro. (2020). Human capital, capital stock formation, and economic growth. The Asian Institute of Research 3: 569-582.
- Whitelely, P. (2000). Economic growth and social capital. Political Studies 45: 443-466.
- Craemer, T. 2018. “International reparations for slavery and the slave trade.” Journal of Black Studies 49: 694-713.
- Darity, W, Frank, D. 2003. “The economics of reparations.” American Economic Review 93: 326-329.
- Neuborne, B. 2001. “Holocaust reparations litigation: Lessons for the slavery reparations movement.” NYU Annual Survey of American Law 58: 615-622.
- Williams, D, Collins, C. 2004. “Reparations: A viable strategy to address the enigma of African American health.” American Behavioral Scientist 47: 977-1000.
- Blattman, C, Fiala, N, Martinez, S. 2020. “The long-term impacts of grants on poverty.” American Economic Review: Insights 2: 287-304.
- Haushofer, Johannes and Jeremy Shapiro. 2016. “the short-term impact of unconditional cash transfers to the poor: Experimental evidence from kenya.” Quarterly Journal of Economics 131: 1973-2042.
- Pirog, M, Gerrish, E, Bullinger, L. 2017. “TANF and SNAP asset limits and the financial behavior of low-income households.” Pew Charitable Trusts
- Baker AC, Martin-West S, Samra S, Cusack M. 2020. “Mitigating loss of health insurance and means tested benefits in an unconditional cash transfer experiment: implementation lessons from Stockton’s guaranteed income pilot.” SSM-Popul. Health 11:100578.
- Sun, S, Huan, J, Hudson, D, Sherraden, M. 2021. “Cash transfers and health.” Annual Reviews of Public Health 42 (pre-publication)
- LISC Indy, https://www.lisc.org/indianapolis/what-we-do/opportunity/

