Health and Economic Impact of COVID-19 on Neighborhoods
COMMUNITY TRENDS | FALL 2020
Indianapolis is now at the intersection of a health pandemic, an economic crisis, and a racial equity crisis. Foundations, government, and nonprofits are making rapid decisions about where to allocate funding and resources to support those most impacted. Data is critical to identifying with precision where those resources are needed most to address the immediate needs of residents. It also can inform a longer-term community-wide strategy to address the underlying causes, disparities, and inequities and challenges we face as a community in the coming months and years.
In this report, we identify the areas in Indianapolis most affected by COVID-19, particularly those already disproportionately affected by poverty; define some of the challenges families in these areas are facing; and explore ways inequity plays a role in the risk, outcomes, and impact. We highlight trends across Indianapolis and focus on two areas in the county experiencing growing poverty and a disproportionate impact of COVID-19 – the Northeast and Northwest areas. First, we take a look at the timeline for COVID-19 in Indianapolis.
Timeline of COVID-19 in Indianapolis
The first confirmed COVID-19 case in Indiana was reported to be a Marion County resident. This individual tested positive on March 6, 2020. 1 As the number of cases in the state increased between March 10 and March 15, measures were taken to prevent the spread of the virus. Universities extended spring breaks and moved to online classes. The NBA, the NCAA, and other groups cancelled events. Libraries and other services closed. Local funders launched the Central Indiana COVID-19 Community Economic Relief Fund on March 13, 2020 to support human services organizations and the individuals and families they serve who are affected directly and indirectly by COVID-19.
On March 16, the death of a Marion County resident was reported as Indiana’s first death from COVID-19. In response to the growing crisis, Governor Eric Holcomb mandated bars, restaurants, and nightclubs to close their doors for in-person patronage. 2 After several days of quickly increasing positive cases, Gov. Holcomb issued a stay-at-home order effective March 25.3
Following a spike in the number of cases and number of deaths, Mayor Hogsett extended Marion County’s stay-at-home order to May 14 and eventually to May 15. 5
March 6, 2020
First confirmed case in Marion County
March 13, 2020
Funders launch Central Indiana COVID-19 Community Economic Relief Fund
March 27, 2020
CARES Act signed into law, including $600 per week in additional unemployment benefits
April 1, 2020
Indiana's statewide eviction moratorium begins
July 13, 2020
City of Indianapolis launches rental assistance program
July 27, 2020
$600 supplemental unemployment benefit expires
August 14, 2020
Statewide eviction moratorium expires
September 4, 2020
CDC begins federal eviction moratorium for qualifying households
December 31, 2020
Federal eviction moratorium set to expire
Over 1,200 cases were confirmed in Marion County during March and over 4,600 more cases throughout April. The rate of new cases began to slow to 3,900 in May and 1,600 in June. Indianapolis entered stage three of its reopening plan on June 1 and stage four on June 19. On July 1, Indiana moved to stage 4.5 of its reopening plan. However, since August, there have been 3,100-4,200 new cases each month. In early August, 7.7 percent of patients tested were confirmed positive, which was higher than the target of 5 percent. By early September this had fallen to 5.3 percent, and by September 27 the seven-day positivity rate was 4.4 percent.6 7
On July 13, the State of Indiana and the City of Indianapolis launched a rental assistance program.8 Within Marion County, this program provided rent for three months, up to the amount that the Department of Housing and Urban Development declared to be fair market rent in Indianapolis.9 The City’s rental assistance program application was closed two days later after receiving over 10,000 applications. On September 26, the State of Indiana moves into the final stage of the reopening plan, stage five, with three counties, including Marion County, retaining some higher restrictions.
Many of the local and federal funding mechanisms and policies put in place to provide relief to families during the pandemic have expired or soon will. The data in this report identify which communities have high utilization rates for those resources, already lack the resilience to recover from the health and economic impacts, and may experience greater challenges as a result.
Measuring the impact of the pandemic on Indianapolis neighborhoods: COVID-19 Impact Index
In addition to the thousands of Marion County residents who have been hospitalized10 and hundreds who have died, COVID-19 resulted in many business closures11 12, leaving thousands unemployed or underemployed.13 This effects, among other things, the ability of individuals to buy food, pay for housing and utilities, access healthcare, and donate time and money to non-profits.14 The effect often is bigger for those at or near poverty. We developed an index to understand how these impacts vary by neighborhood in Indianapolis.
The SAVI COVID-19 Impact Index measures the layering effects of pre-existing vulnerabilities, health, and economic impacts of COVID-19 on residents in each ZIP code in Marion County. This is not a predictive measure, rather, it measures the known or suspected impact of COVID-19 on a given geographic area.
There are four primary components of this index. Two measure vulnerability: socioeconomic vulnerability and health vulnerability. Two measure impact: COVID-19 rates and economic impact. Each component is described briefly below followed by the final index scores.
Vulnerability
Weighted as 1/3 of score
Socioeconomic Vulnerability
13 measures of social vulnerability
Health Vulnerability
Seven measures of underlying health conditions and access to healthcare
Impact
Weighted as 2/3 of score
Health Impact
- COVID-19 cases per 1,000 residents
Economic Impact
- Unemployment claims (March-August)
- Rental assistance applications
- Increase in 2-1-1 calls between Q1 2020 and Q2 2020
Socioeconomic Vulnerability
This component includes thirteen measures. Together, these describe the community’s resilience to major stressors such as a health pandemic. Communities that score high on this measure struggle with high poverty rates, low education levels, language barriers, and/or lack of transportation access, for example, and may find it more challenging to respond to and recover from the effects of COVID-19, economically and otherwise. See the complete list in chart above.
This measure is adapted from the CDC Social Vulnerability Index.15
Health Vulnerability
Several pre-existing health conditions (co-morbidities) put individuals at a higher risk for severe illness if they contract COVID-19. The health vulnerability score includes the rate of the population who has one of these co-morbidities. Using evidence cited from the Center for Disease Control16 and local findings from Regenstrief Institute’s analysis17 of hospitalization rates for patients with COVID-19, we included the following co-morbidities in the health vulnerability index: diabetes, COPD, kidney disease, heart disease, cancer, and obesity. ZIP codes with higher rates of these conditions are given a higher vulnerability score.
This component also includes the percent who lack of health insurance. Research shows that “uninsured adults have less access to recommended care, receive poorer quality of care, and experience worse health outcomes than insured adults do.”18 19 While testing is available for free for the uninsured, treatment options may not be. Furthermore, many uninsured adults work in jobs that may increase their risk of exposure to COVID-19.20
Health Impact: COVID-19 Rates
Using data obtained from our partners at the Marion County Public Health Department, we calculated a rate of confirmed positive cases per 1,000 population. While this does not provide data about the severity of the cases, layered with the health vulnerability measure, this can tell us which communities are more likely to have residents who experience severe illnesses, expose others to the virus, and strain the healthcare system in that community.
Long-term Care Facilities
COVID-19 has effected residents of long-term care (LTC) facilities at a high rate in many cases. The COVID-19 rate in our model includes positive cases at LTC facilities, so it is important to know where the LTC facilities are located as it could influence your interpretation of the rate. Using a combination of data sources, we were able to estimate the number of positive cases at each facility and create a map showing the COVID-19 rates and the reported cases at each LTC facility. 1
Economic Impact
The economic impact component focuses on the loss of income and jobs during the COVID-19 pandemic. It takes into account residents’ unemployment claims between March and August 2020, the number of applications to the Indy Rental Assistance Program, and the change in the volume of calls to 2-1-1 for help such as emergency food, housing, and utility assistance.
Final COVID-19 Impact Score
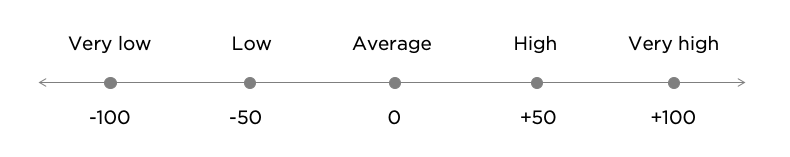
The final COVID-19 Impact Score measures how far each ZIP code is from the county average on these measures.
- An impact score of zero is the average.
- A ZIP code with a score below zero indicates that the impact of COVID-19 is lower in that ZIP code than the average ZIP code. A score lower than -100 means that it is much lower than the average. 1
- A ZIP code with a score higher than zero is impacted more than the average ZIP code. A score higher than 100 is considered much higher than the average.
In general, those ZIP codes located outside the I-465 belt have lower impact scores, with the exception of the Far East side of Indianapolis. Two in particular have scores far below the average: 46113 scores lowest with -155 and includes Camby in the southwest corner of the county, and 46259 in the southeast corner scores -115.
Those areas most impacted by COVID-19 tend to fall within the beltway, particularly north of US40/Washington Street. Two ZIP codes score much higher than average: 46222 scores 124 and includes Near West and Eagledale areas; 46218 scores highest with 158 and includes the Martindale-Brightwood area. See map below.
We excluded 46204 from this analysis. That ZIP code is located downtown and contains both Marion County jails. The cases from the jails alone (263 confirmed cases, according to the Indianapolis Star) lead to a rate of over 30 confirmed cases per 1,000 residents. In total, this ZIP code had over 60 confirmed cases per 1,000 residents, far higher than any other ZIP code. This is critically important, and understanding the severe impact of COVID-19 on our city’s incarcerated population is an important concern. However, we excluded the ZIP code from this analysis to reveal more differences between neighborhoods. Otherwise, all neighborhoods appear to have a much lower impact relative to 46204.
SAVI COVID-19 Impact Index Map
There are four primary components of this index. Two measure vulnerability: socioeconomic and health vulnerability. Two measure impact: COVID-19 rates and economic impact.
Click on the map to select a ZIP code and view its SAVI COVID-19 Impact Score and the component scores. Click on a component in the legend on the left to view and map the detailed variables that make up that component.
Les médicaments conçus pour s’attaquer au problème de l’impuissance masculine ont en effet fait de grands progrès ces derniers temps. Selon grandespilules.fr, les hommes qui utilisent le Viagra pour traiter les troubles de l’érection sont plus à l’aise et plus confiants dans leurs prouesses sexuelles.
The most severe health impacts have fallen mostly Downtown and on the west and northwest sides of Indianapolis. The downtown ZIP code 46202 includes IUPUI and several hospitals as well as parts of the Near Northside and Holy Cross. The confirmed cases for residents of this area total 26.9 for every 1,000 people. (The average rate for a ZIP code is 17.8.) In 46222, which stretches from the Near Westside to Eagledale in the northwest, there are 23.8 cases per 1,000 residents. Further west, 46224 has a rate nearly as high as downtown (26.0). This ZIP code includes most of Speedway.
The area near International Marketplace (ZIP code 46224) has a rate of 22.6 cases per 1,000 residents. On the north side of Indianapolis, 46260 has a rate of 22.9 cases per 1,000 residents. This mixed-income ZIP code includes parts of Meridian Hills, Crooked Creek, and Greenbriar. While it experienced high health impacts, this ZIP code experienced average economic impacts and has average health and socioeconomic vulnerability scores.
Economic impact tends to be highest in the ZIP codes adjacent to Downtown, while for residents of Downtown itself, the economic impact appears to have been average. In 46218, the economic impact score is 252, higher than any other ZIP code. This area, which contains Martindale Brightwood, had 127.6 unemployment claims each week between March and August for every 1,000 people in the labor force. This is twice the average rate for a ZIP code. Between the first and second quarter of 2020, 46218 also had 30 more 2-1-1 calls per 1,000 residents, three times the average ZIP code. And over 10 percent of renter households applied for rental assistance. Rental assistance applications were also high on the Far Eastside. Unemployment claims were highest east and northeast of Downtown. While they were not as high in areas northwest of Downtown, the presence of many non-English speakers and undocumented workers suggests that this may be because of issues in accessing unemployment insurance rather than a true reflection of economic stability.
Health vulnerability is highest in the Near Westside, Near Eastside, and eastside ZIP codes 46218 and 46226. In 46218, all conditions we included are far above average, with the exception of cancer. An estimated 21 percent of adults have diabetes and 12 percent have COPD. One-in-five people do not have health insurance. In 46222, on the Near Westside, 15 percent of adults have diabetes, and in the Near Eastside ZIP code of 46201, 14 percent have diabetes. COPD, which is present in one-eighth of Hoosiers hospitalized for COVID-19, is estimated to be highest east, west, and south of Downtown. In 46203, which stretches from Fountain Square east to Shadeland Avenue, an estimated 11 percent of adults have COPD. 46241, including Stout Field and the airport, has a similarly high rate. Health insurance tends to be lacking in areas northwest, northeast, and south of Downtown. In 46255, which includes the Old Southside and areas west of Garfield Park, nearly 18 percent of residents lack health insurance.
ZIP code 46218 had the highest level of socioeconomic vulnerability, but areas on the east, west, and northeast sides of Indianapolis also had elevated scores. In 46218, one third of residents are in poverty, almost one fourth have a disability, and the average unemployment rate between 2014 and 2018 was 15.4 percent. In 46224, the high socioeconomic vulnerability score of 86 is driven by, among other things, a large share of non-English speakers and crowded housing. Six percent of households have more than one occupant per room, which is three times higher than the average ZIP code. Also, six percent of adults do not speak English proficiently (twice the average ZIP code).

High-impact areas (+50 or more)
Medium-impact areas (-49 to +49)
Low-impact areas (-50 or less)
Percent of residents who are people of color in ZIP codes where Covid-19 impact score is...
Percent of residents living in poverty in ZIP codes where Covid-19 impact score is...
Percent of residents with a disability in ZIP codes where Covid-19 impact score is...
Percent of residents age 25+ without high school diploma in ZIP codes where Covid-19 impact score is...
Percent of residents under age 18 in ZIP codes where Covid-19 impact score is...
Impact of COVID-19 accentuates pre-existing inequities
We divided all of the Marion County ZIP codes into three groups based on low, medium, and high scores (<50, -49 to 49, and >=50, respectively) according to the COVID-19 Impact Index. We then aggregated selected socioeconomic and demographic variables for each of the three classes. ZIP codes with high impact scores tended to have more residents of color, more poverty, lower educational rates, and higher rates of disability.
In those areas with low impact scores, 22 percent of the population are people of color. This increases to 39 percent in medium-impact areas and 67 percent for high-impact areas.
This tracks with the increased infection and hospitalization rates among people of color, both nationally and locally. A previous SAVI report examined this in detail, drawing the connection between health vulnerability and economic vulnerability faced by people of color. Since then, many communities of color, especially predominantly black neighborhoods on the east side of Indianapolis, have struggled with the most severe economic impacts, on top of above-average levels of COVID-19.
Other demographic variables we examined did not show as strong a relationship. Gender and senior population show no differences based on impact scores, while high-impact areas tend to have a slightly larger proportion of children under age 18.
There are stark socioeconomic differences between high-impact and low-impact areas. Poverty rates were much higher in high-impact areas (27 percent) as compared to low-impact areas (7 percent). Medium-impact areas have an average poverty rate of 19 percent, which is equal to Marion County’s overall poverty rate. Educational attainment is closely tied to poverty, and a larger proportion of the population 25+ has no high school diploma in high-impact areas (19 percent) compared to low-impact areas (6 percent).
People with disabilities are more likely to live in high-impact areas
High-impact areas have a higher proportion of people living with a disability, though this disparity is less pronounced compared to poverty and education. Low-impact areas have 10 percent of the population living with a disability compared to 15 percent in high-impact areas.
According to the Centers for Disease Control and Prevention, “Adults with disabilities are three times more likely than adults without disabilities to have heart disease, stroke, diabetes, or cancer than adults without disabilities.” 1 These underlying conditions are known to be some of the most common among patients who have been hospitalized for COVID-19, and these conditions are included in the health vulnerability component of our index. 1 The socioeconomic vulnerability component includes a community measure of the percent of the population who have disabilities.
People with disabilities may have unique challenges during this pandemic. A report from Johns Hopkins University outlines how those with disabilities may have a harder time accessing up-to-date information, abiding by public health guidelines, and accessing healthcare. These individuals may be more likely to struggle financially, as only one-in-five were employed even before the pandemic. 1

Northwest Area suffers from high rate of Coronavirus cases, high socioeconomic vulnerability
In three ZIP codes northwest of Indianapolis, the rate of positive cases is higher than almost any other area in Marion County. On average, the three ZIP codes (46222, 46224, and 46254) have 23.7 cases per 1,000 residents, higher than Marion County’s rate of 22.0. Only two ZIP codes downtown (46204, where both Marion County jails are located, and 46202, where IUPUI is located) have a higher rate of infection.
This high rate of COVID-19 cases is one factor that leads to an overall impact score of 90. Only the 46218 ZIP code (the Martindale Brightwood area) has a higher impact score than this area.
Since June 16, the earliest ZIP code case data available, the Northwest area has consistently had an infection rate higher than Marion County’s. Weekly ZIP code data is available from July 13, allowing a comparison of the rate of new cases between different areas. The Northwest area has generally gained new cases at a slower rate than the county since mid-July. As a result, the gap has shrunk between the case rate in the Northwest area and the county. In mid-June, this area had 20.4% more cases per capita than the county. As of September 21, that difference has fallen to 7.4%.
This impact is layered on preexisting socioeconomic conditions that put many households at risk of financial instability. The Northwest area scores 71 on the socioeconomic vulnerability component of the index. This is driven by the presence of several vulnerable groups, including a large proportion of people who are not proficient in English, high poverty rates, and a large proportion of single-parent households. The 46222 ZIP code (including Near West and Eagledale areas) also has rates of disability that are higher than average.
Parts of these three ZIP codes fall into areas that a 2019 SAVI report identified as experiencing a steep increase in the number and percentage of residents living in poverty.
Overall Index Score
90
71
Health Vulnerability
44
Health Impact
168
46


Tracking COVID-19 Cases
Cases per 1,000 residents
New cases per week per 1,000 residents
Northeast area, with health vulnerabilities already present, hit hard by economic impact
The COVID-19 impact score in the Northeast area, defined as ZIP codes 46226 and 46235, was 79. In the Northeast area, the COVID-19 case rate is lower than the county average. Still, 1,567 residents have had confirmed positive cases as of September 21.
The economic crisis, rather than the virus itself, has had the biggest impact on this area. Unemployment claims, 2-1-1 calls for help, and rental assistance applications are all well above average in these ZIP codes. In the average Marion County ZIP code, there were 64 unemployment claims per week for every 1,000 people in the labor force. In the Northeast area, there were 82 claims per week. For the average ZIP code, 2-1-1 calls increased by nine calls per 1,000 residents between the first and second quarter of 2020. In the Northeast area, calls for help increased by 16 per 1,000 residents. In the average ZIP code, 5.7 percent of renters applied for rental assistance, but in the Northeast area, 8.4 percent of renters applied.
The health vulnerability in the Northeast area is above average. This includes disease rates for underlying conditions that are known to correlate with COVID-19 hospitalizations.21 This high score is driven by high rates of obesity, kidney disease, high blood pressure, and diabetes. These rates are from mathematical models combining survey data and demographics to generate neighborhood-level estimates of health indicators. These are not from clinical data. However, the estimates suggest that 15 percent of residents have diabetes (11 percent in average ZIP code), 3.7 percent have kidney disease (3.1 percent average), and 44 percent are obese (35 percent average).
Socioeconomic vulnerability is elevated in the Northeast area, where poverty rates and unemployment rates have long been high. There is also a higher than average proportion of youth and people of color in this area. The 46226 ZIP code has an above-average share of residents with a disability, which also contributes to its socioeconomic vulnerability.
Overall Index Score
79
66
Health Vulnerability
85
Health Impact
64
97


Tracking COVID-19 Cases
Cases per 1,000 residents
New cases per week per 1,000 residents
Future impacts: a potential eviction crisis
While the SAVI COVID-19 Impact Index just uses existing impact and known risks to analyze impact to date, it is also important to look at possible upcoming effects of the COVID-19. As protective measures such as unemployment insurance payments and eviction moratoriums expire, economic impacts in neighborhoods could lead to an unparalleled number of evictions.
Between February and April of 2020, Indiana lost 436,000 jobs, driving the unemployment rate from 3.1% to 17.5%. While the state gained back 217,000 jobs by June, unemployment remained extremely high at 11.2%. (Bureau of Labor Statistics). To estimate the impact this increase in unemployment will have on the eviction rate in Marion County, we modeled how variables such as demographics, long-term economic conditions, and unemployment statistics could explain the variation in the 2016 formal evictions rate. We then used current values for those variables to predict the 2020 formal evictions rate. The result is three models that are effective at estimating 2016 eviction rates and therefore may be useful in predicting 2020 eviction rates. These models show that formal evictions in Marion County may increase from 12,647 in 2016 to as much as 34,000 in 2020. This is an increase from a 7 percent eviction rate to a 20 percent eviction rate.
We developed three models that each produce different results. Two predict a substantial increase in evictions, while one does not. Model A, which assumed that age and income where the most important factors in predicting evictions, predicts that the Marion County eviction rate would be 20 percent, equivalent to 34,000 renters being formally evicted. Model B, which assumed that eviction on neighboring tract would affect a neighborhood’s evictions, predicts that the number and share of evictions will be similar to those of 2016. And Model C, which assumed that average income in the neighborhood in the previous year was the most important factor in predicting evictions, predicts an increase in eviction rates to 16 percent, equivalent to 28,000 renters being formally evicted.
While one of the three models does not predict an increase in evictions, the other two do, to as much as almost tripling the rate of evictions in 2016. These last two models seem to be in line with other nationwide estimates.22
Turning Data into Action
Here are just a few ways to make this information actionable.
If you are a funder: The index tells us which communities have been most impacted by COVID-19. This can inform where to deploy resources such as grant funding, resulting in equitable funding decisions, putting the funding in areas that are disproportionately impacted and may need additional support.
If you are responsible for administering aid for housing or homelessness: Rental assistance application data and our models for potential evictions can inform where resources are targeted. A comparison of socioeconomic vulnerability and rental assistance applications can reveal where there may be too little uptake in the program compared to the amount of need.
If you are on the City-County Council: Similar to funders, use this index to see how multiple dimensions of this crisis intersect and facilitate the equitable distribution of resources.
If you are a grant writer responsible for seeking funding for your program or organization, use these data to support your grant application.
You can dig into the details of the index to identify the types of needs that are greatest in your community. Digging into the 2-1-1 call data, for example, you can see if the calls for help have been focused on housing, food, mental health, etc.
About the Data
Known limitations of the data:
- The COVID-19 rate includes positive cases for residents living in group quarters, such as long-term care facilities, jails, and universities. This can lead to a large number of cases in a ZIP code with a large group quarters population.
- ZIP Code 46204 (downtown Indianapolis) was excluded from our analysis due to a large number of COVID-19 cases in the Marion County jail system.
- COVID-19 rates are calculated as the number of positive cases per 1,000 population. The number of tests given in an area is unknown at geographies smaller than county, so the positivity rate is unknown.
- Co-morbidity data is collected at the census tract-level for all areas in Marion County except for tracts around Speedway, Lawrence, and Beech Grove. Polis developed estimates for these areas using a space pattern mining tool from ESRI mapping software which estimates values of missing census tracts based on known values of nearby or adjacent census tracts. For more information see https://pro.arcgis.com/en/pro-app/tool-reference/space-time-pattern-mining/learnmorefillmissingvalues.htm.
- ZIP codes – the data cover only Marion County residents. Though the ZIP code boundaries extend beyond the border of the county in a few instances, the data do not include counts for those counties.
Acknowledgements
The authors would like to thank the following individuals and organizations for their support of this researchKaren Comer, Director, Collaborative Research and Community Health Informatics, The Polis Center at IUPUI. We appreciate the feedback, guidance, and public health expertise she provided.
- Marion County Public Health Department is a long-time supporter and data partner of SAVI. They provided detailed data about COVID-19 cases in Marion County.
- John Boner Neighborhood Centers and the City of Indianapolis Department of Public Health and Safety provided data about rental assistance applications.
- Indiana Department of Workforce Development has provided critical unemployment claims data to us throughout the course of this pandemic and economic crisis.
- WFYI is a partner of the SAVI Talks series and our community-based research. We appreciate their efforts to host these community conversations and share them broadly.
- Partial funding for this SAVI Talks was provided by WFYI’s partnership in the Move to Include initiative, with funding provided by the Corporation for Public Broadcasting.
- Indiana State Department of Health
- Indiana reports first COVID-19 death, governor orders bars and restaurants to close, Natalie Daoud, Fox19, March 16, 2020
- ”Governor Orders Hoosiers to Stay Home in Fight Against COVID-19”, Indiana State Department of Health
- ”Mayor Hogsett extends Marion County stay-at-home order until May 1, orders golf courses closed beginning April 3”, CBS5, April 1, 2020.
- ”What you should know about Indianapolis’ stay-at-home order, now extended through May 15”, Ethan May, Indianapolis Star, April 30, 2020.
- ”Marion County Officials Report Improved Coronavirus Numbers”, Elizabeth DePompei, Indianapolis Star, September 3, 2020.
- Novel Coronavirus Dashboard, Indiana State Department of Health
- ”Hoosiers can now apply for rental assistance”, Brandon Smith, WFYI, July 13, 2020
- Eligibility FAQ, City of Indianapolis
- https://www.wrtv.com/news/coronavirus/covid-19-economic-impact/indianapolis-restaurants-and-businesses-permanently-closed-due-to-covid-19
- https://www.wrtv.com/news/coronavirus/covid-19-economic-impact/lobbying-group-two-thirds-of-indianas-hotels-face-closure
- https://www.wrtv.com/news/coronavirus/covid-19-economic-impact/41-of-indiana-restaurants-unlikely-to-still-be-open-in-six-months-survey-finds
- https://iu.maps.arcgis.com/apps/opsdashboard/index.html#/f8af31d01c38447e9ade008b0525168c
- https://nonprofit.indiana.edu/doc/publications/covid-19-impact.pdf
- CDC Social Vulnerability Index uses 15 U.S. census variables to help local officials identify communities that may need support before, during, or after disasters, including health pandemics: https://www.atsdr.cdc.gov/placeandhealth/svi/index.html
- Centers for Disease Control As of Oct 5, 2020, there is strong or consistent evidence of increased risk for severe illness with COVID-19 and the following pre-existing conditions: serious heart conditions, cancer, chronic kidney disease, COPD, obesity, Sickle cell disease, Solid organ transplantation, Type 2 diabetes mellitus.
- https://www.regenstrief.org/covid-dashboard/ As of Oct 5, 2020, the top six co-morbidities for hospitalized patients include: hypertension, diabetes mellitus, COPD, kidney disease, congestive heart failure, and cancer. We did not include hypertension in our analysis because CDC does not find strong evidence of the connection. Obesity is not included in the RI dashboard as a comorbidity due to data quality concerns.
- McWilliams, J Michael. Health Consequences of Uninsurance among Adults in the United States: Recent Evidence and Implications. June 2009. https://www.ncbi.nlm.nih.gov/pmc/articles/PMC2881446/
- The Uninsured and the ACA: A Primer & Key Facts about Health Insurance and the Uninsured amidst Changes to the Affordable Care Act, Kaiser Family Foundation, Jan 25, 2019. https://www.kff.org/report-section/the-uninsured-and-the-aca-a-primer-key-facts-about-health-insurance-and-the-uninsured-amidst-changes-to-the-affordable-care-act-introduction/
- What Issues Will Uninsured People Face with Testing and Treatment for COVID-19? March 16, 2020. https://www.kff.org/coronavirus-covid-19/fact-sheet/what-issues-will-uninsured-people-face-with-testing-and-treatment-for-covid-19/
- CDC: Evidence used to update the list of underlying medical conditions that increase a person’s risk of severe illness from COVID-19,
https://www.cdc.gov/coronavirus/2019-ncov/need-extra-precautions/evidence-table.html
- Stout Risius Ross. Estimation of households experiencing rental shortfalls.