Great Families 2020 Dashboard – Overall Program Results


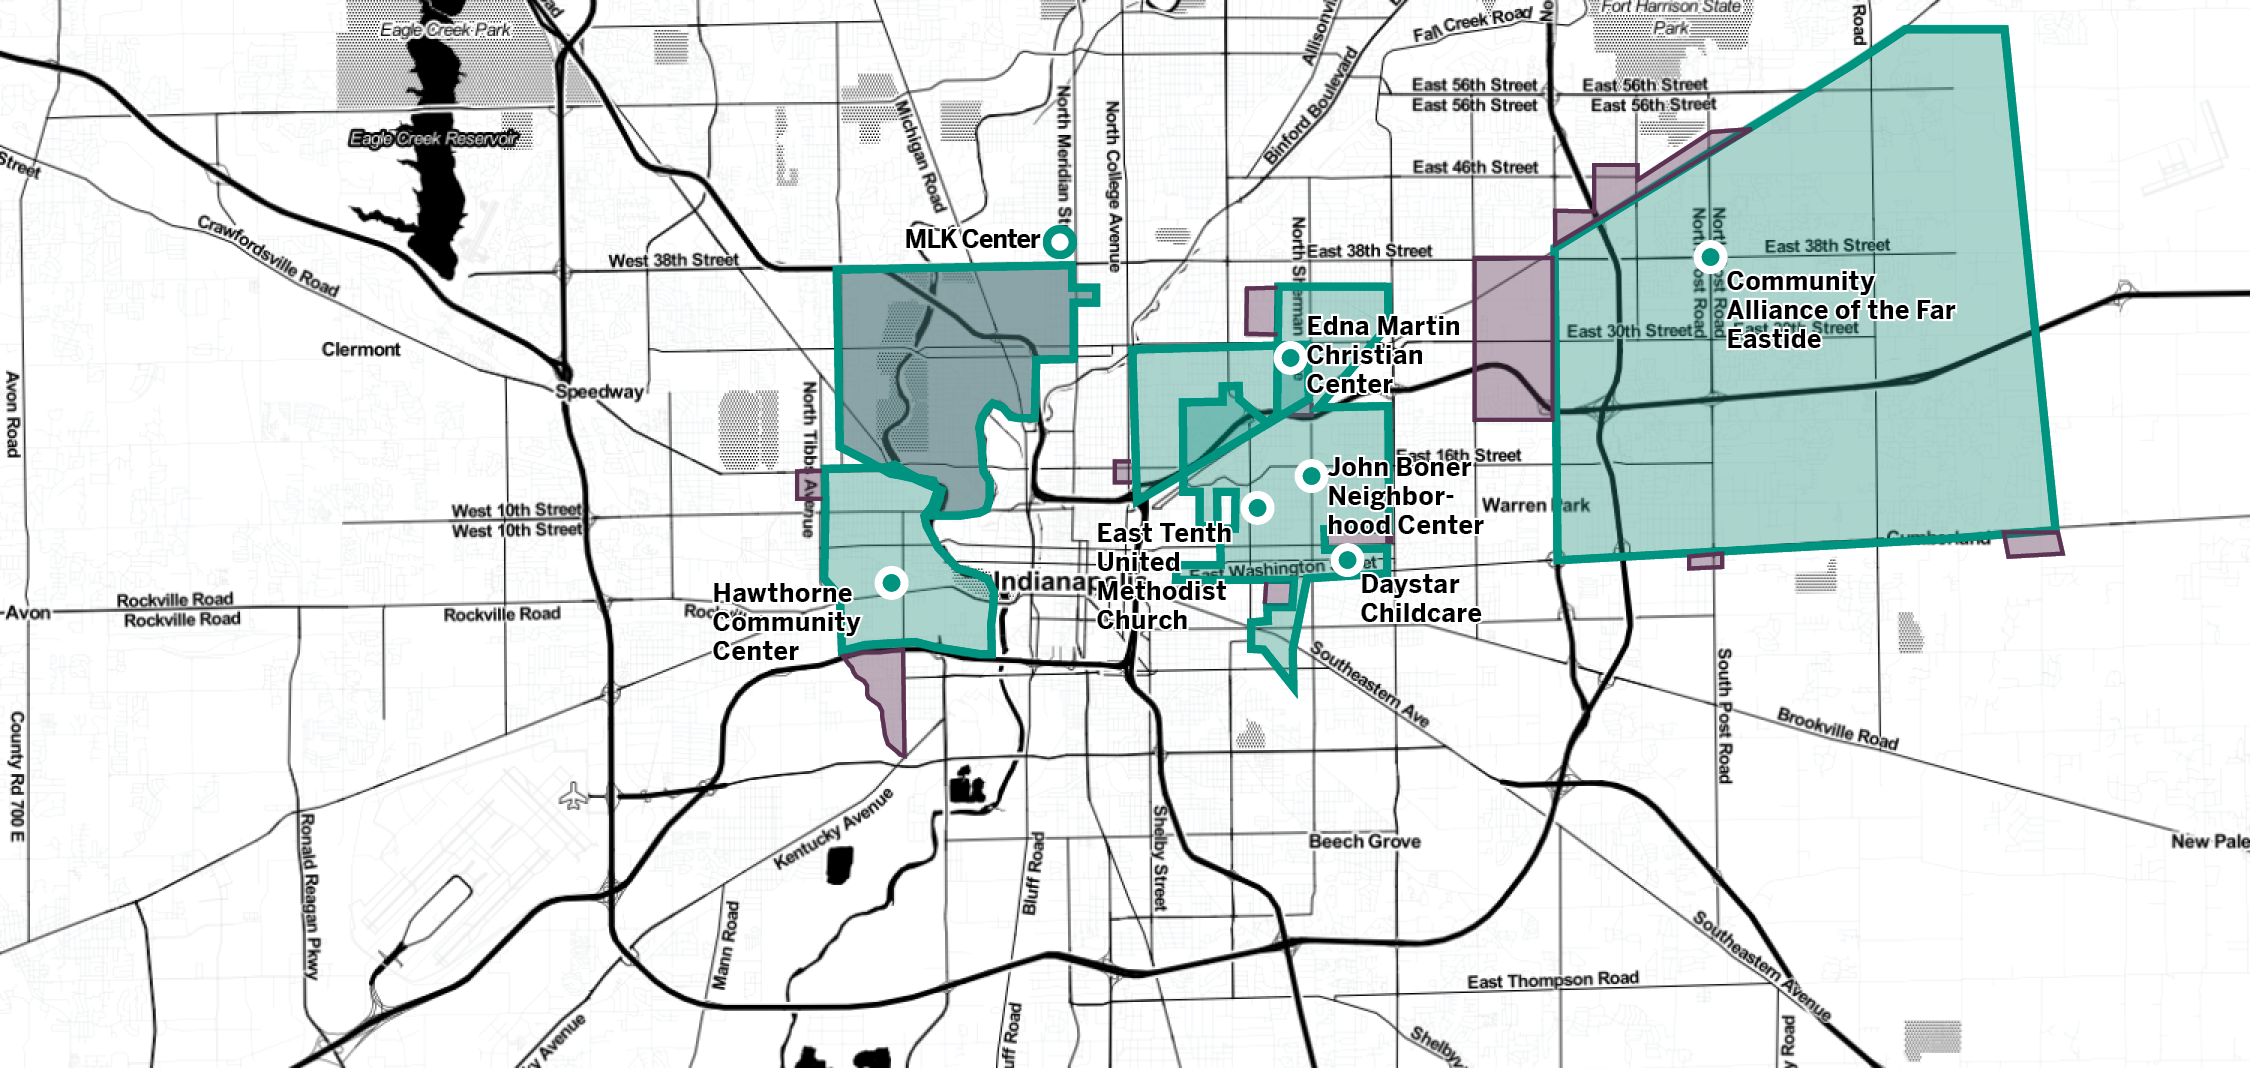
This boundary indicates neighborhood boundaries for all five sites. Participants were not required to live within these boundaries.

Demographic data about the neighborhood references this boundary, which uses census block groups to approximate the boundaries of these neighborhoods.
What is Great Families 2020?
Great Families 2020 was a service delivery model that uses family coaching to direct families in need of financial services to evidence-based interventions and wraparound services using the Aspen Institute’s Ascend two-generational approach (2Gen). This approach focuses on providing services to both parents or caregivers and their children, emphasizing high-quality early learning for children and employment pathways and economic asset-building for the parents. Furthermore, the 2Gen approach stresses the need for social capital and health and wellbeing for the whole family to improve long-term outcomes for both parents and children, recognizing each of these components is critical.
In summary, the five key components of the model as implemented by Great Families 2020 were (1) high quality early childhood development, (2) postsecondary and employment pathways, (3) economic assets, (4) health and wellbeing, and (5) social capital.
Neighborhood and Participant Demographics
734 families were served by GF2020. Eligible families were defined as at least one custodial parent or caregiver and at least one child (ages 0–6), living together as part of a family, who need economic support or stabilization services. In all, 789 parents or caregivers and 1,121 children enrolled in this program.
Age of Parents or Caregivers
The majority of parent or caregiver participants were between the ages of 25 to 34.
Race and Ethnicity
The share of Black and Hispanic/Latinx participants is higher than that of the neighborhoods.
Gender of Children and Parents or Caregivers
Child participants mirror the gender distribution of the neighborhood,
while a greater proportion of parent or caregiver participants are women.
Neighborhood
Participants
Median Household Income
Households in the GF2020 neighborhoods tended to have lower incomes than in the county overall, while GF2020 program participants had incomes that are a fraction of the neighborhood median.
Education Level
Participant education levels were similar to neighborhood residents overall.
Employment Status
Compared to the neighborhoods, a higher share of program participants were in the workforce and seeking employment.
Program Participation
Between October 2017 and June 2020, GF2020 families participated in programming designed to correspond to the five key components of the 2Gen model. Participation metrics for each component are shown below.
Family Coaching
The family coaching process involved developing a relationship with a family coach to (1) set and maintain goals in the five areas of the 2Gen model using a Family Success Plan (FSP), and (2) connect families to services in those five areas that are provided by participating partner agencies.

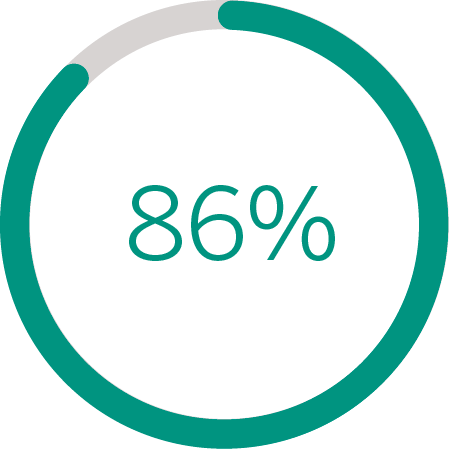
86% of parents or caregivers participated in coaching. 679 parents or caregivers attended an average of 8.6 family coaching meetings.
46% of parents and caregivers received a warm referral. In all, 361 parents or caregivers received 1,222 referrals.
The most common referral category was community and family. 43% of referrals were in this category.
Goals
In the all sites, participants most often set financial and education/work-related goals. The goals related to parenting and child’s education were completed most often.

Warm Referrals
Also called “warm handoffs,” a warm referral is the process of meaningfully guiding a family to a service provider or other agency after making a referral instead of having the program participant make all arrangements. Across all sites, participants were most often referred to community and family services. Food and nutrition had the highest attendance rate of all referral types.

Program Outcomes
GF2020 participants reported meaningful improvements related to their economic assets, health and well-being, and social capital.
Statistically significant increase in average monthly income
Families felt more positively about their neighborhood
Statistically significant increase in participants’ willingness to “help neighbors” and how much they felt they could “trust people in their neighborhood.”
Preliminary early childhood education data offer encouraging results to inform future efforts.
Parents and caregivers reported improvements in physical and mental health
Statistically significant increase in number of “healthy days” per month and decrease in share participants who felt “bad about themselves”.
Parents/caregivers were more likely to engage in their community
Statistically significant increase in the degree to which participants said they could “make their community a better place.”
Parents and caregivers were more prepared to provide care for and connect with their children
Statistically significant increase in how parents rate their “child development and knowledge of parenting” and “concrete supports.”
Families were better able to work through challenges together
Statistically significant increase in how parents rate their “family functioning and resiliency.”
This dashboard was produced by The Polis Center at IUPUI. Neighborhood demographics are based on analysis by The Polis Center of data from the American Community Survey 2014-2018 estimates via SAVI Community Information System. Participant information in this report is based on Polis Center analysis of program and survey data collected by sites between October 2017 and June 2020. Additional support and analysis was provided by the Center for Research on Inclusion and Social Policy at the IU Public Policy Institute and the United Way of Central Indiana.
