Equity and Criminal Justice
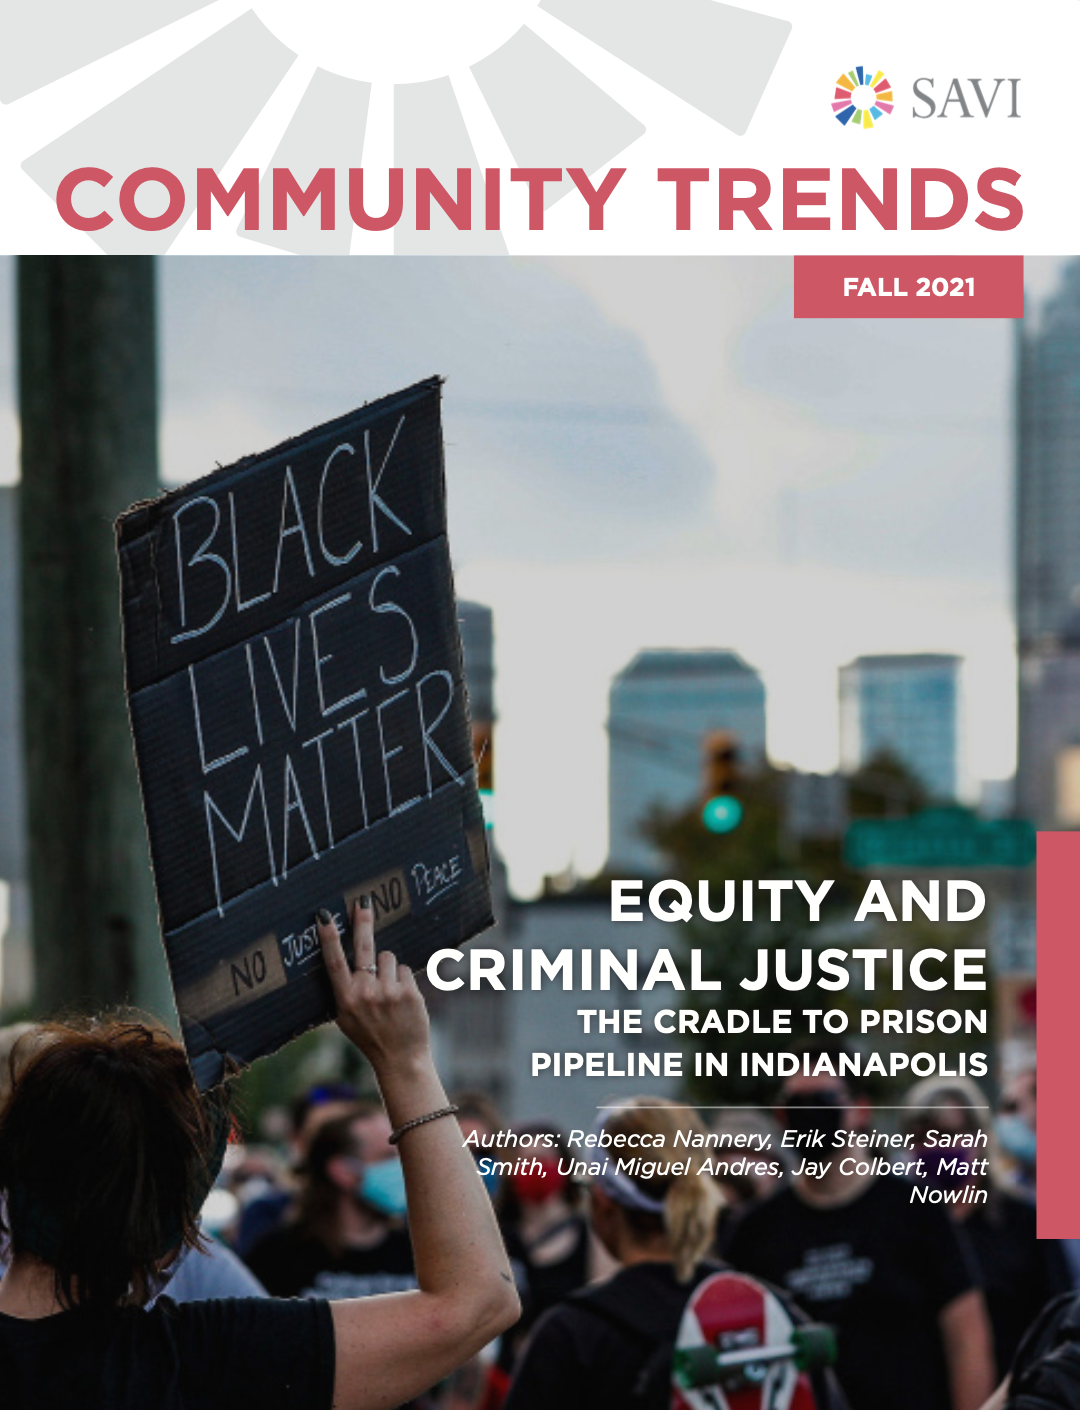
SAVI Talks - November 18, 2021An individual’s interaction with the criminal justice system is not necessarily a random event: Research shows that beginning from birth, various factors including disability, race, gender, and economic status result in disproportionate impact on subpopulations in a way that makes them more likely to engage with the criminal justice system. These factors, and policies that alleviate or compound existing inequities will be examined using the Cradle to Prison Pipeline framework.
This report examines a concept called the “cradle to prison pipeline.” It is a review of some of the basic statistics at each stage of this pipeline: childhood, school, juvenile justice, early adulthood, and imprisonment. For each stage, we present basic trends and disparities across race, place, gender, and other demographic variables.
Research has shown that highlighting racial disparities can actually increase support for policies that perpetuate inequality, such as “stop and frisk.” With caution, this report maintains a focus on disparities, particularly between Black and white residents, because those are indicative of problems within systems and not the inherent criminality of individuals or populations.
Black and white jail population per 100,000 people age 15-64 (five-year average)
Indiana
Marion County
Community Trends Report
SAVI Talks Presentation
Introduction & Report Presentation:
Panel Discussion & Closing Remarks:
Articles and Story Maps
Explore other research and interactive content we have developed around equity.
Near Eastside Neighborhood
The Local Initiatives Support Corporation (LISC) Sustainable Communities Initiatives supports community-driven efforts to revitalize neighborhoods through comprehensive community development. In 2006, Indianapolis launched the Great Indy Neighborhoods Initiative...
The Changing Demographics of the Foreign-Born Population in America and Indiana
We recently came across these interesting maps created by the Pew Research Center showing the changing demographics of the foreign-born population in America. Several media outlets featured these fascinating maps where Pew compared the biggest sources of immigrants...
Domestic Violence in Marion County
The Polis Center partnered with Domestic Violence Network (DVN) to analyze data from the criminal justice system to gain a better understanding of the state of domestic violence in the county. DVN released the report today. Below are a few highlights of the findings...
Our takeaways from the National Neighborhood Indicators Partnership (NNIP) Conference
“Are there SAVIs in other cities?” is a question that I get occasionally, and the answer is certainly yes. Many community and neighborhood organizations are part of a netowrk called the National Neighborhood Indicators Partnership (NNIP). NNIP is a collaboration of...
Are We Losing Our Best and Brightest to Other States?
Opinions abound on the issue of “Brain Drain” in Indiana and elsewhere. Brain Drain is the term given when college graduates move out of state taking their knowledge and skills with them. What drives it, what can be done about it, and how do we compare to other peer...
Social Media Data Can Guide a Nonprofit’s Content Strategy
This year, social media astonished us yet again with its sheer power and unbelievable reach. While there are many nonprofits that achieved tremendous success on social media this year, there are several others who are still struggling to get it right. We all know that...
What’s the dominant minority population in your neighborhood?
The 18th annual Spirit & Place Festival, a long-time project of The Polis Center, explored the 2013 theme of Risk through 30 community programs that toed the line between safety and danger, ease and discomfort, and security and uncertainty. For example, the...
Love It or Hate It, Charter School Enrollment Is on the Rise
The topic of charter schools is often controversial. Consider this. The percent of students in the Indianapolis Public School Corporation enrolled in charter schools 5 years ago was 12.4%. In 2013 it increased to 20.8%. That’s a 67% increase! But IPS’s increase in...
Inspiring words from this year’s conference
At the end of this year’s Governor’s Conference on Service and Nonprofit Capacity Building, we gave each attendee a blank sheet of paper and asked them to complete the following sentence. When I leave this conference, I will _____________. The responses range...
Examining Housing Changes Over Time using US Census Data
Changes in Owner Occupied Houses in the KI EcoCenter Area: Block Group Units Comparing 2000 and 2010 Census Data By Jim Scheurich, PhD A change over time in owner occupied houses is one way to examine whether a community is growing, remaining stable, or growing in...
Authors
Sharon Kandris
Associate Director,
The Polis Center
Jay Colbert,
Data Manager,
The Polis Center
Jeramy Townsley,
Visiting Research Analyst,
The Polis Center
Matt Nowlin,
Research Analyst,
The Polis Center
Event Partners


