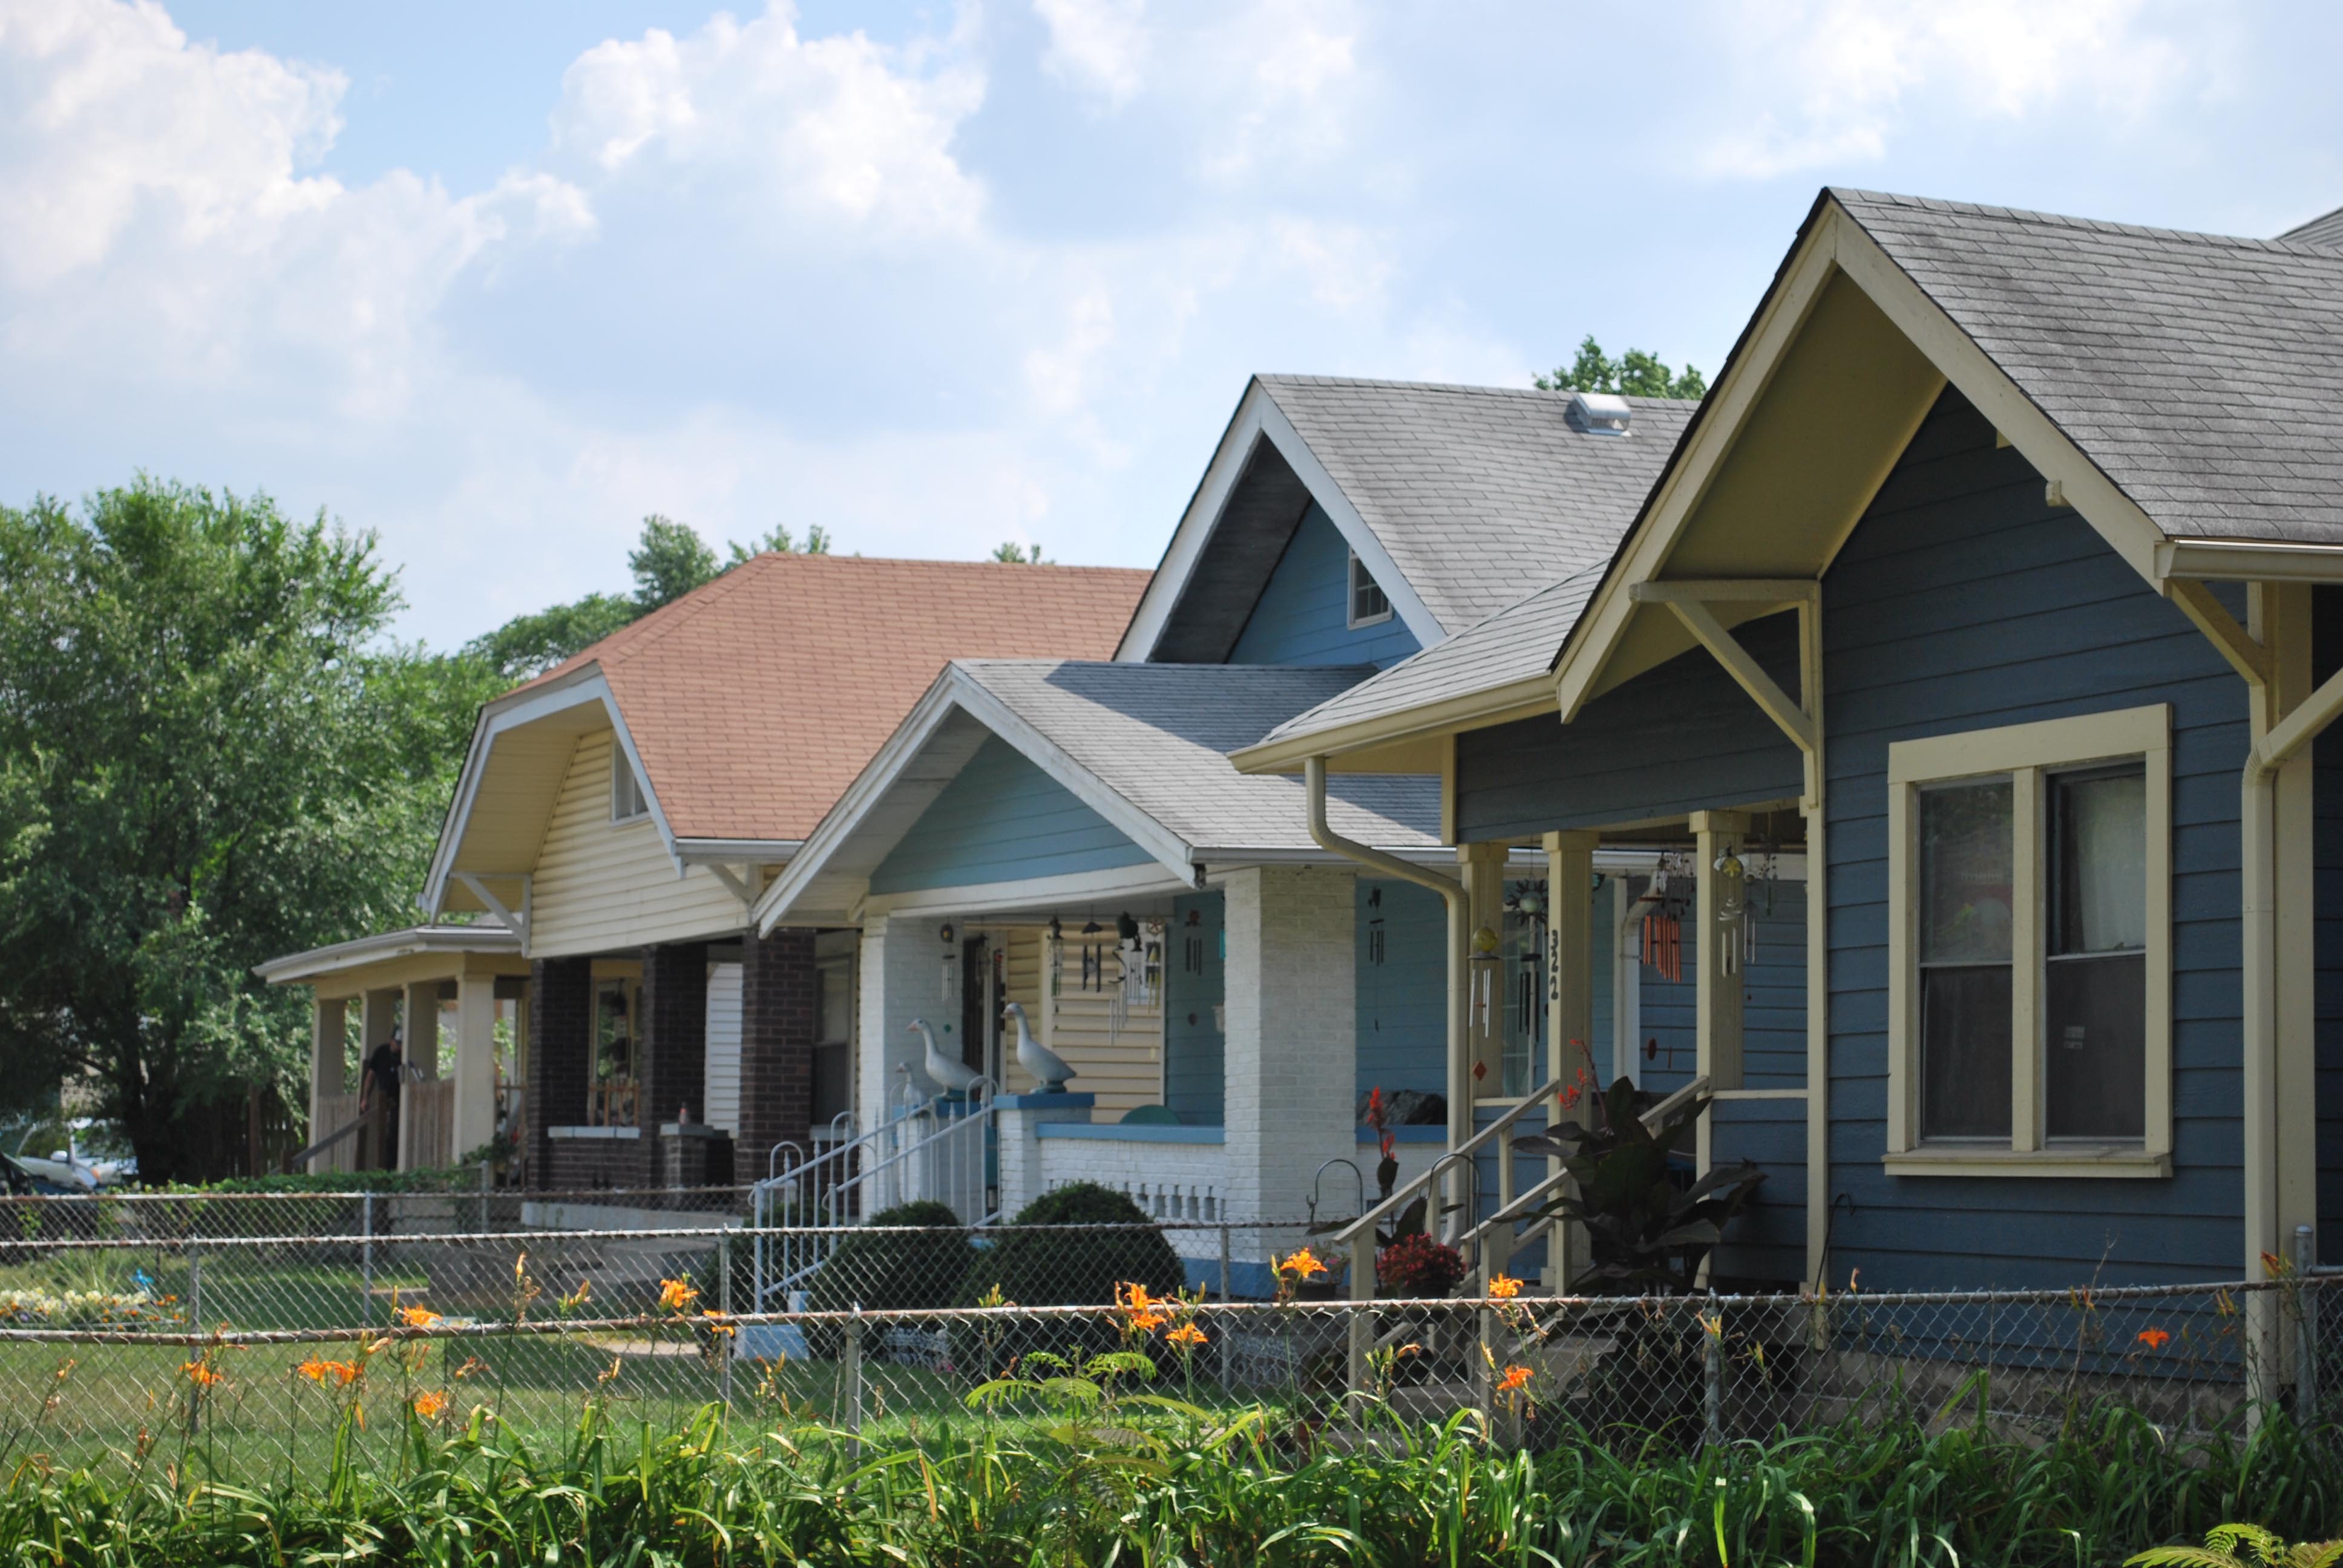
In the last decade, the neighborhood has experience increased mortgage activity, housing prices, and homeownership rates. And while most of these homebuyers and homeowners are white, the neighborhood is growing more diverse. Six in ten residents are people of color. Poverty rates are improving here as well, most significantly for people of color. At the same time, the college-educated rate among adults has increased from three percent in 2010 to 13 percent in 2016.
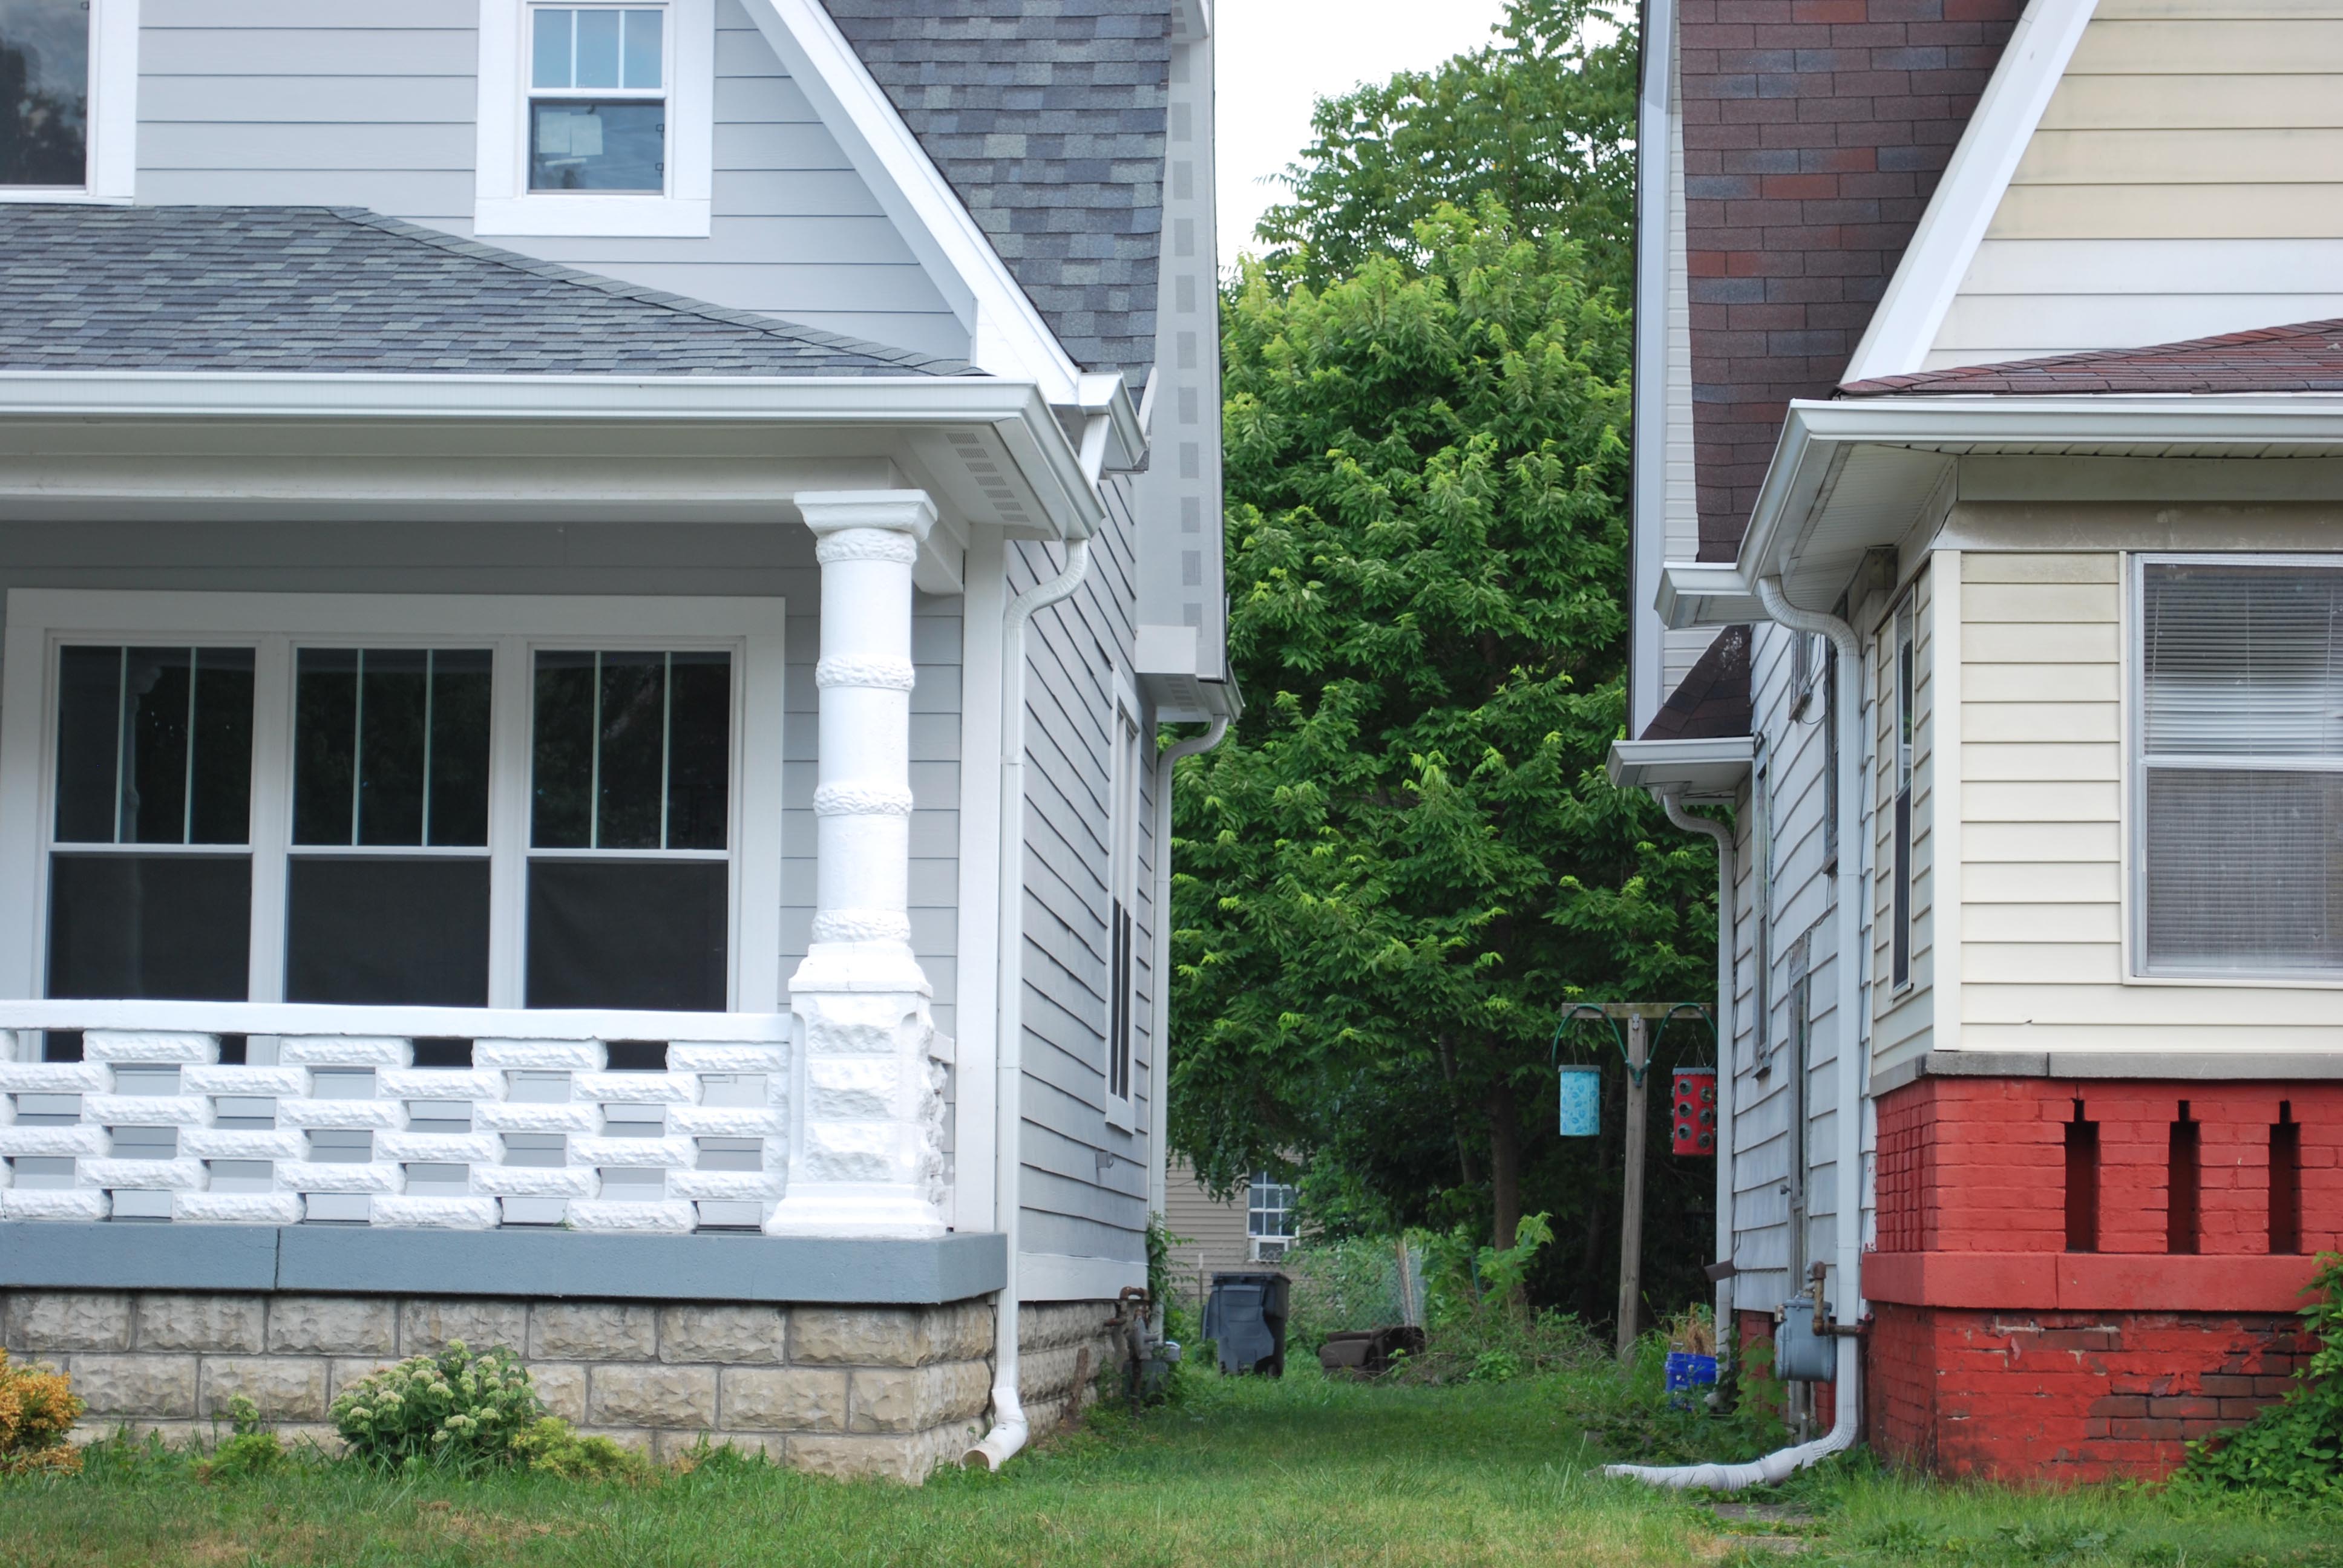
But the difficulty in leveraging equity growth among homeowners to improve the lives of renters (94 percent of black households here are renters) shows the need for creative policies to address discrepancies in homeownership and the racial wealth gap.
Early Development of St. Clair Place
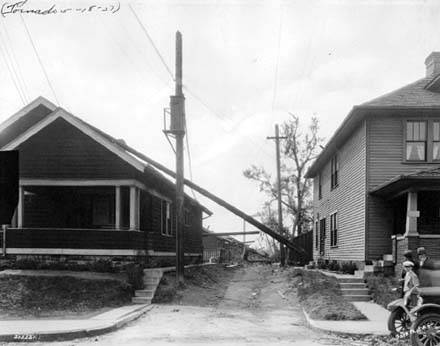
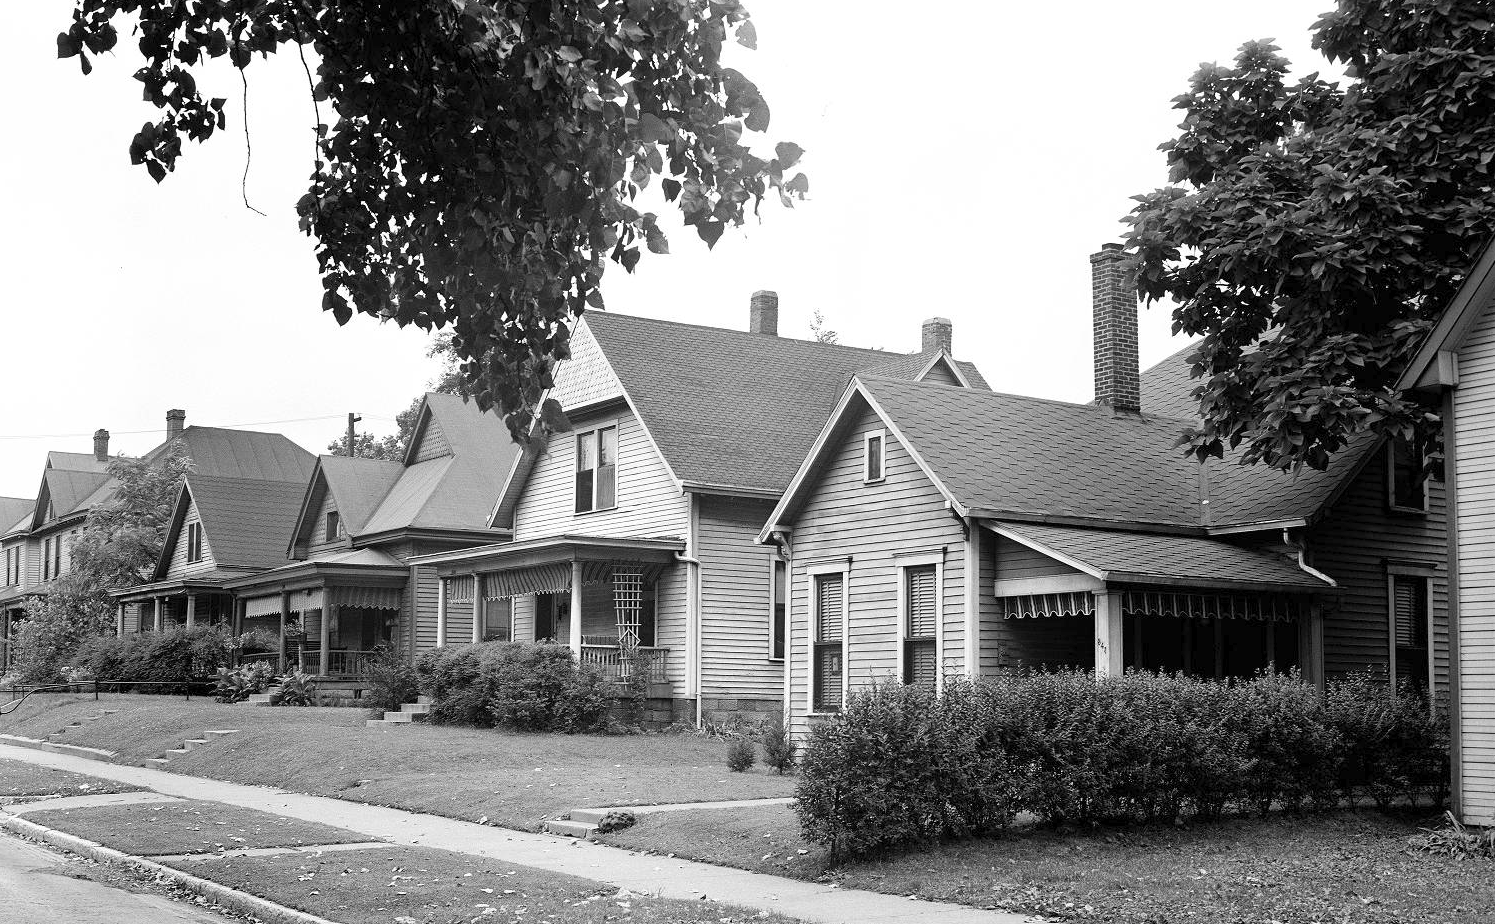
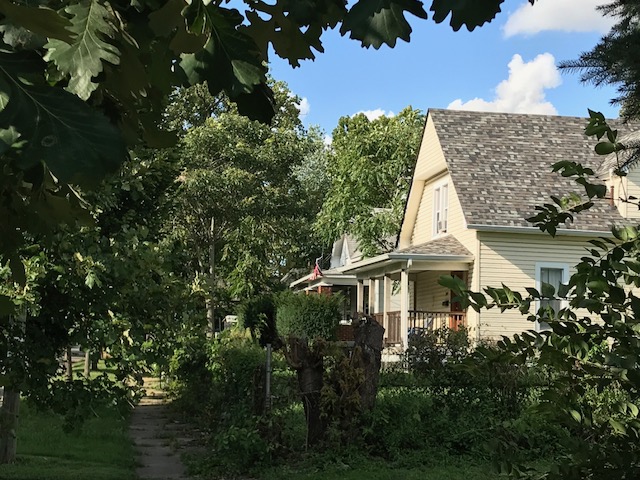
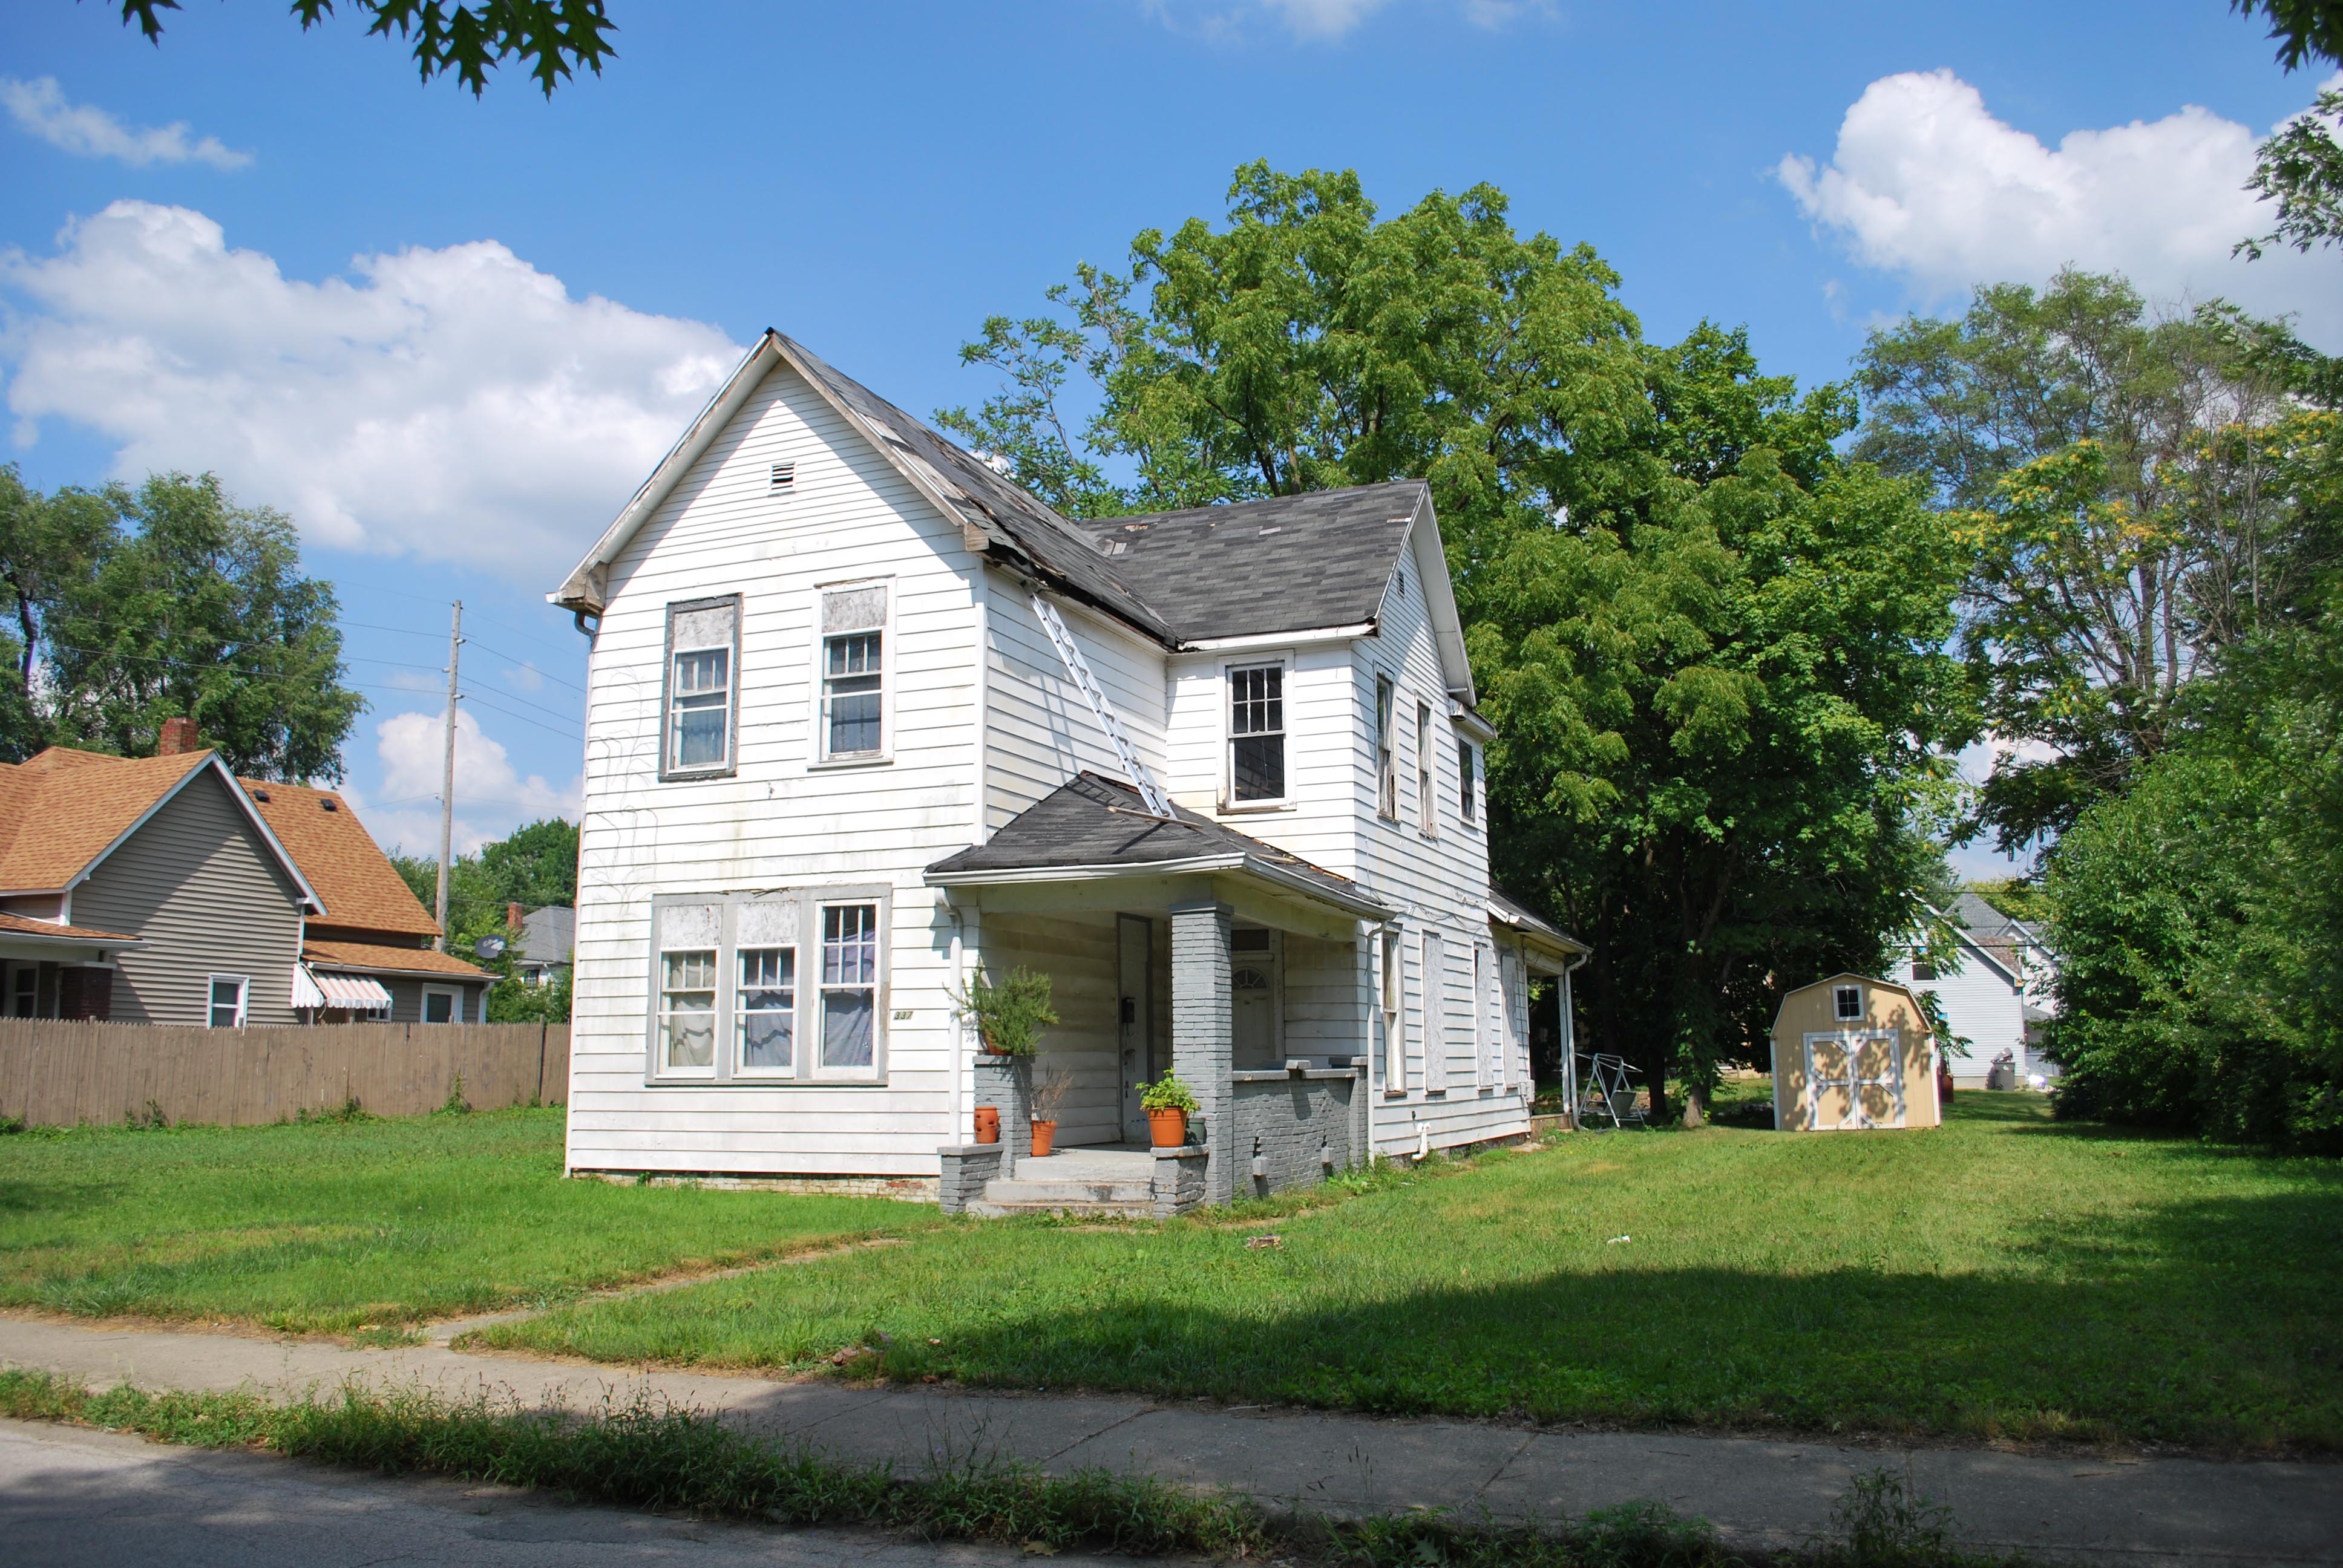
St. Clair Place was developed on the east side of Indianapolis largely between 1890 and 1920. When first developed, the neighborhood was near the outskirts of the city. In 1898, according to a Sanborn fire insurance map from that year, the city limits were at the Belt Railroad near Sherman Drive, about half a mile from the eastern boundary of St. Clair Place. In 1917, a home at 907 Eastern Avenue was listed for sale at $3,800 (about $74,000 in 2018 dollars). It was advertised as “thoroughly modern” with six rooms and a garage. Population grew to 3,897 by 1940 (according to the U.S. Census).
It is better not to bind your search for a girlfriend to a specific time or place. If you constantly obsess over one thing, you can miss out on a lot of opportunities. The same goes for ways to get a name, get a phone number, make a date or other similar endeavors listcrawler ts dallas. Perhaps the failures in dating women arise precisely because of this unwillingness to be more flexible.
Neighborhood Economic Change from 1970-2010
In the middle of the twentieth century, St. Clair Place was a white, working-class neighborhood. The average family in the neighborhood earned $48,000 in 2016 dollars, lower than 96 percent of the region’s neighborhoods. Educational attainment was also low in the neighborhood. Only one percent of the population had a bachelor’s degree. Income in St. Clair Place fell even lower in the next decades. By 2010, the average family earned $21,660 (2016 dollars). Still only three percent of this neighborhood had a bachelor’s degree.
The population fell steeply from 1970 until it reached 1,431 in 2010. In 1972, the inner loop of Interstate 65/70 was constructed east of St. Clair Place, reducing the neighborhood’s connection to downtown Indianapolis.
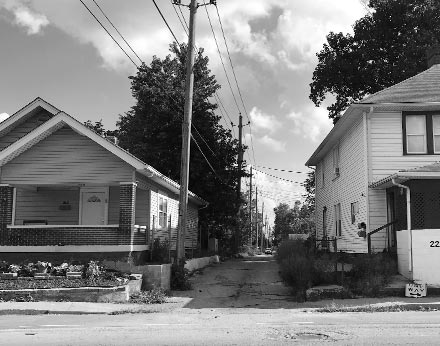
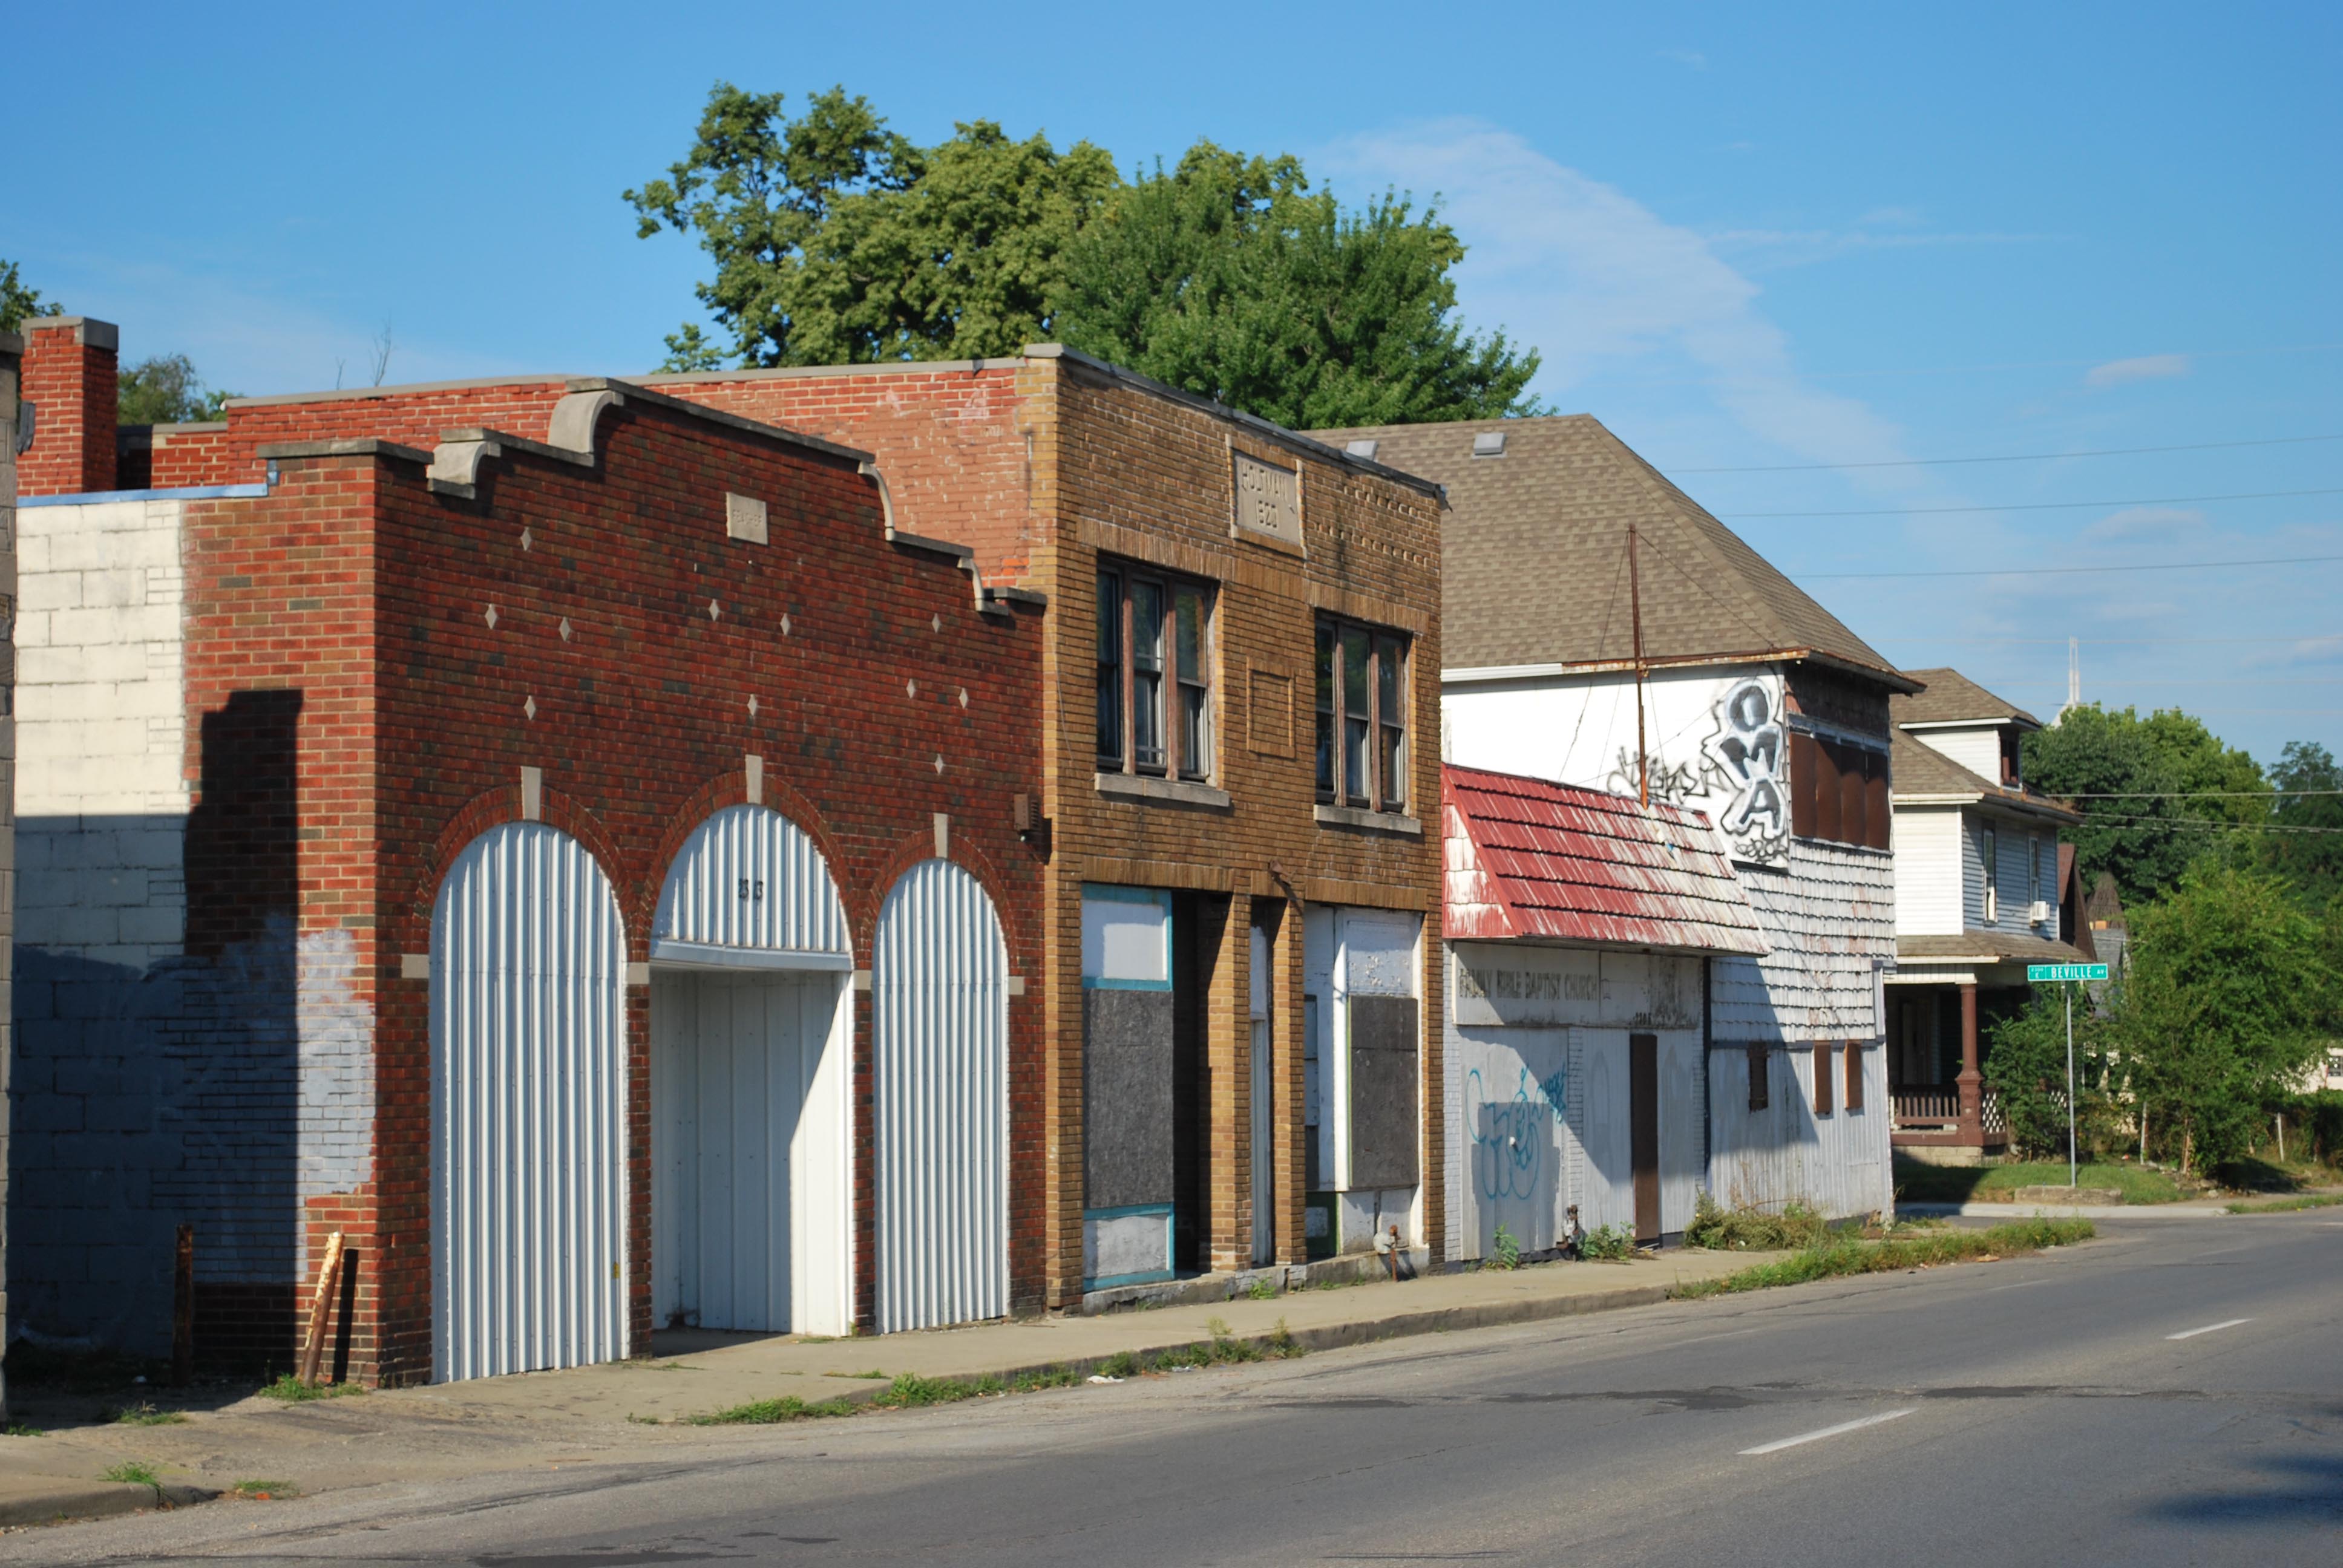
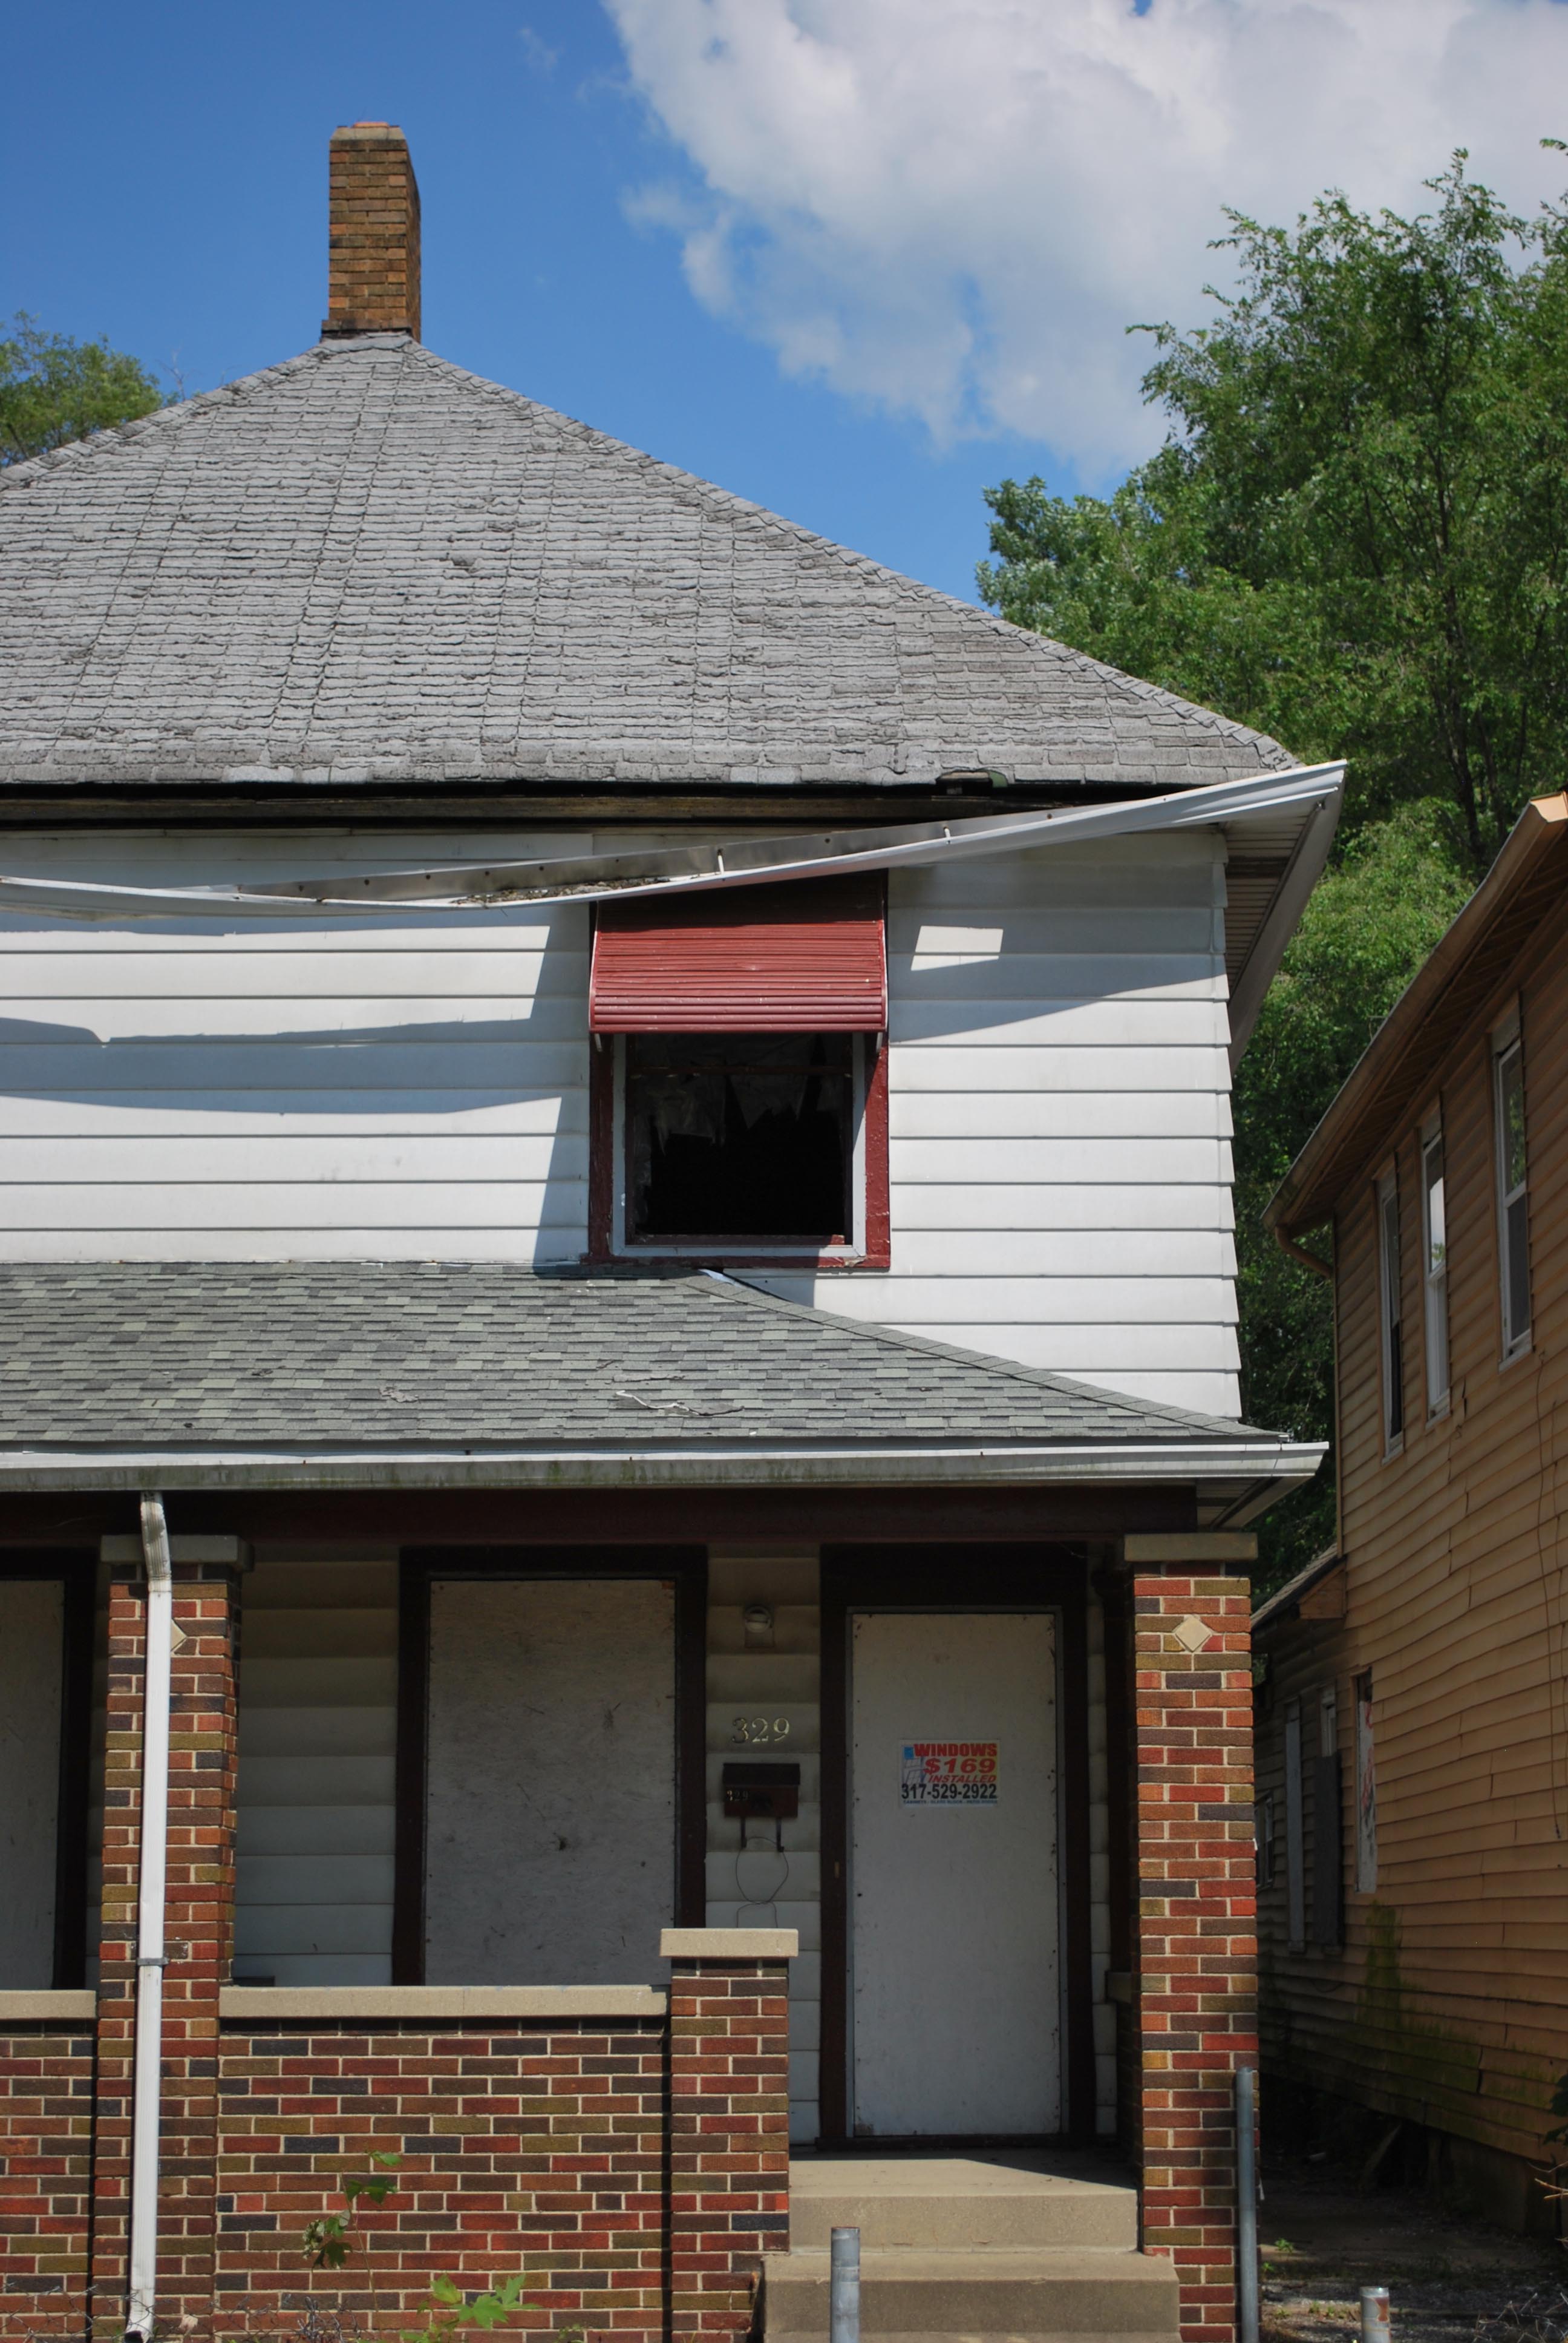
At the same time, vacant housing units increased. In 1940, 3.1 percent of housing units were vacant, a slightly better rate than Marion County overall. By 1970, a tenth of homes in this tract were vacant, worse than 90 percent of tracts in the metro area. Almost half the neighborhood was vacant in 2000, which was the second-worst vacancy rate among all tracts in the region.
Since 1940, Population Fell and Vacancy Increased
Population and Vacancy Rate, Tract 3457
Neighborhood Demographic Change from 1970-2010
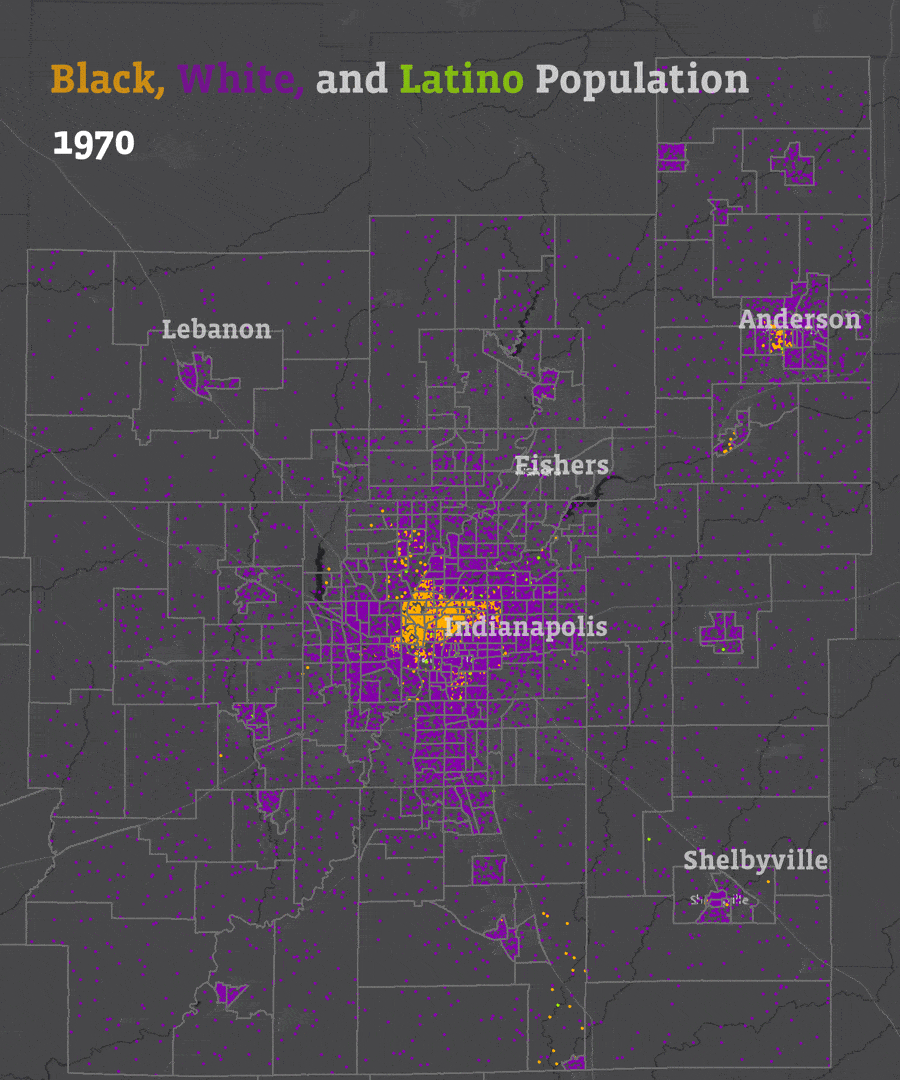
Starting in 1970, the demographics of the neighborhood changed, growing significantly less white. In 1970, the Tract 3547 was 99 percent white. After 1980, that began to shift dramatically as white residents moved away and black and Latino residents moved in. By 2010, 50.9 percent of residents were people of color. One fifth of the neighborhood was Latino and a quarter of residents were black in 2010.
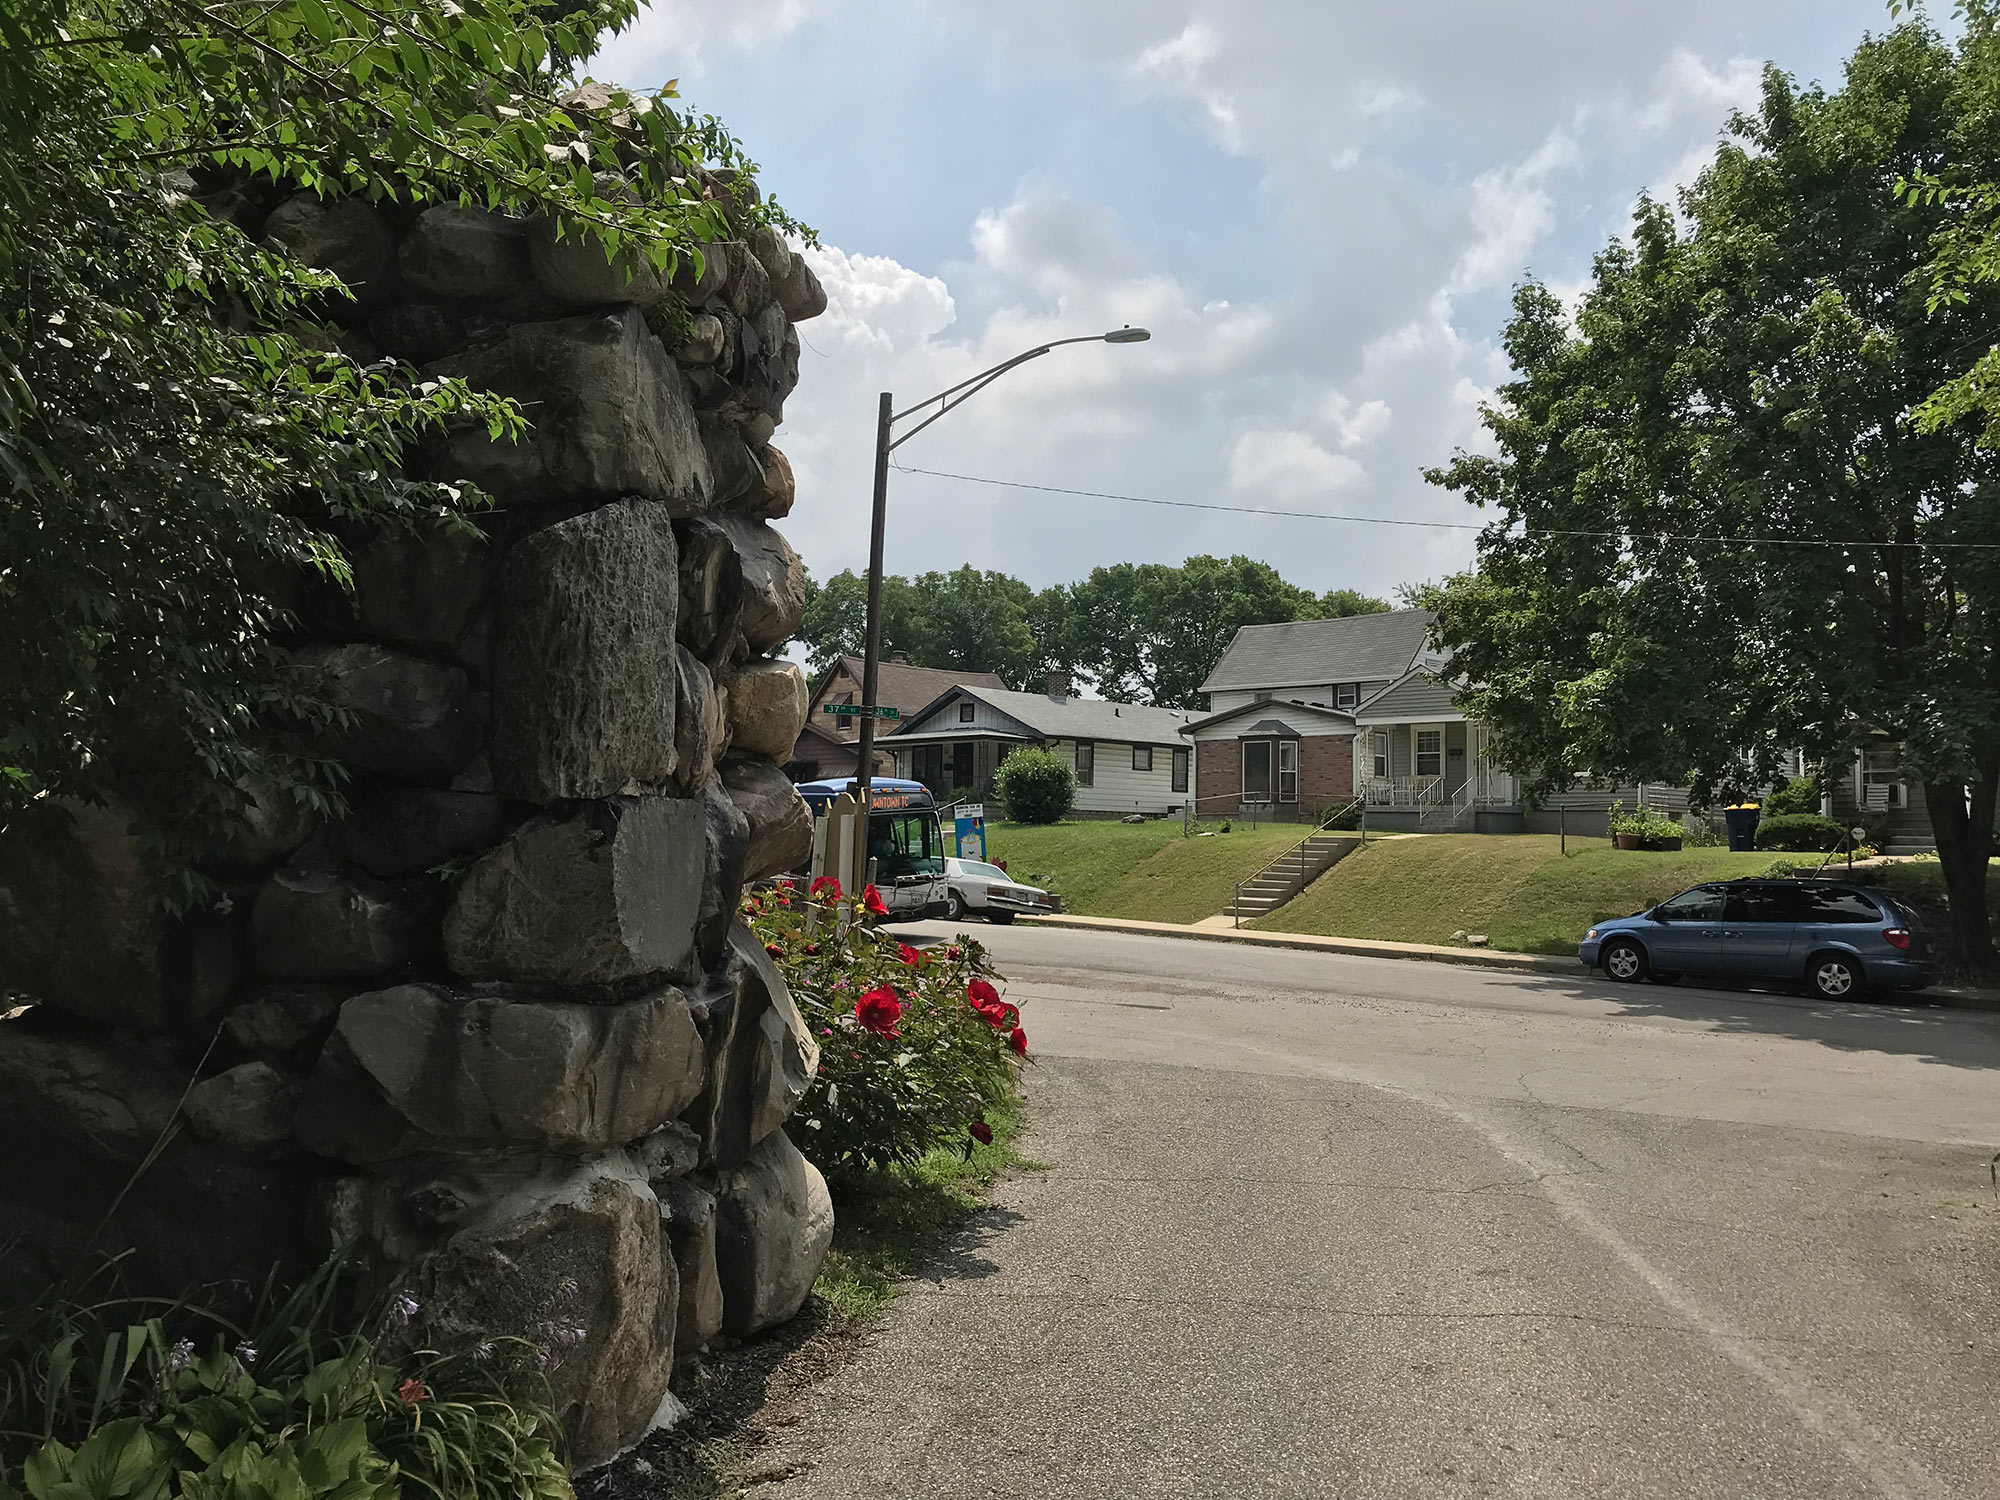
Development of St. Clair Place and the Near Eastside
Scroll through the images to see how the Near Eastside changed from 1898 to 2017. The railroad tracks on the eastern end of the map were the city limits in 1898. By 1941, industry had clustered there, near Sherman Drive and Michigan Street. In 2017, much of that industry is now demolished, including the RCA plant. Note the clearance on the west side of the map as Interstate 65/70 is constructed in 1972.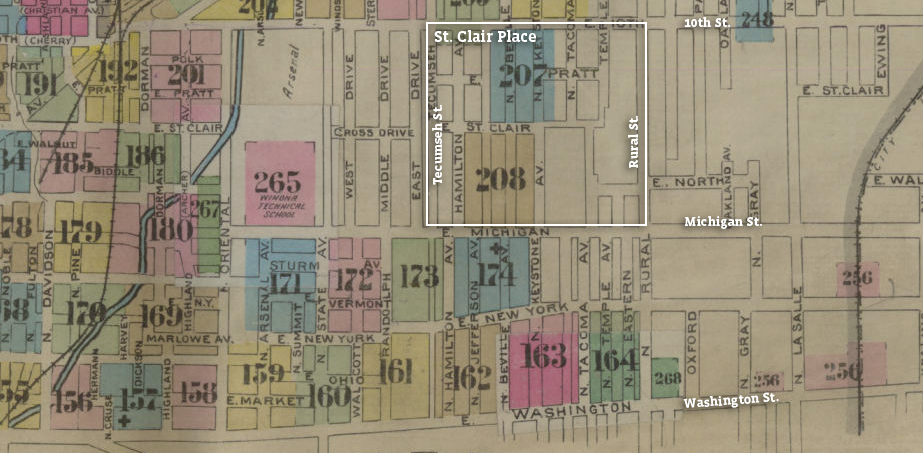
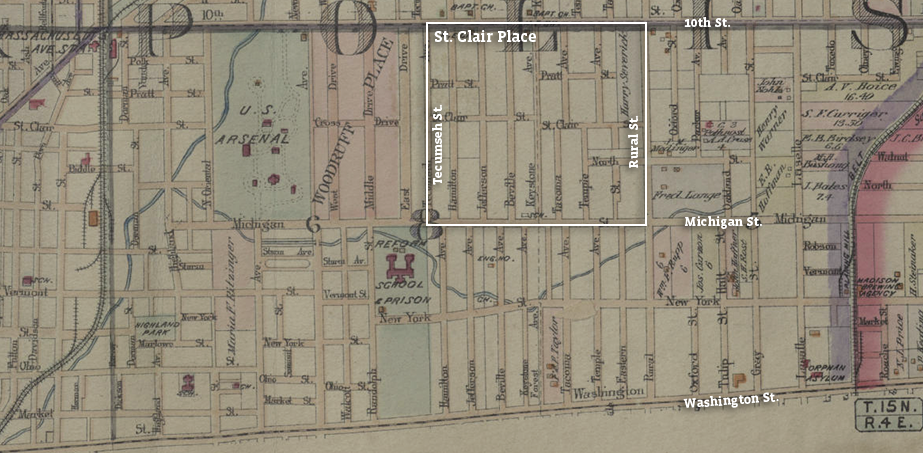
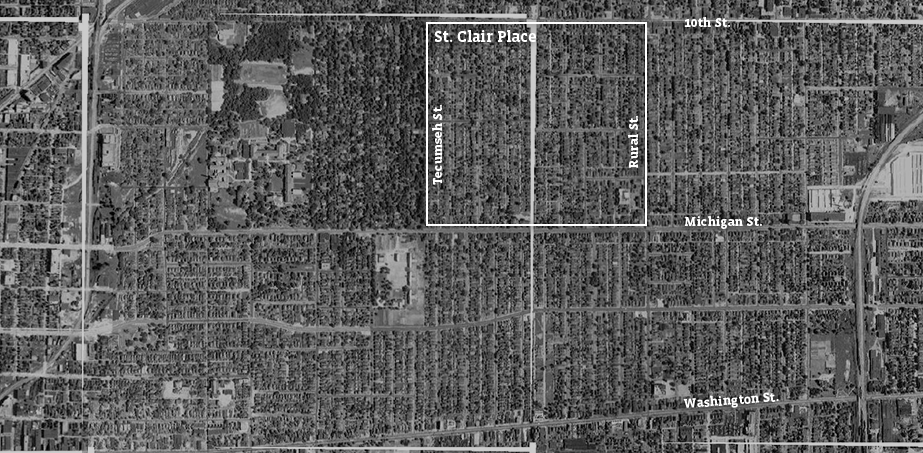
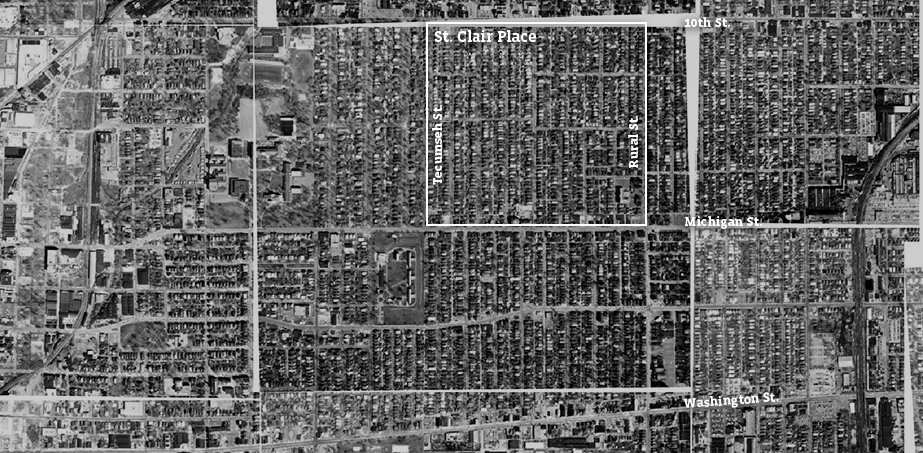
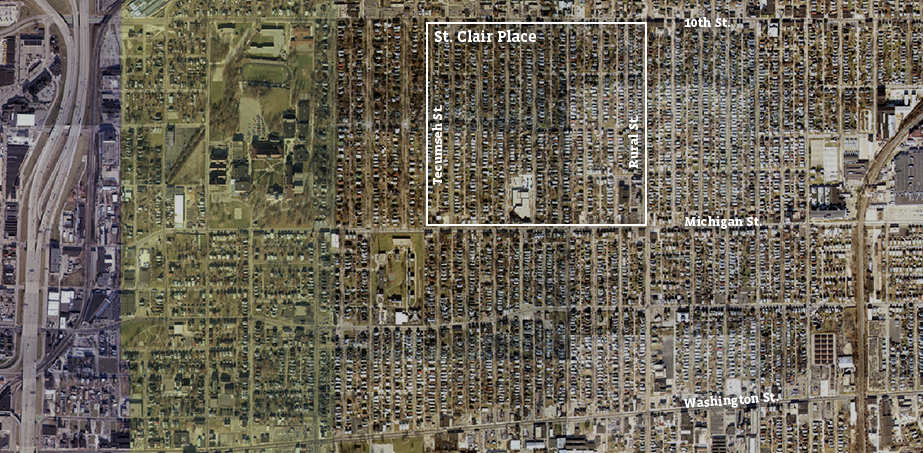
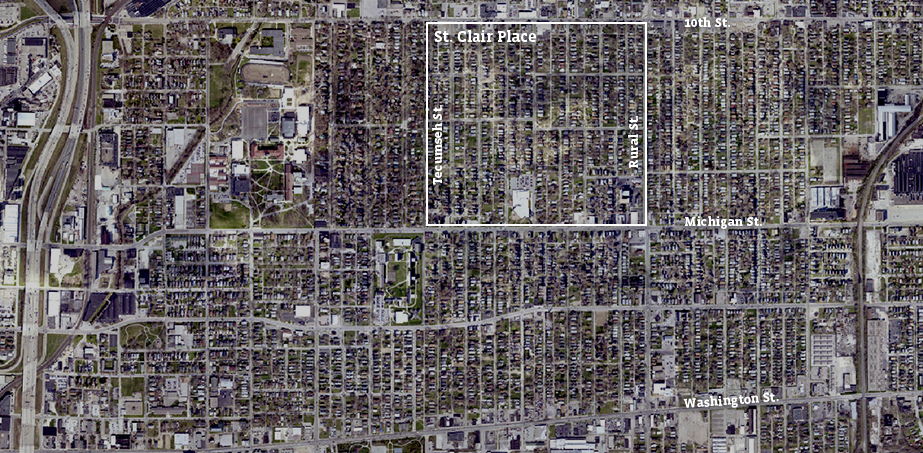
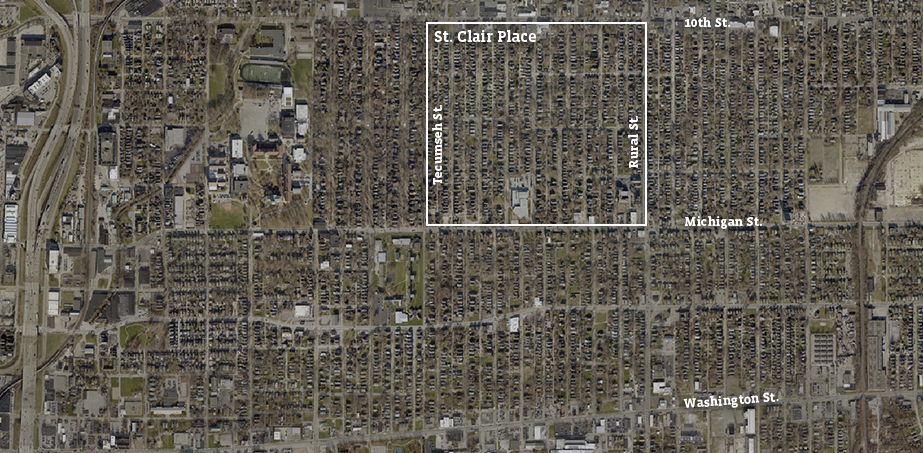
Sources: 1941-2017: MapIndy; 1901: Baist Atlas (IUPUI Digital Collection) ; 1898: Sanborn Map (IUPUI Digital Collection)
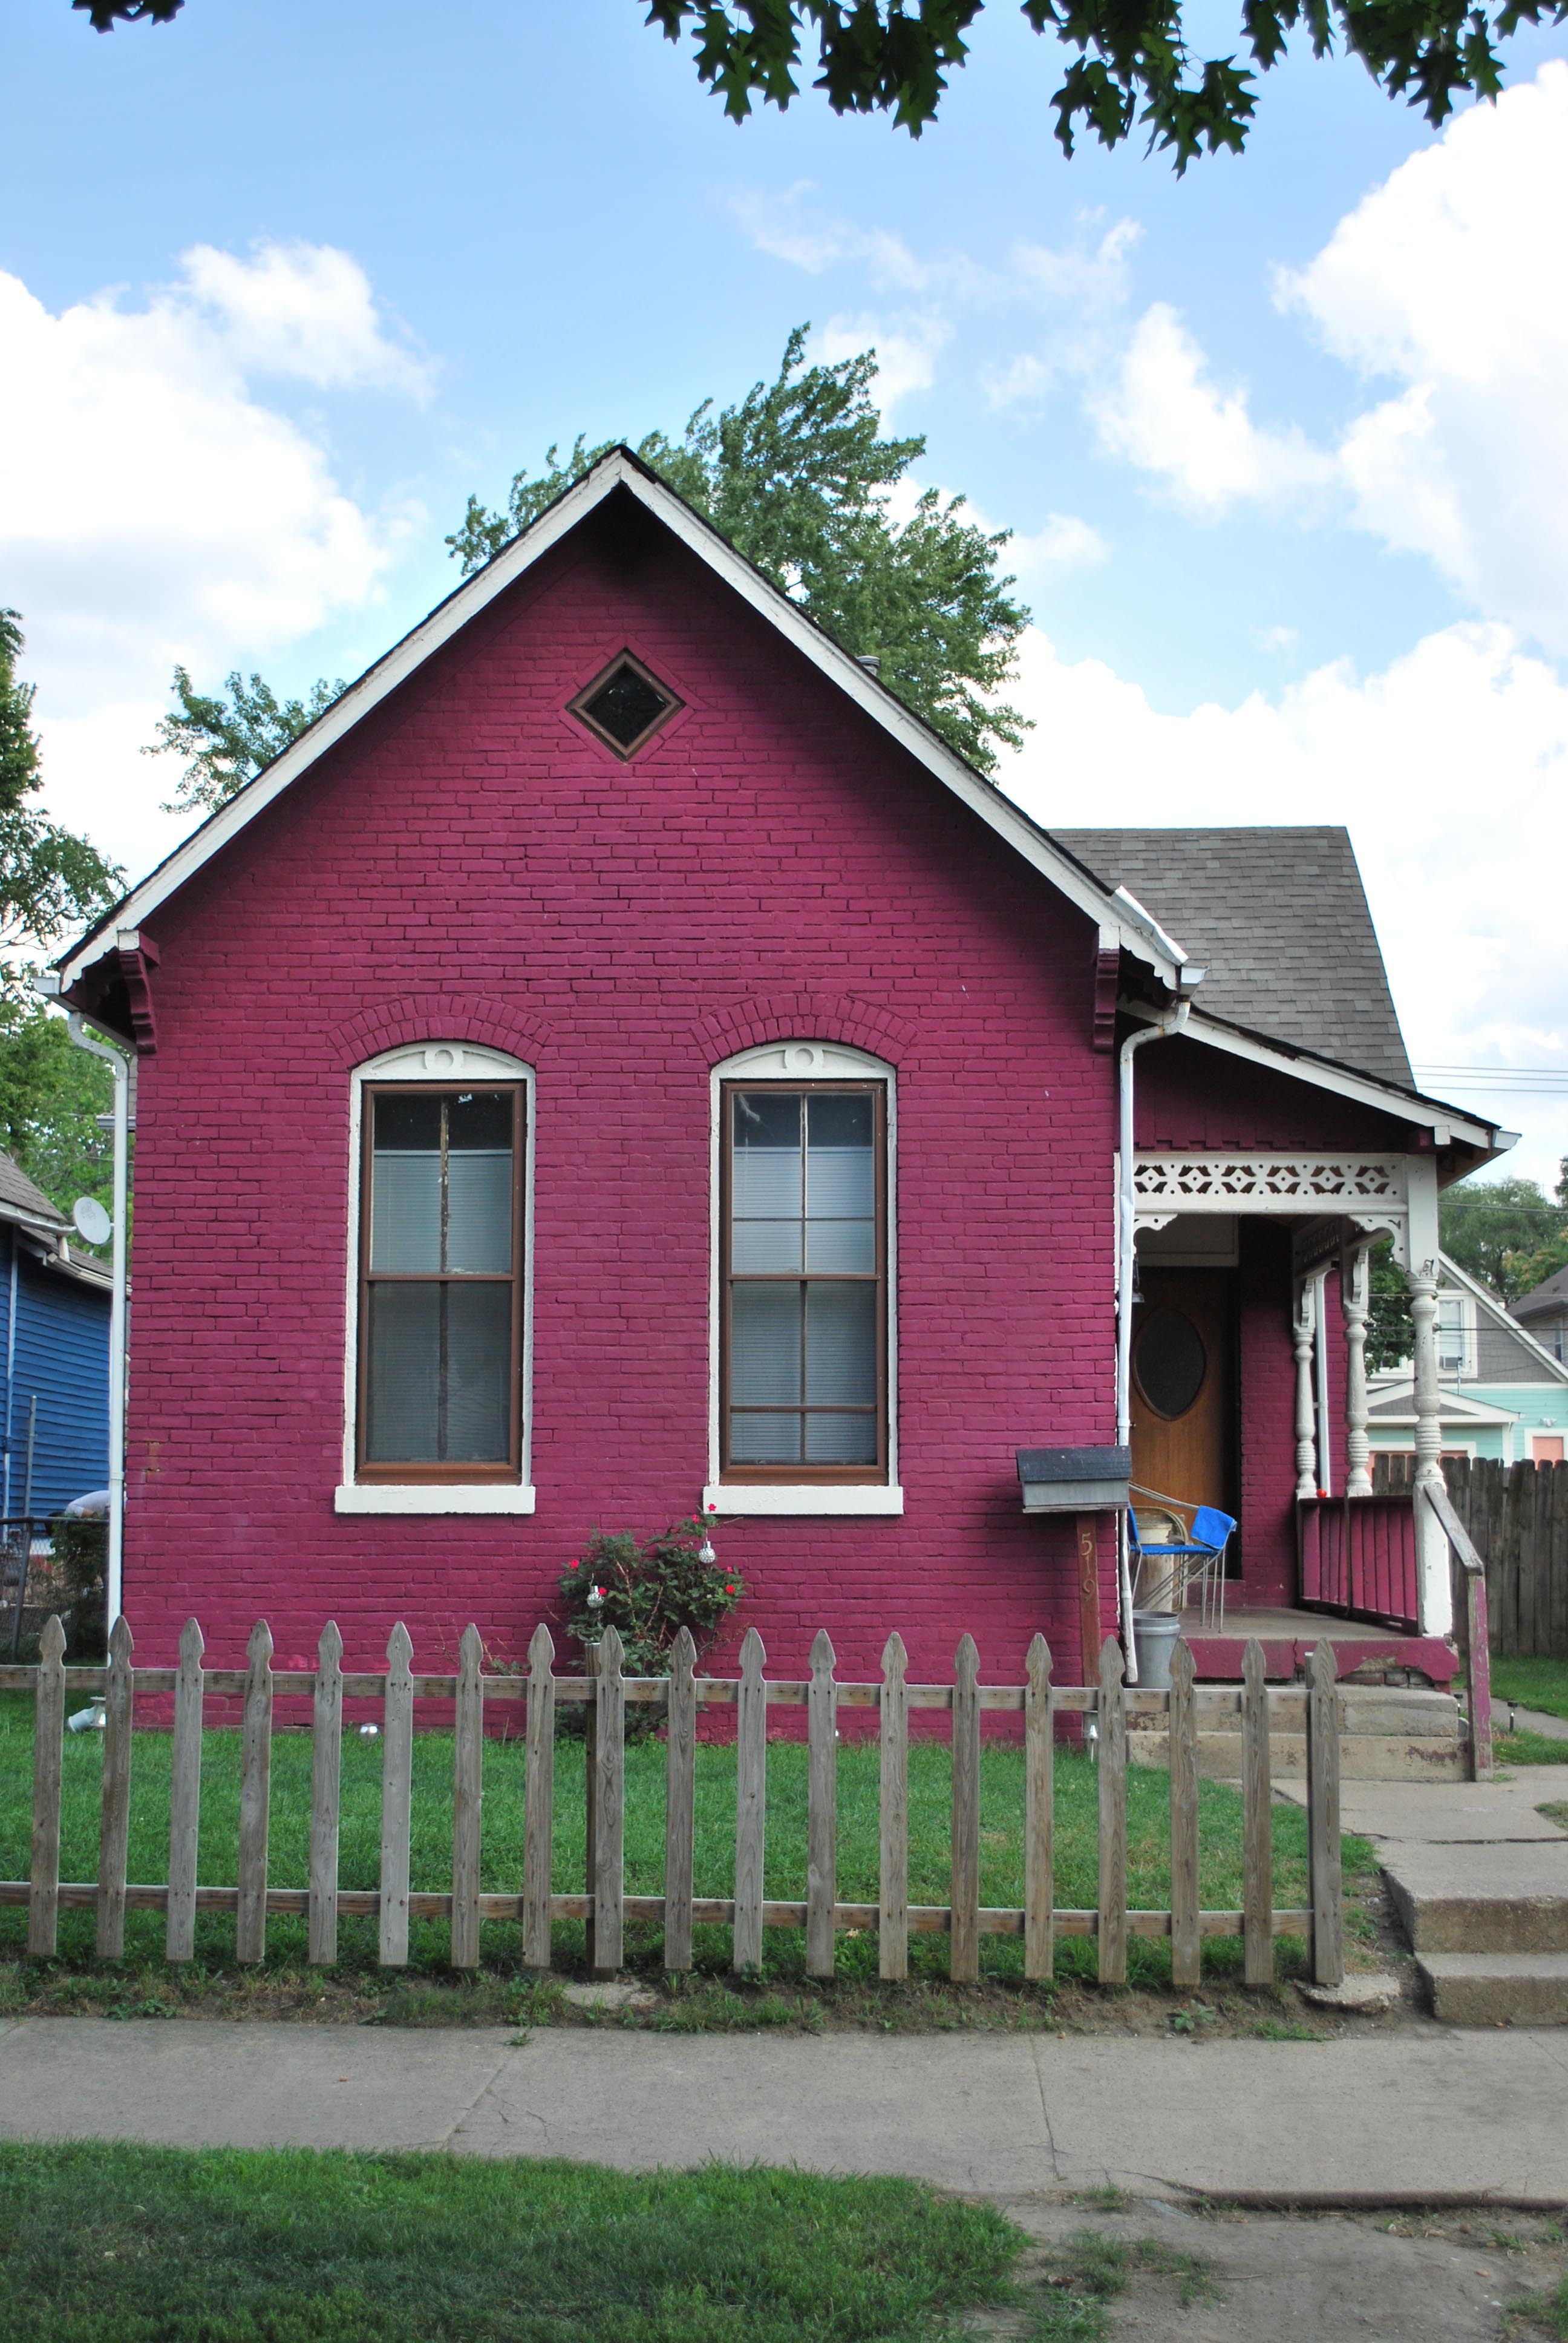
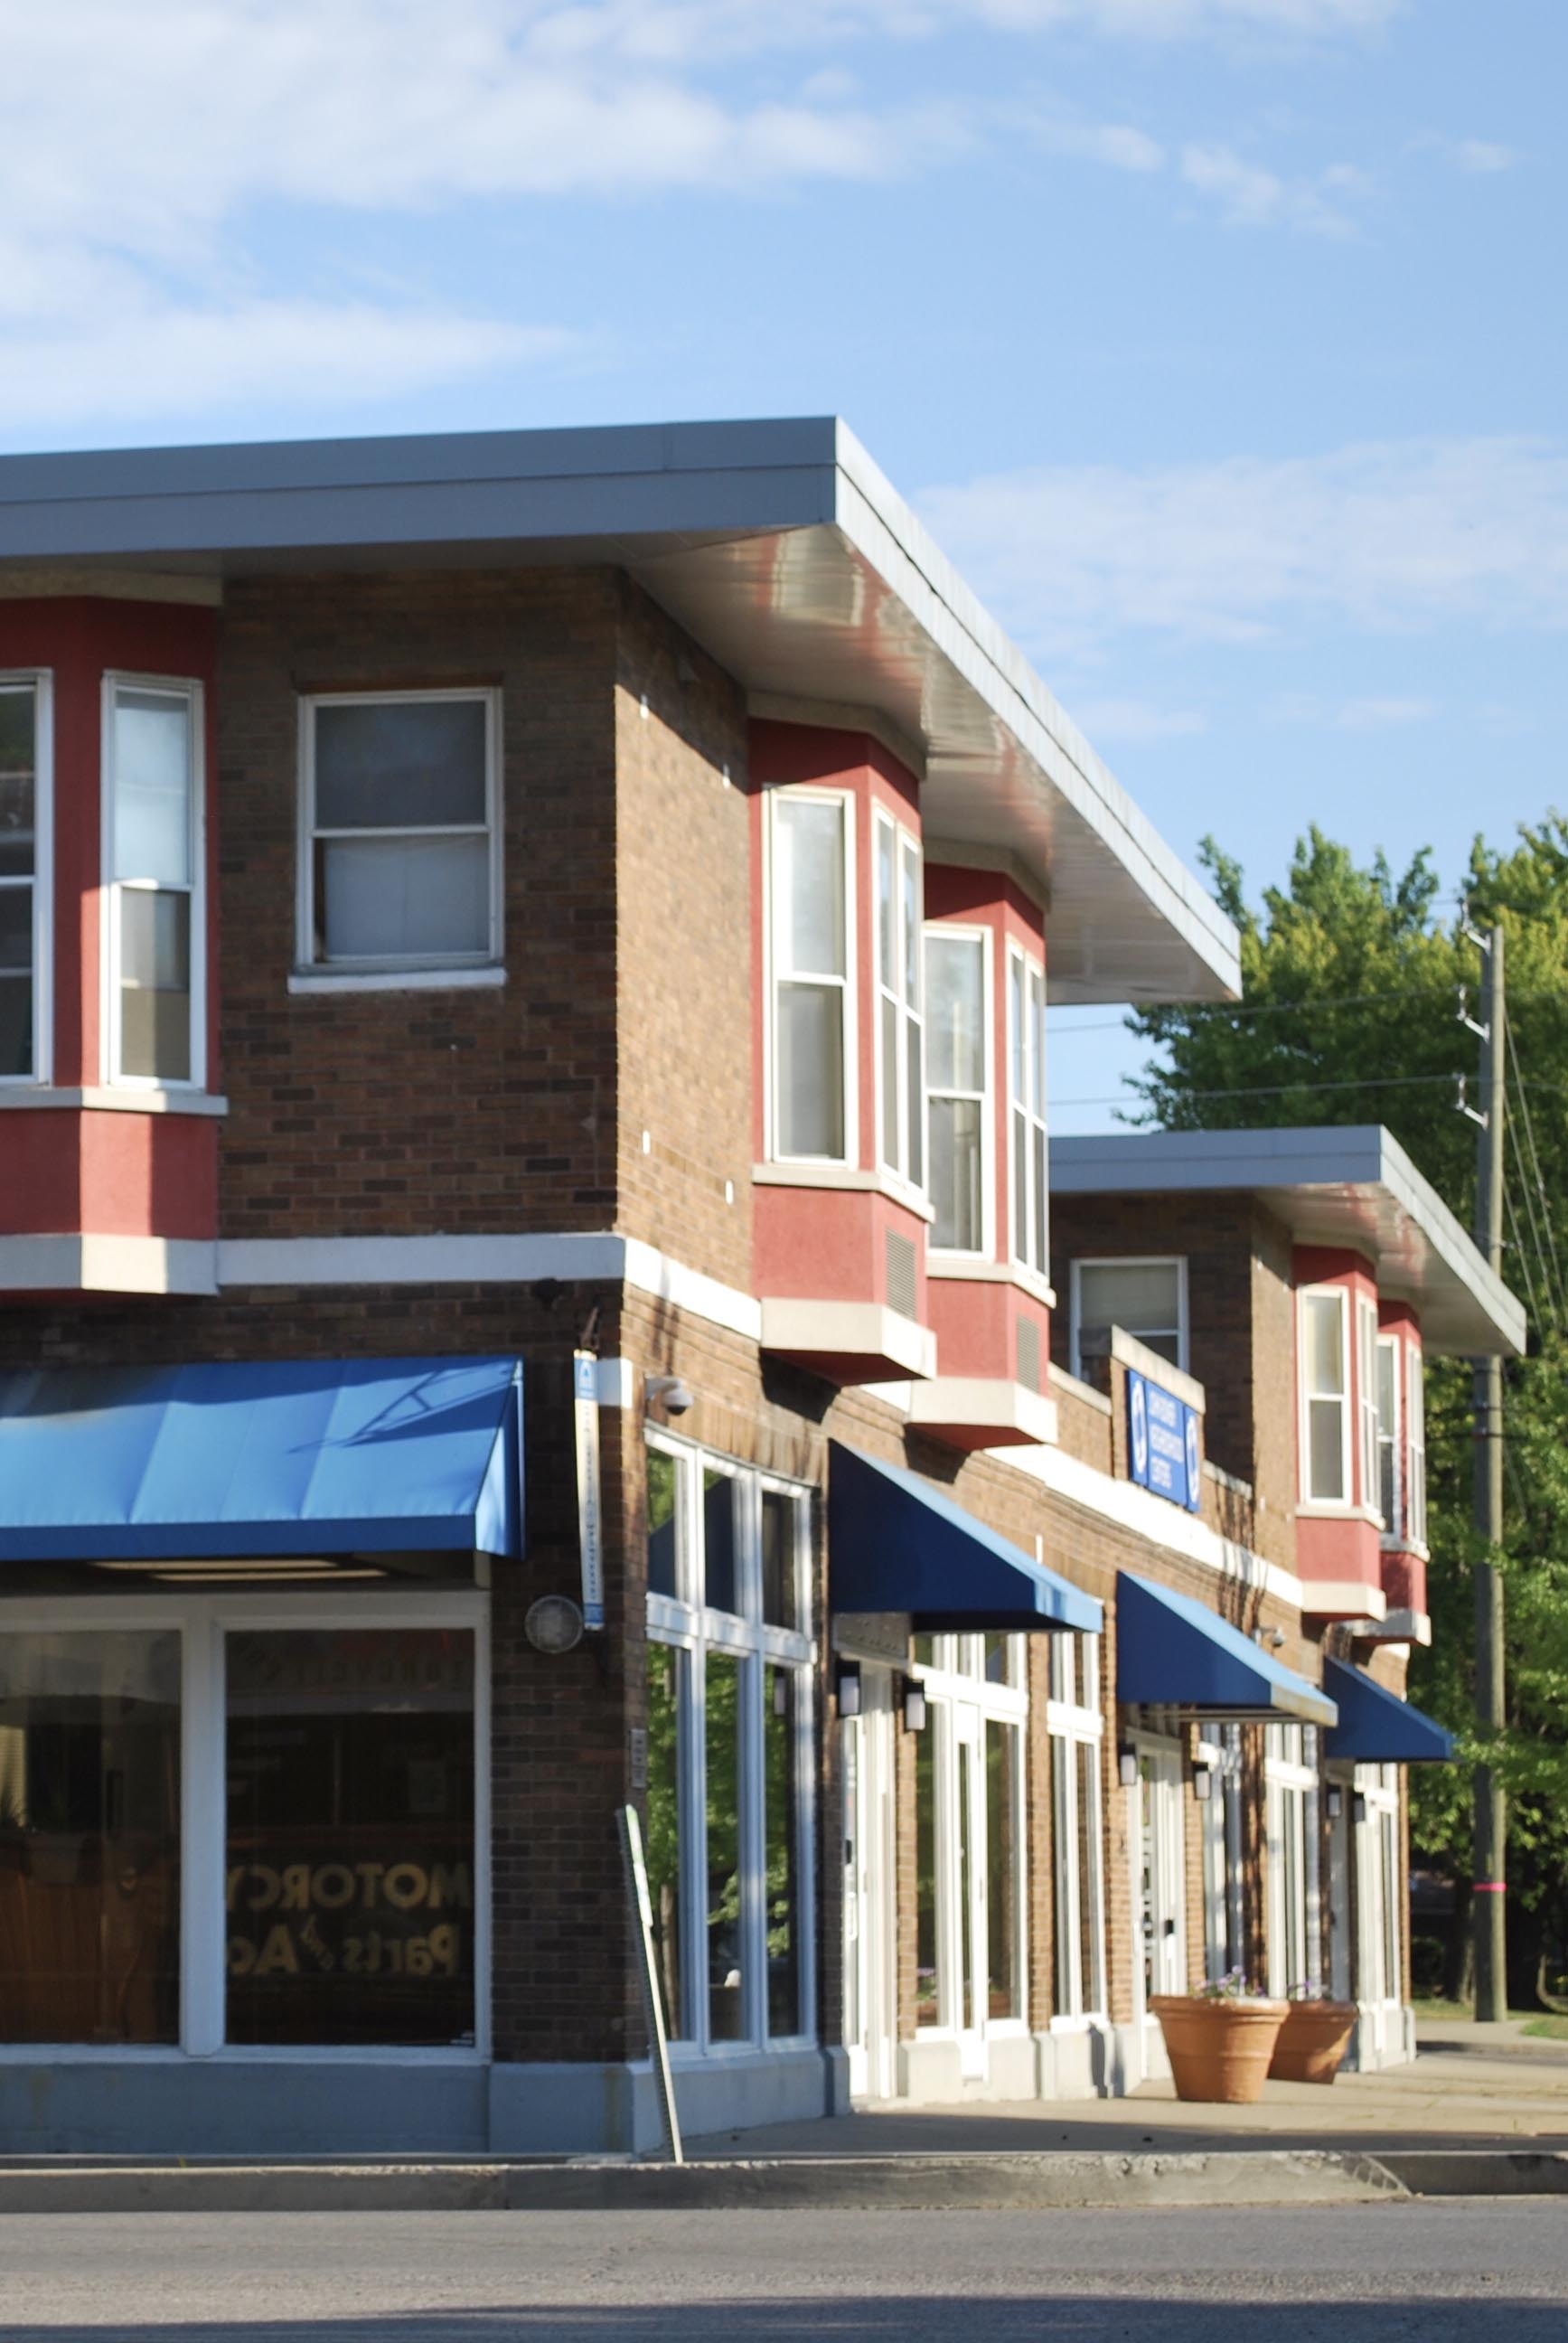
Investment and Revitalization
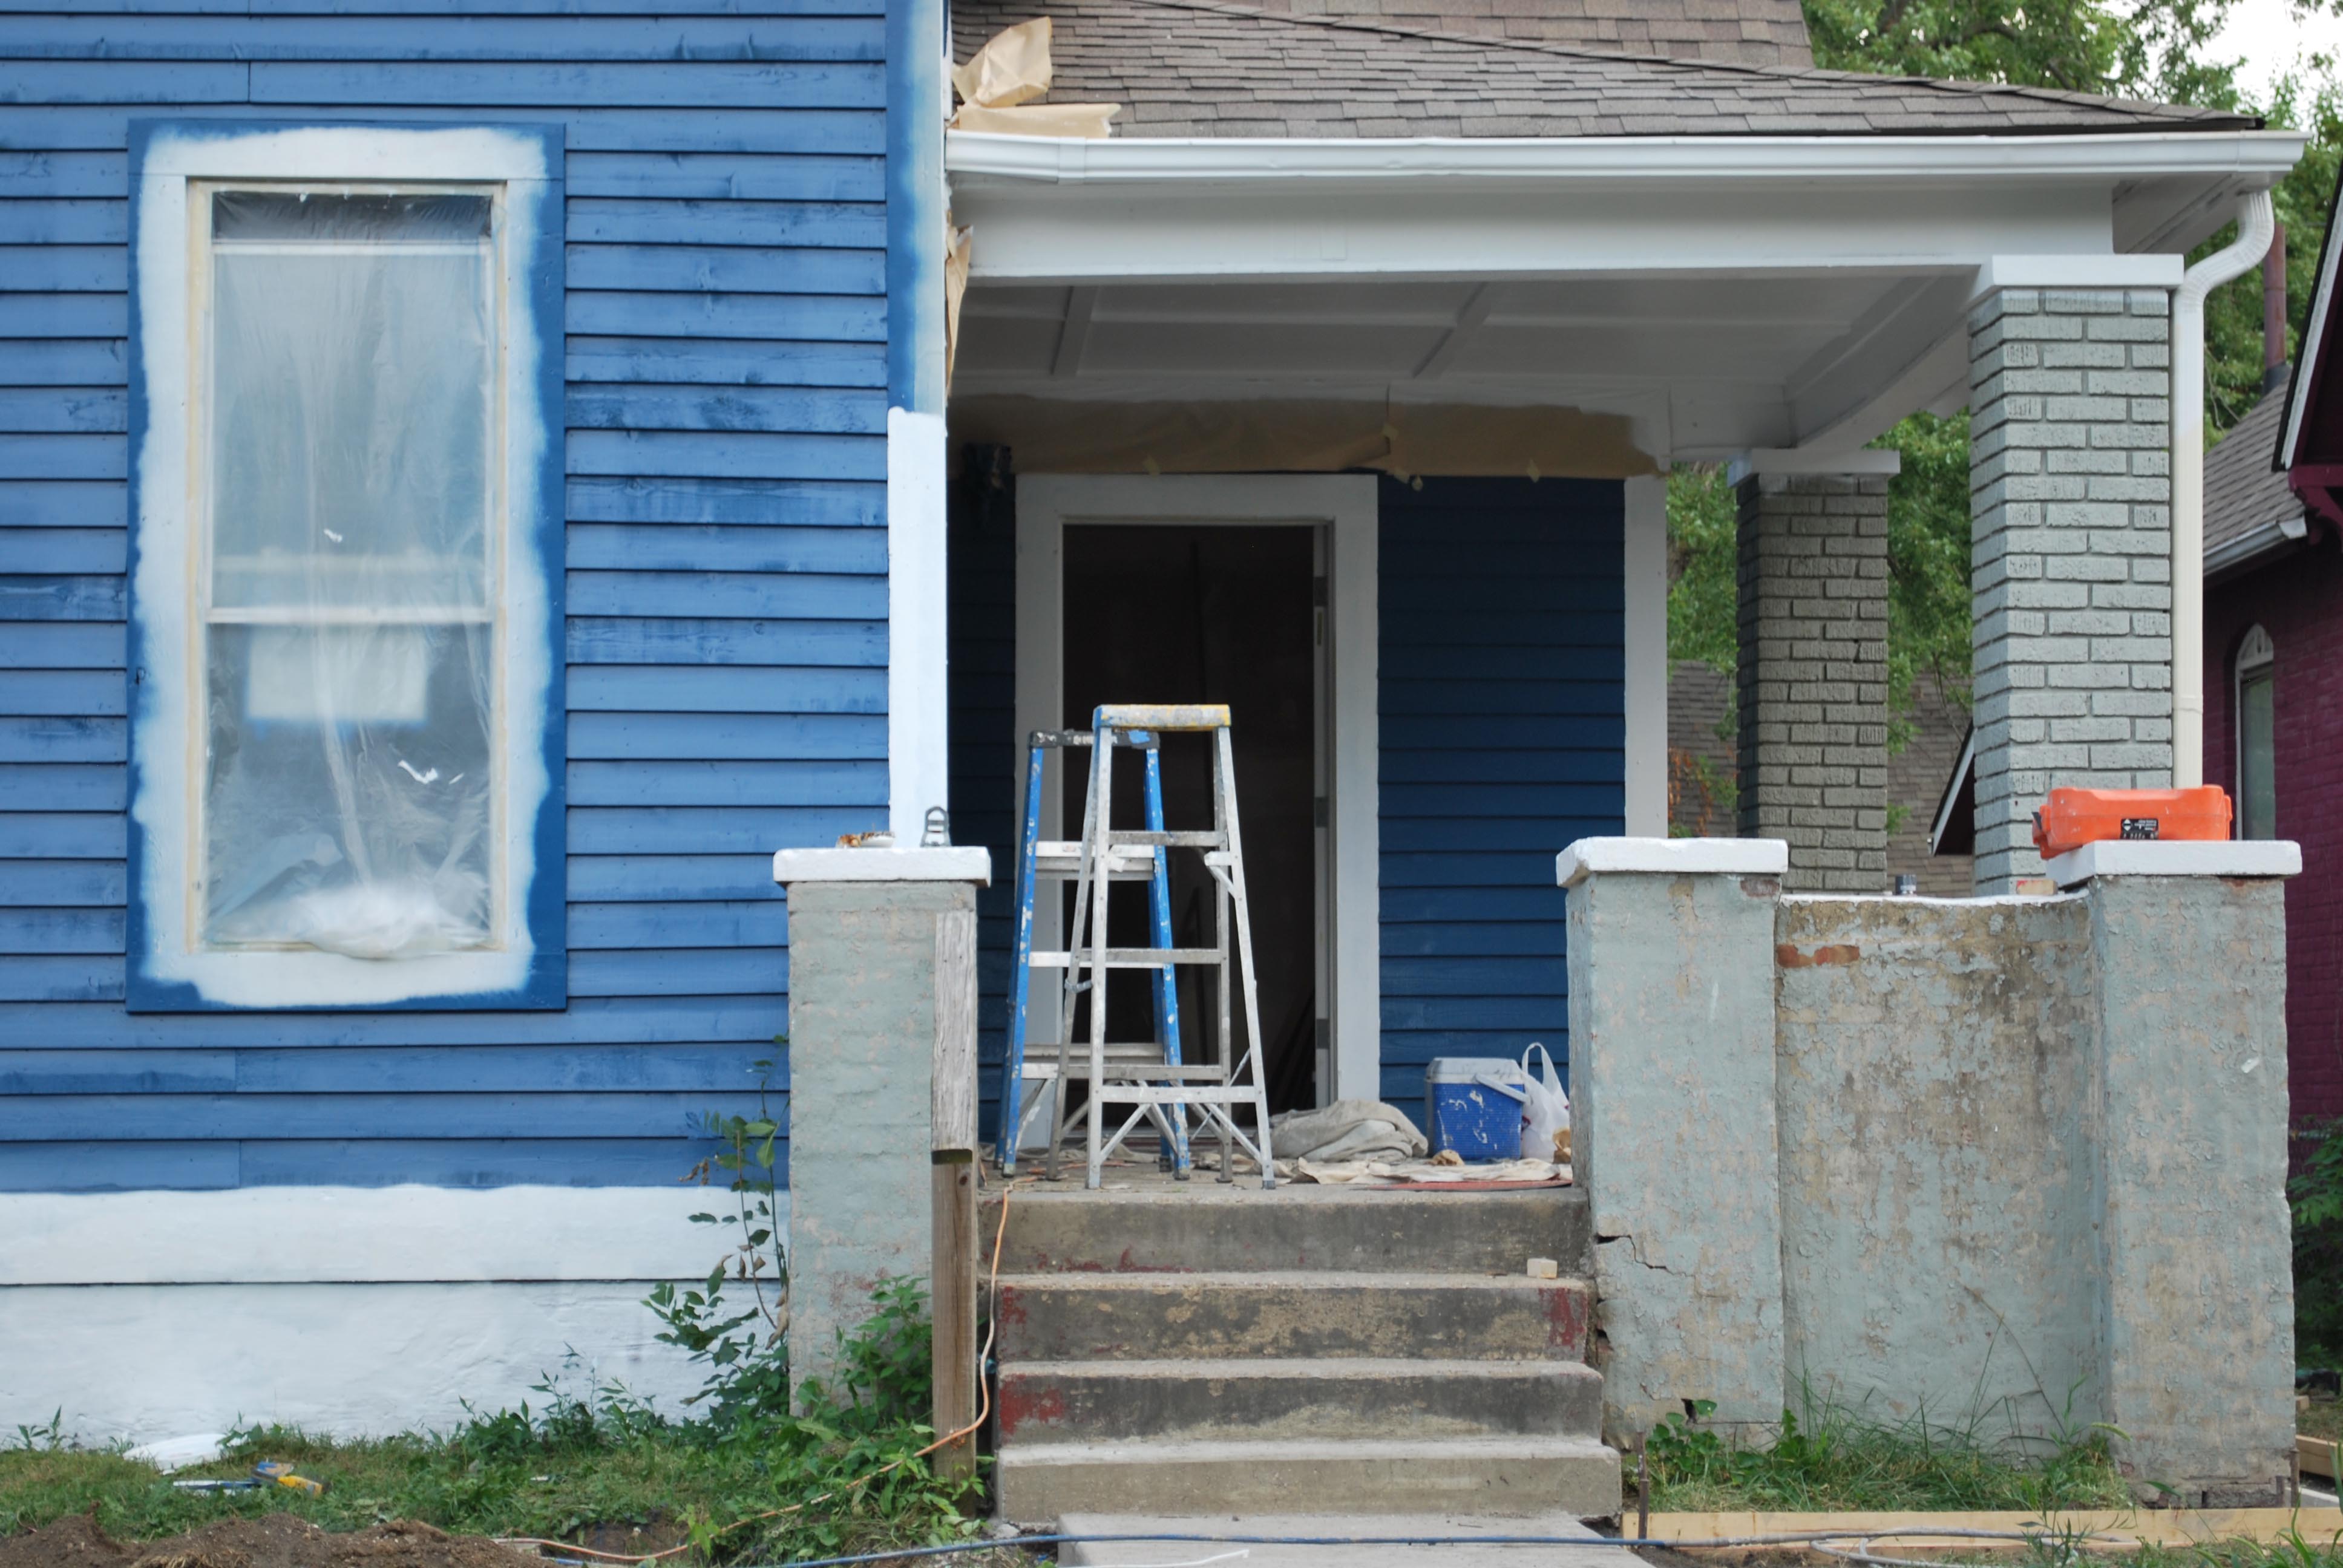
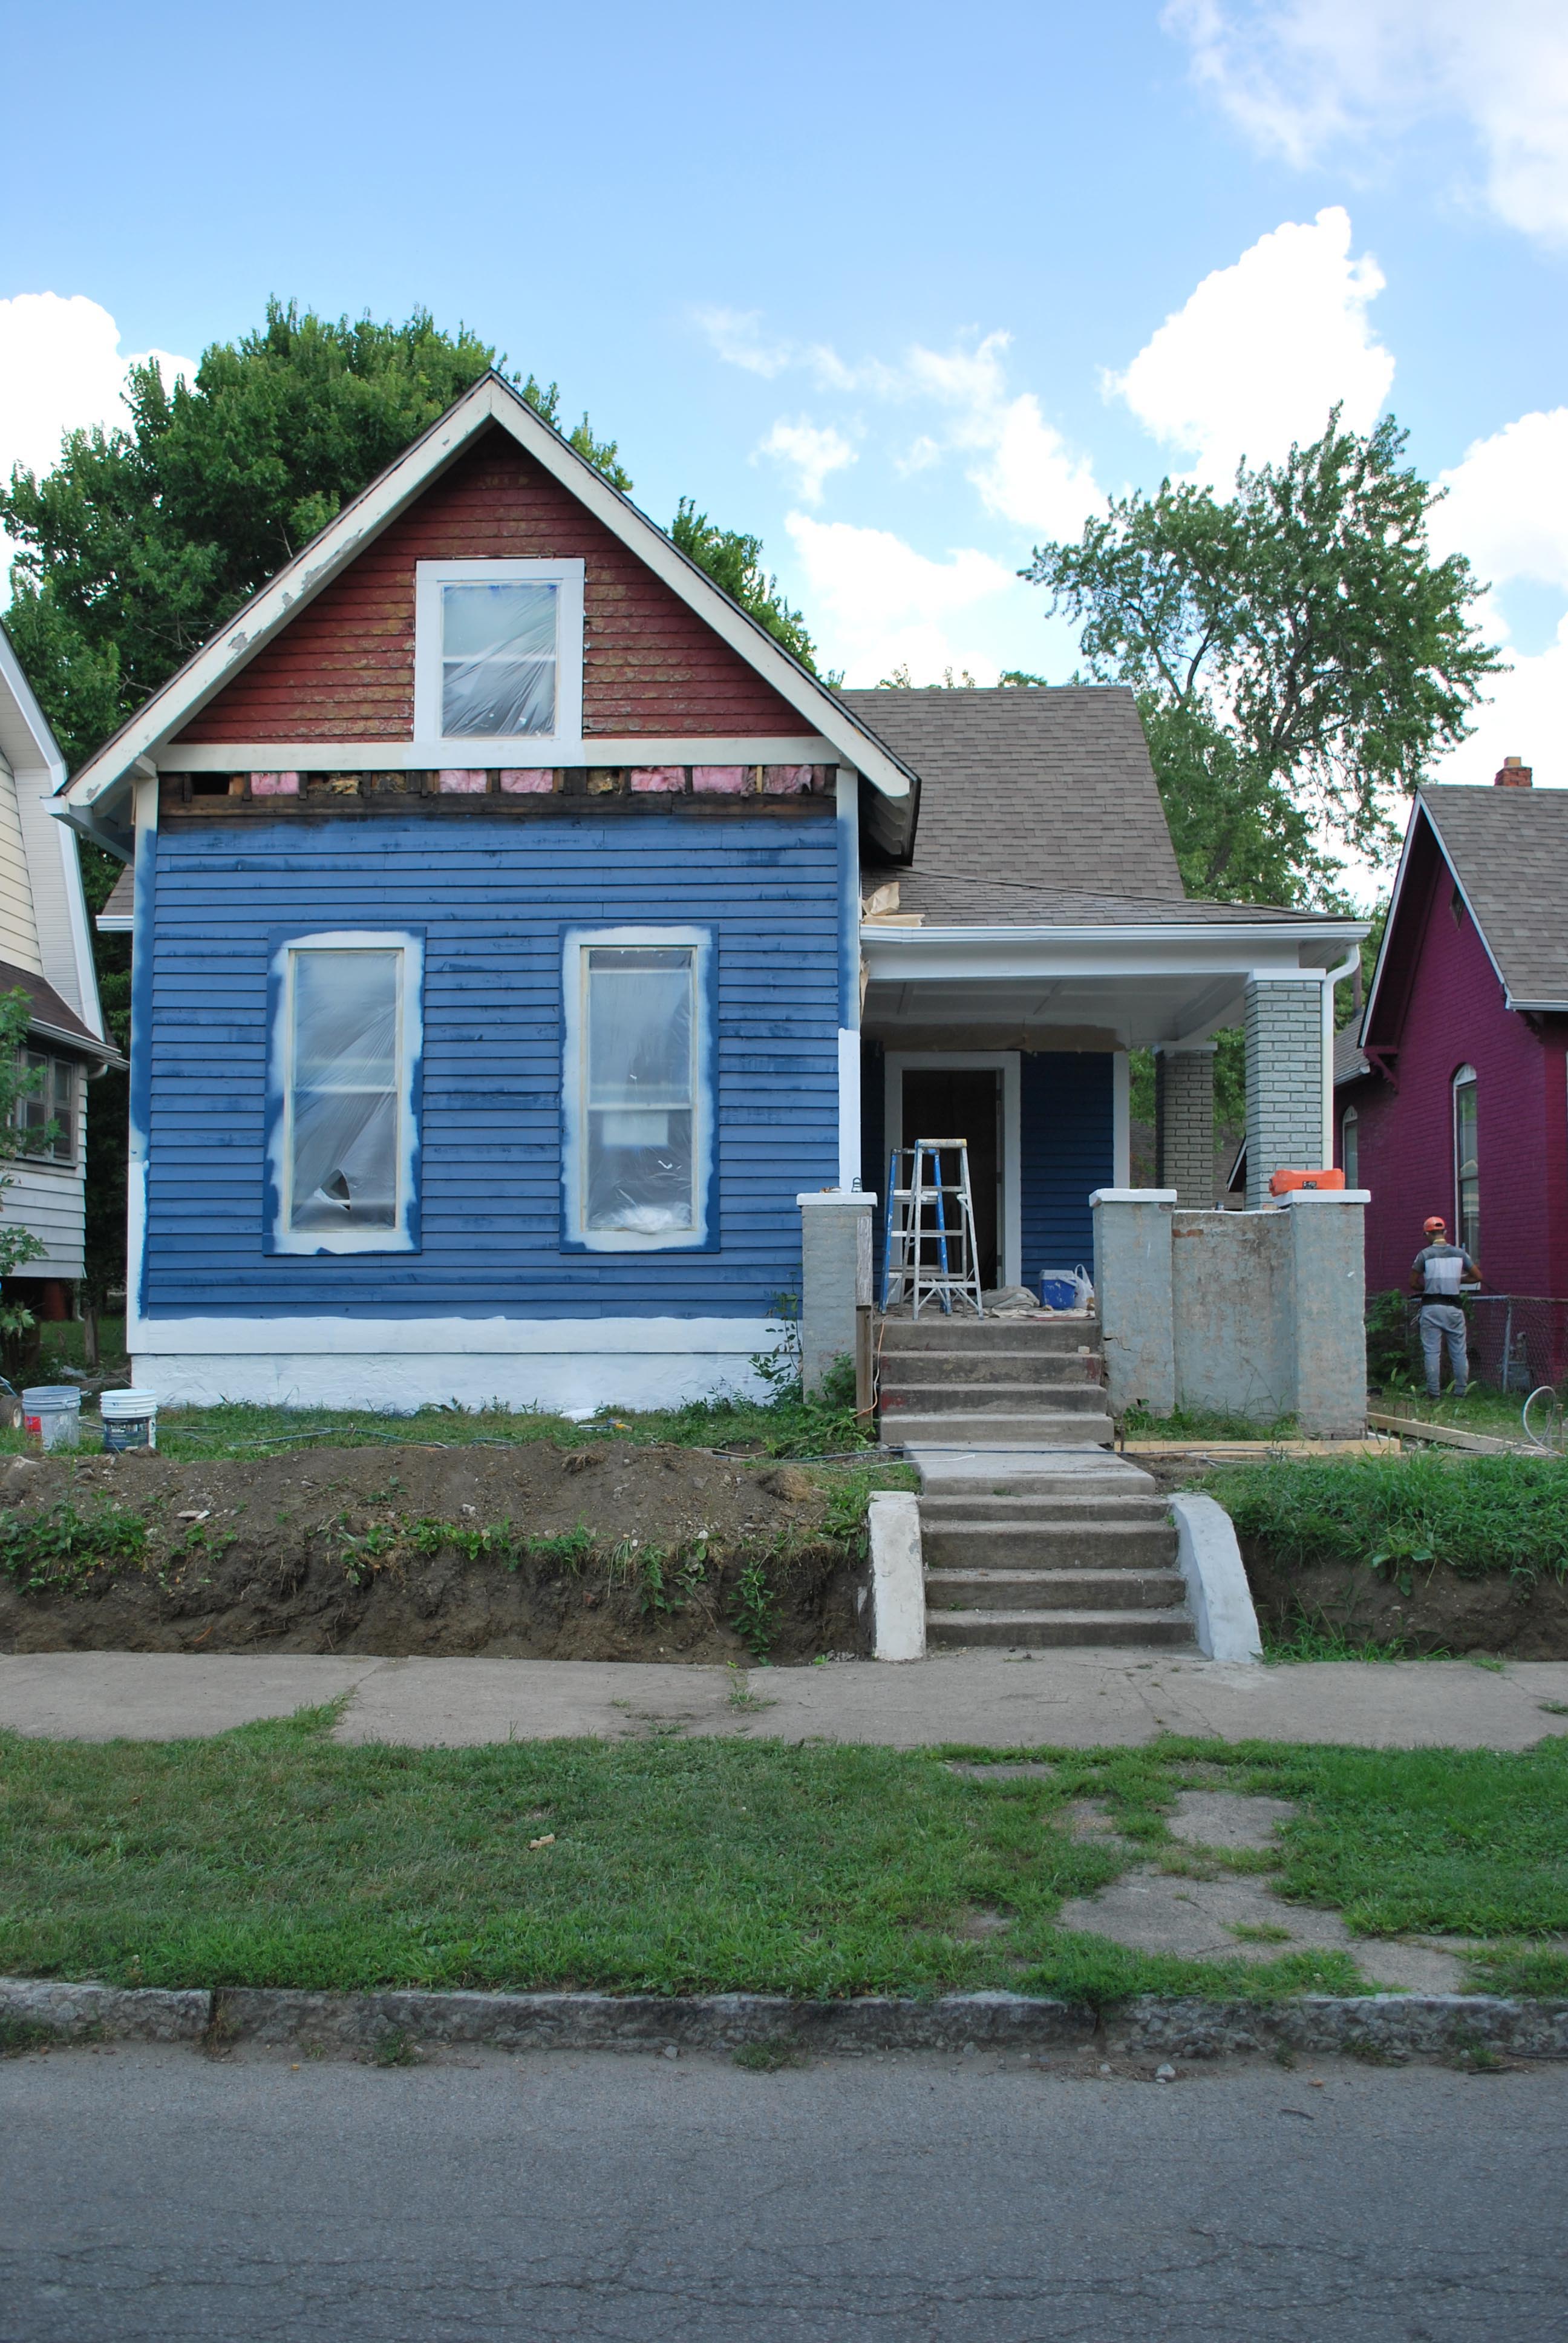
Combining or “stacking” diverse funding sources is core to neighborhood redevelopment strategies. In St. Clair Place, funds from the Neighborhood Stabilization Program (NSP) were the foundation of redevelopment efforts. These funds were combined with other local, federal, and philanthropic funds, including HUD’s HOME program, funding from the areas Housing TIF district, and funding from partners like MIBOR.
NSP is a program of the U.S. Department of Housing and Urban Development (HUD). Indianapolis was awarded $29 million in NSP funds in 2008. A portion of this funding was directed to St. Clair Place and packaged as part of the 2012 Super Bowl Legacy Project. According to Indianapolis’ NSP application, funding was used for acquiring, demolishing, and redeveloping properties, as well as other purposes, and was combined with other federal funds, local funds, and philanthropic funds.
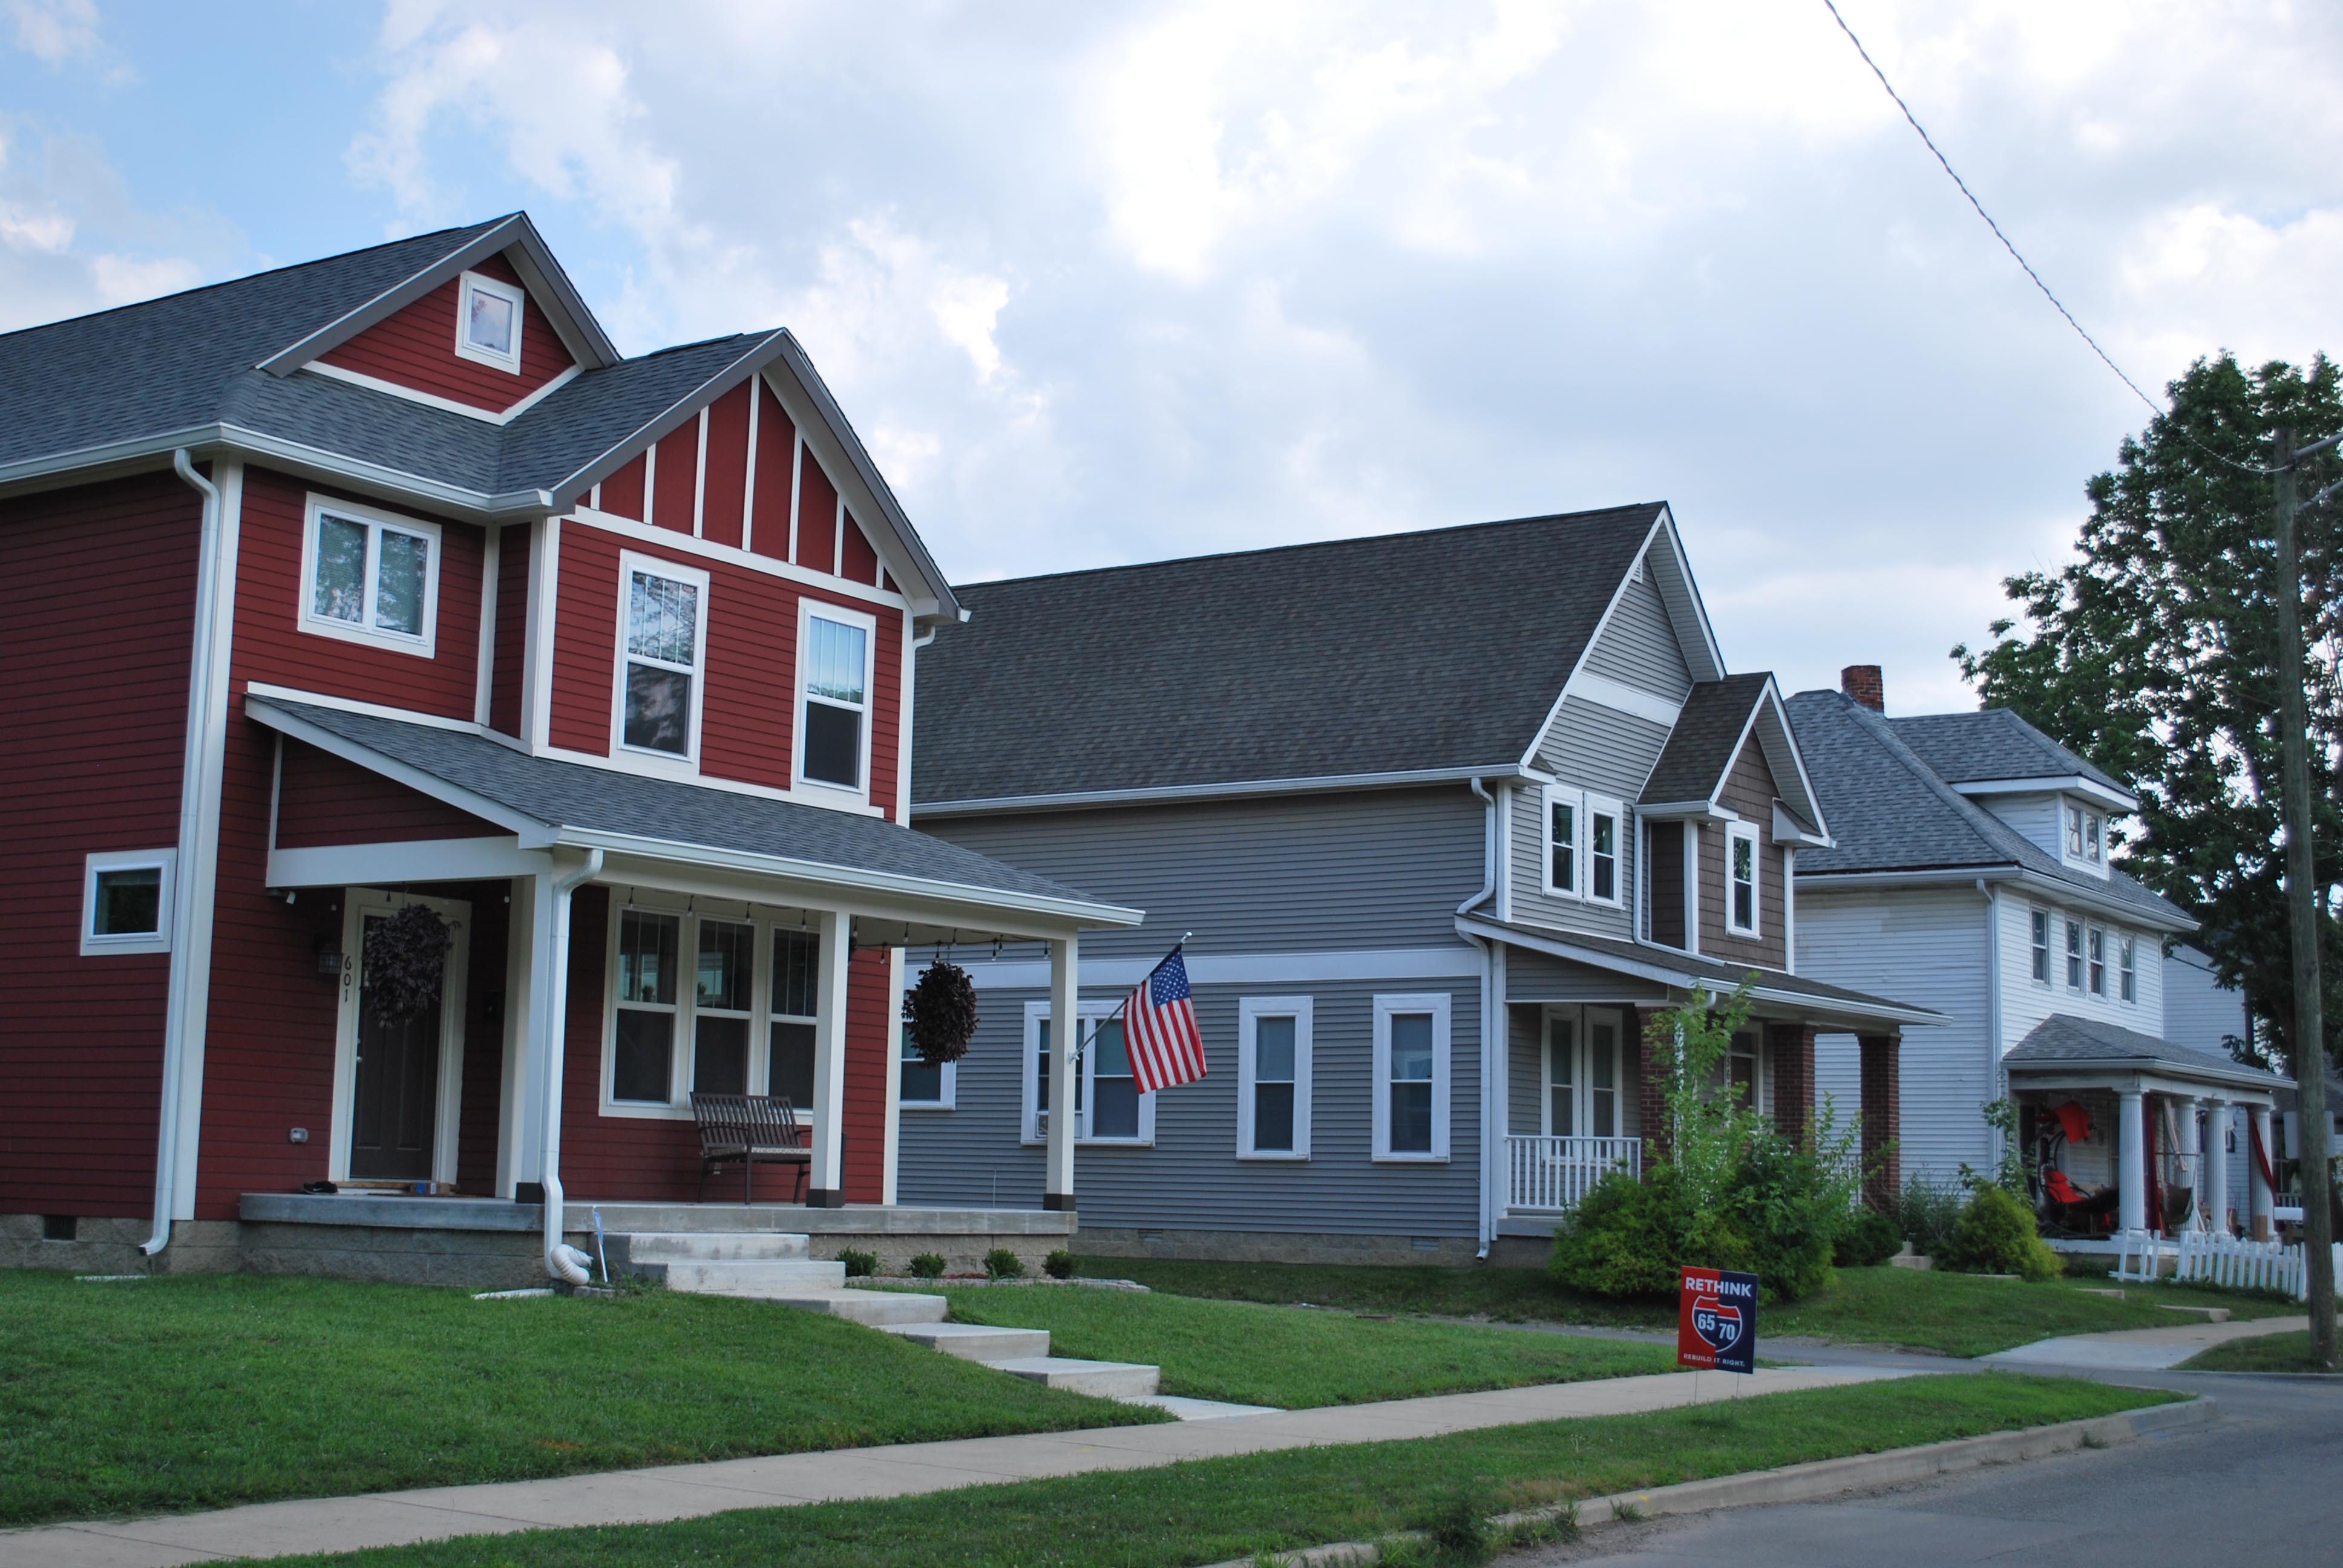
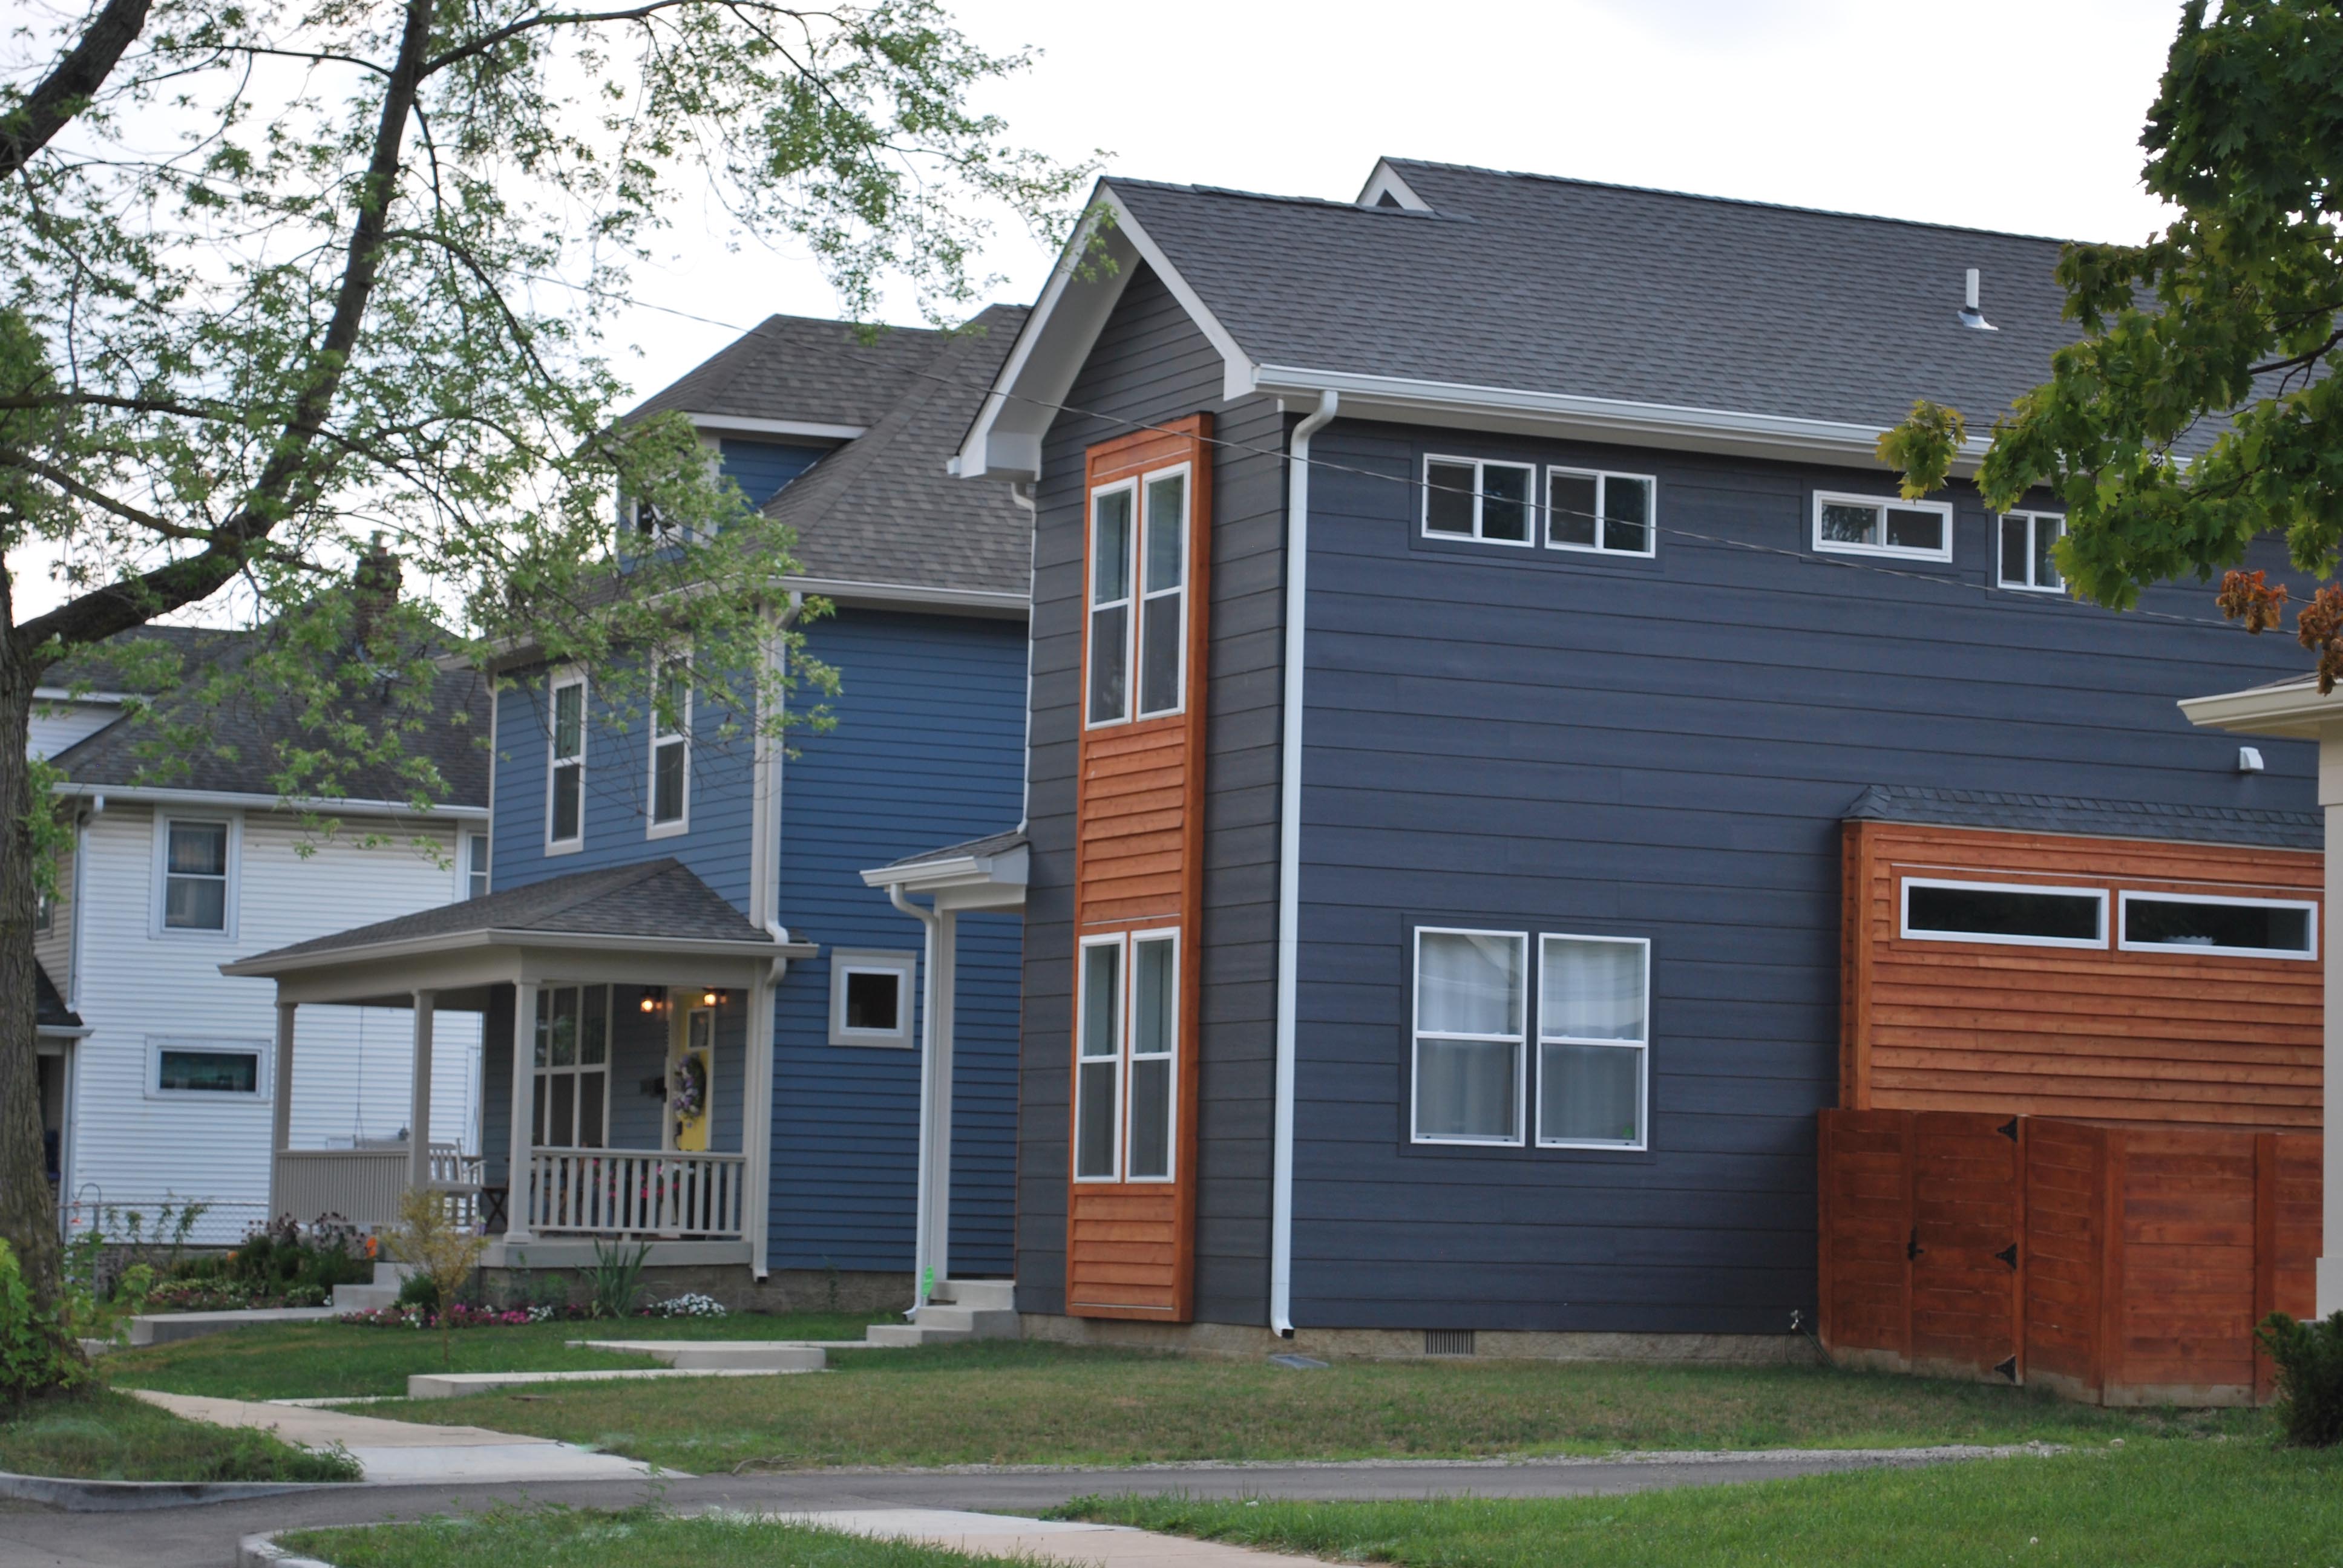
The initial owner-occupied homes were redeveloped along Jefferson Avenue. The average buyer of these first homes had an income near 80 percent of area median income ($54,950 for a four-person household), according to Hay.
NEAR also focused its early efforts on creating affordable rental units, developing 32 units of permanently affordable rental housing. (Often, affordable housing developed with federal funds can eventually be sold at market rates, usually five, ten, or 15 years after development.)
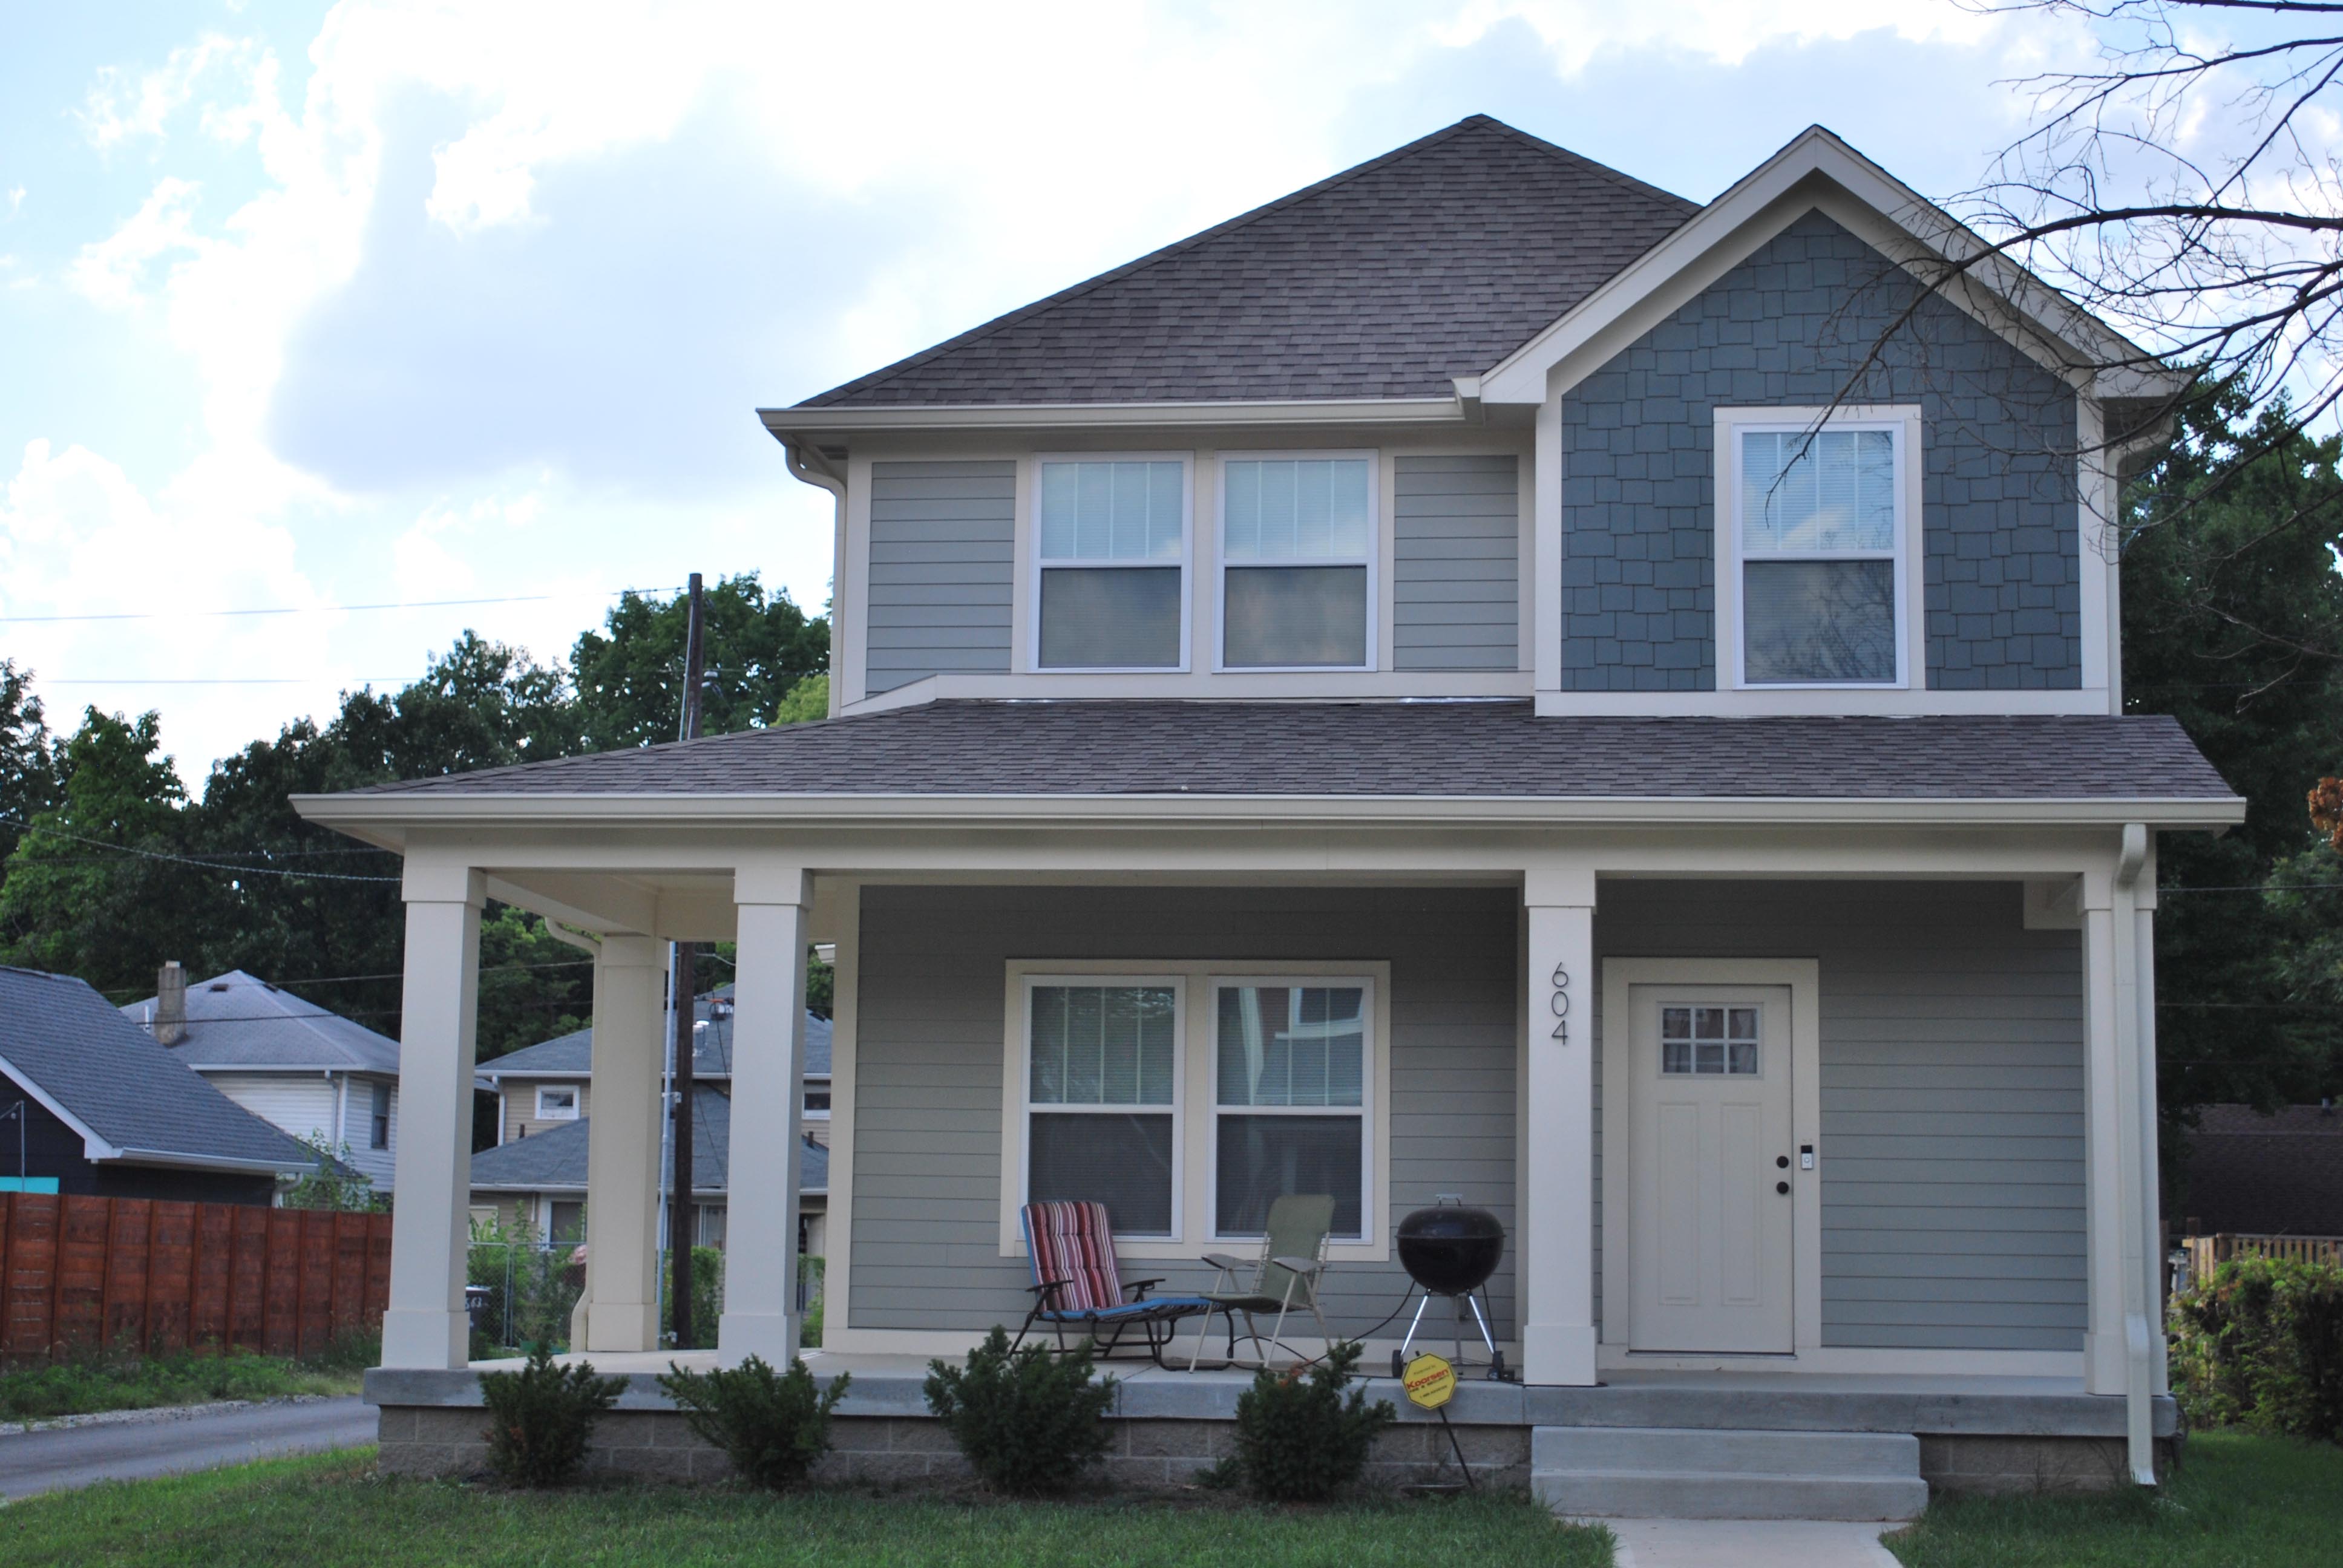
The neighborhood continues to be the focus of investment efforts. In 2014, Indianapolis was awarded funding through HUD’s Blight Elimination Program. A portion of this was used in St. Clair Place. In 2017, NEAR sold nine redeveloped homes at an average price of $123,000, according to Hay. The average buyer earned 65 percent of area median income. (The metro area’s median income was $69,900 in 2017).
Since 2007, Mortgage Amount and Borrower Income are Higher
Median Income of Borrowers
Median Loan Amount
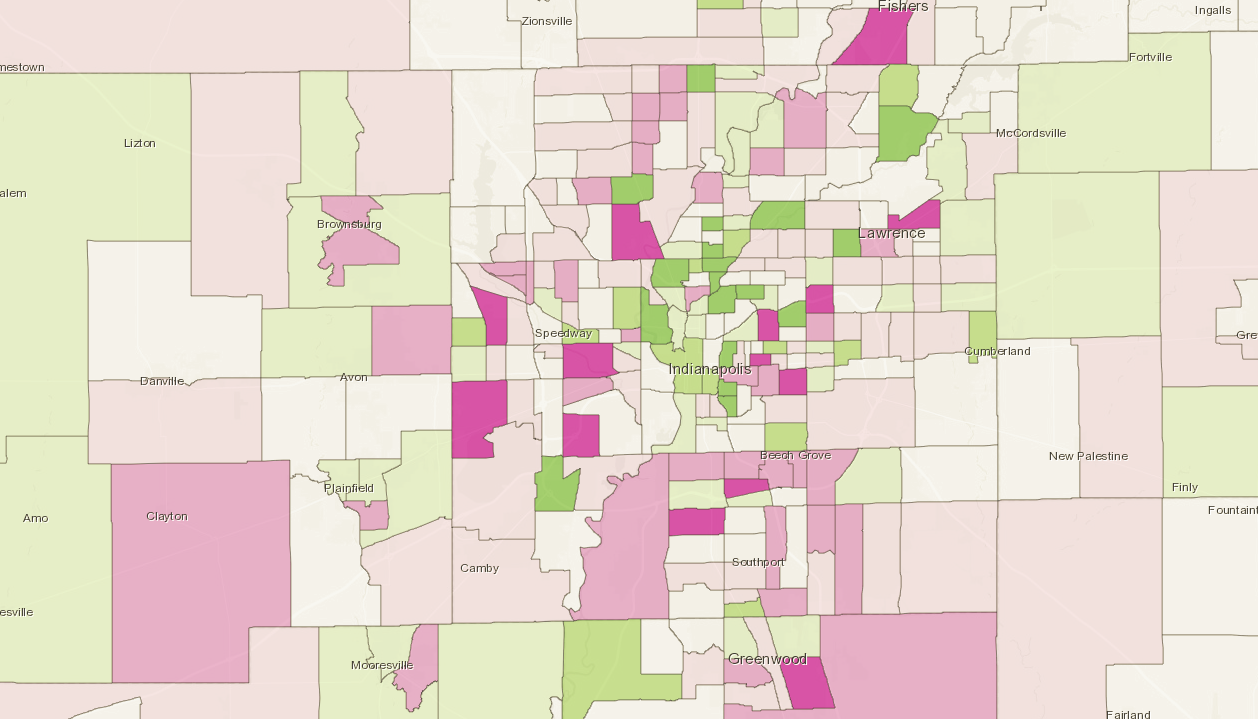
Housing and Economic Indicators Improving, but Vary Widely by Race
After this investment, the real estate market in St. Clair Place is significantly changed. In 2007, there were only ten new mortgages in the neighborhood. By 2017, this had almost tripled to 29 new mortgages. Mortgage activity in Marion County only grew three percent in that period.
Borrowers changed significantly in those ten years. The median borrower in 2007 earned $42,000. In 2017, the median borrower earned $60,000, an increase of 43 percent.
Home values also increased, indicated by increasing mortgage amounts. Median loan value doubled from 2007 to 2017. In 2007, the median borrower took out a mortgage for $72,000. The median new loan in Marion County was $105,000. Ten years later, the median new mortgage amount was $148,000, higher than Marion County’s $139,000.
While this cannot prove the increased housing activity was caused by redevelopment, the data shows much faster growth here than in the county overall. This suggests that housing market growth may be due to more than regional economic trends.
As the housing market grew more active, the white share of borrowers increased. In 2007, four of the ten borrowers were white, but in 2017, 76 percent of the borrowers were white. This is more reflective of systemic discrepancies in home ownership than of neighborhood level issues. While only 53 percent of Marion County residents are white, 68 percent of new loans are to white borrowers. And while 63.2 percent of white households in Marion County own their home, only 34.3 percent of black households and 32.6 percent of Latino households do.
In St. Clair Place, the difference in homeownership is very stark. Fifty-eight percent of white households own their home. Only 6.9 percent of black households own their homes, and 44 percent of Latino households. Overall homeownership has increased, from 27.0 percent in 2010 to 36.8 in 2016. Homeownership has not increased among black households, however (2016 American Community Survey).
While the neighborhood still faces very low home-ownership rates among black households, poverty has been dramatically reduced among St. Clair Place’s black population. Overall poverty fell in the neighborhood from 56.6 percent in 2010 to 26.8 percent in 2016. That decline was driven by a drop in poverty among black residents. In 2010, 93 percent of black residents were in poverty. By 2016, that rate fell to 26 percent.
Educational attainment also improved significantly from 2010 to 2016. The college-educated rate grew from three percent 13 percent. This rate grew from 0.0 to 6.7 percent for Latino residents, 0.0 to 4.3 percent for black residents, and 4.9 to 20.6 percent for white residents.
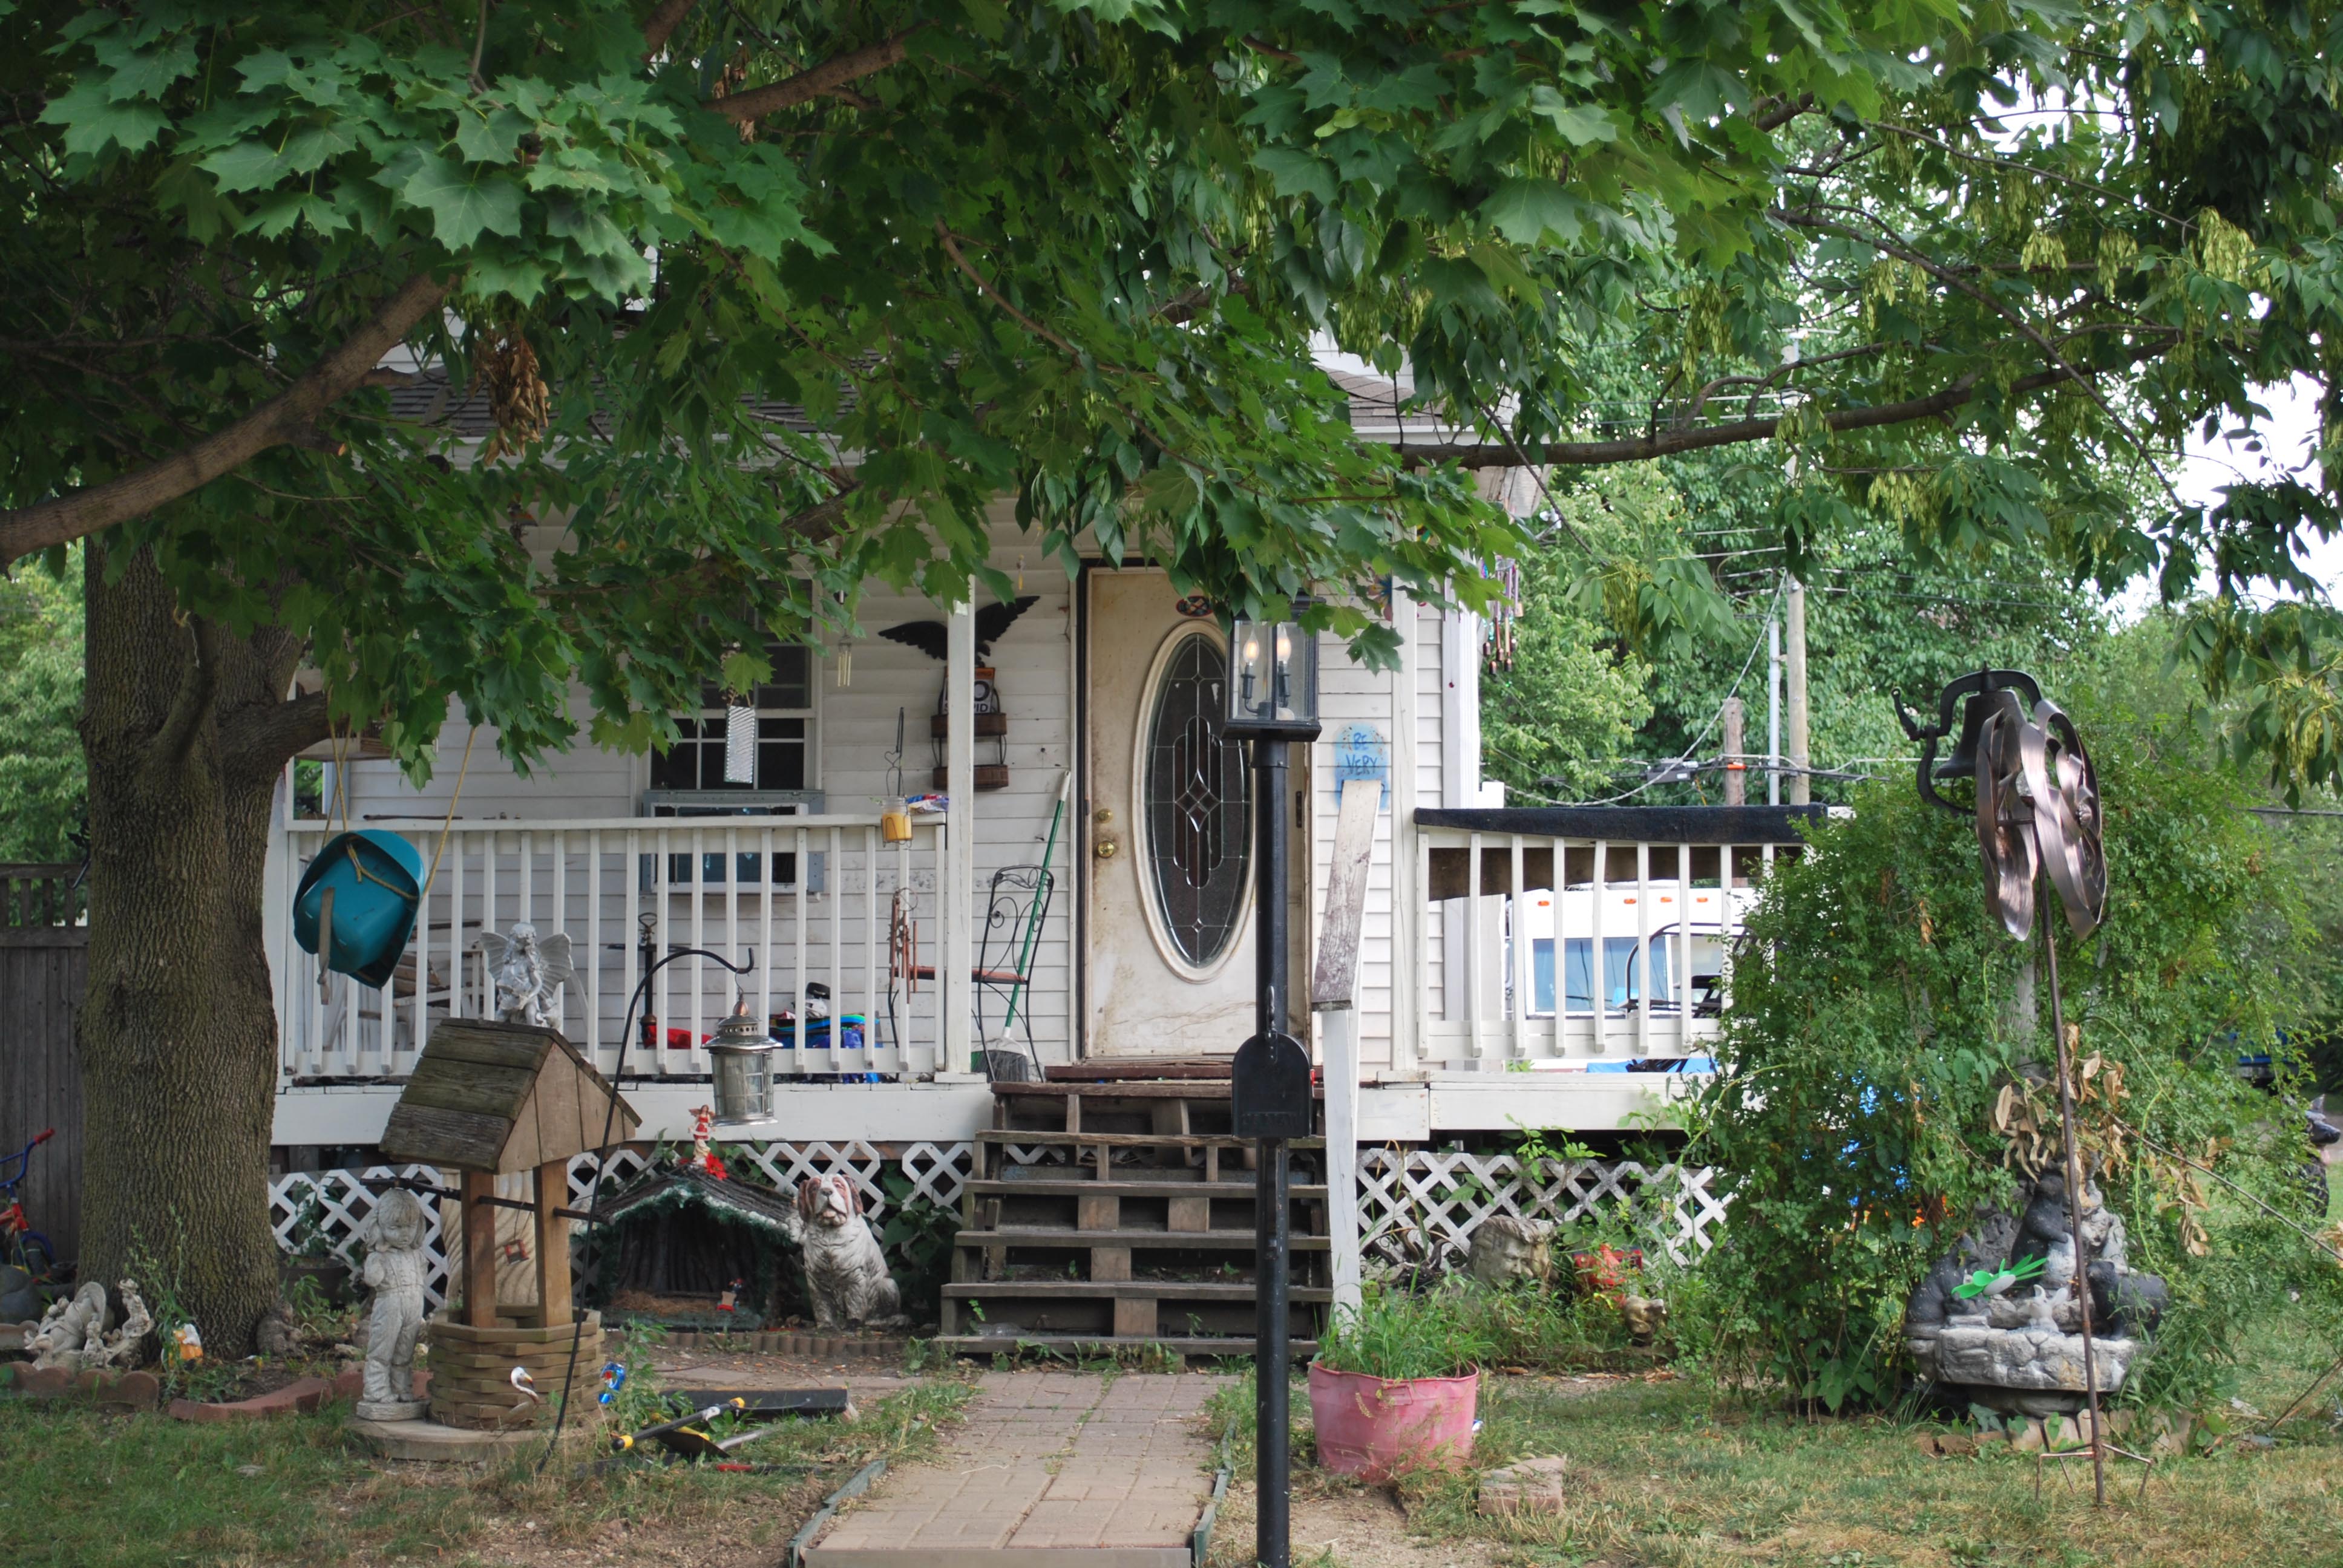
To address community development in a way that bridges social groups, Hay understands it is important to consider renters in programs and include them in decision-making. To accomplish this, NEAR has established a Renting Neighbors Task Force. This is also why some of the first redevelopment in the neighborhood was the production of 32 affordable rental units. Rental homes like this are an alternative to the often low-quality rental stock otherwise available. For example, a subdivided duplex that Hay refers to as a “flophouse” was rented at $75 per week for a room. The property has since been acquired by NEAR for redevelopment.
Connecting homeowners and renters also means bridging racial, social, and cultural divides. There can sometimes be social conflicts when low-income communities are transformed into mixed-income neighborhoods. Some of these issues have been studied in relation to HUD’s HOPE VI redevelopment projects, which redeveloped low-income housing projects into medium-density, mixed-income housing.
Aware of this important dimension of community development, NEAR develops “social infrastructure” in St. Clair Place by organizing porch parties and helping with festivals like the annual Feast of Lanterns, according to Hay. He says it is important for new neighbors to get to know the current residents of the neighborhood. As he tells new buyers at closing, “You can’t just live to yourself in this neighborhood. You have to be open and embrace diversity.”
See How Your Neighborhood Has Changed
Find more interactive content from our series on neighborhood change.
No Results Found
The page you requested could not be found. Try refining your search, or use the navigation above to locate the post.
Next Up
 Income Inequality High Where Golden Hill and Northwest Indianapolis Converge
In the area where wealthy Golden Hills converges with the working-class neighborhoods of Northwest Indianapolis, income inequality is high and increasing. The area is also experiencing a growth of white households above the median income.
 Explore Changes in your Neighborhood with this SAVI App
 Changes in Indy’s Historic Black Neighborhoods
In the 1970s, 4,000 residents left this nearly all-black neighborhood. Why? An increasingly desegregated housing market and closure of one of the country’s first public housing projects.
 Story Map: Race and Migration Since 1970
In 1970, half of the region’s Black population lived in 12 square miles north of downtown Indianapolis. As Black residents moved into ’60s suburban communities, 120,000 White residents left the city’s core for newer suburbs.