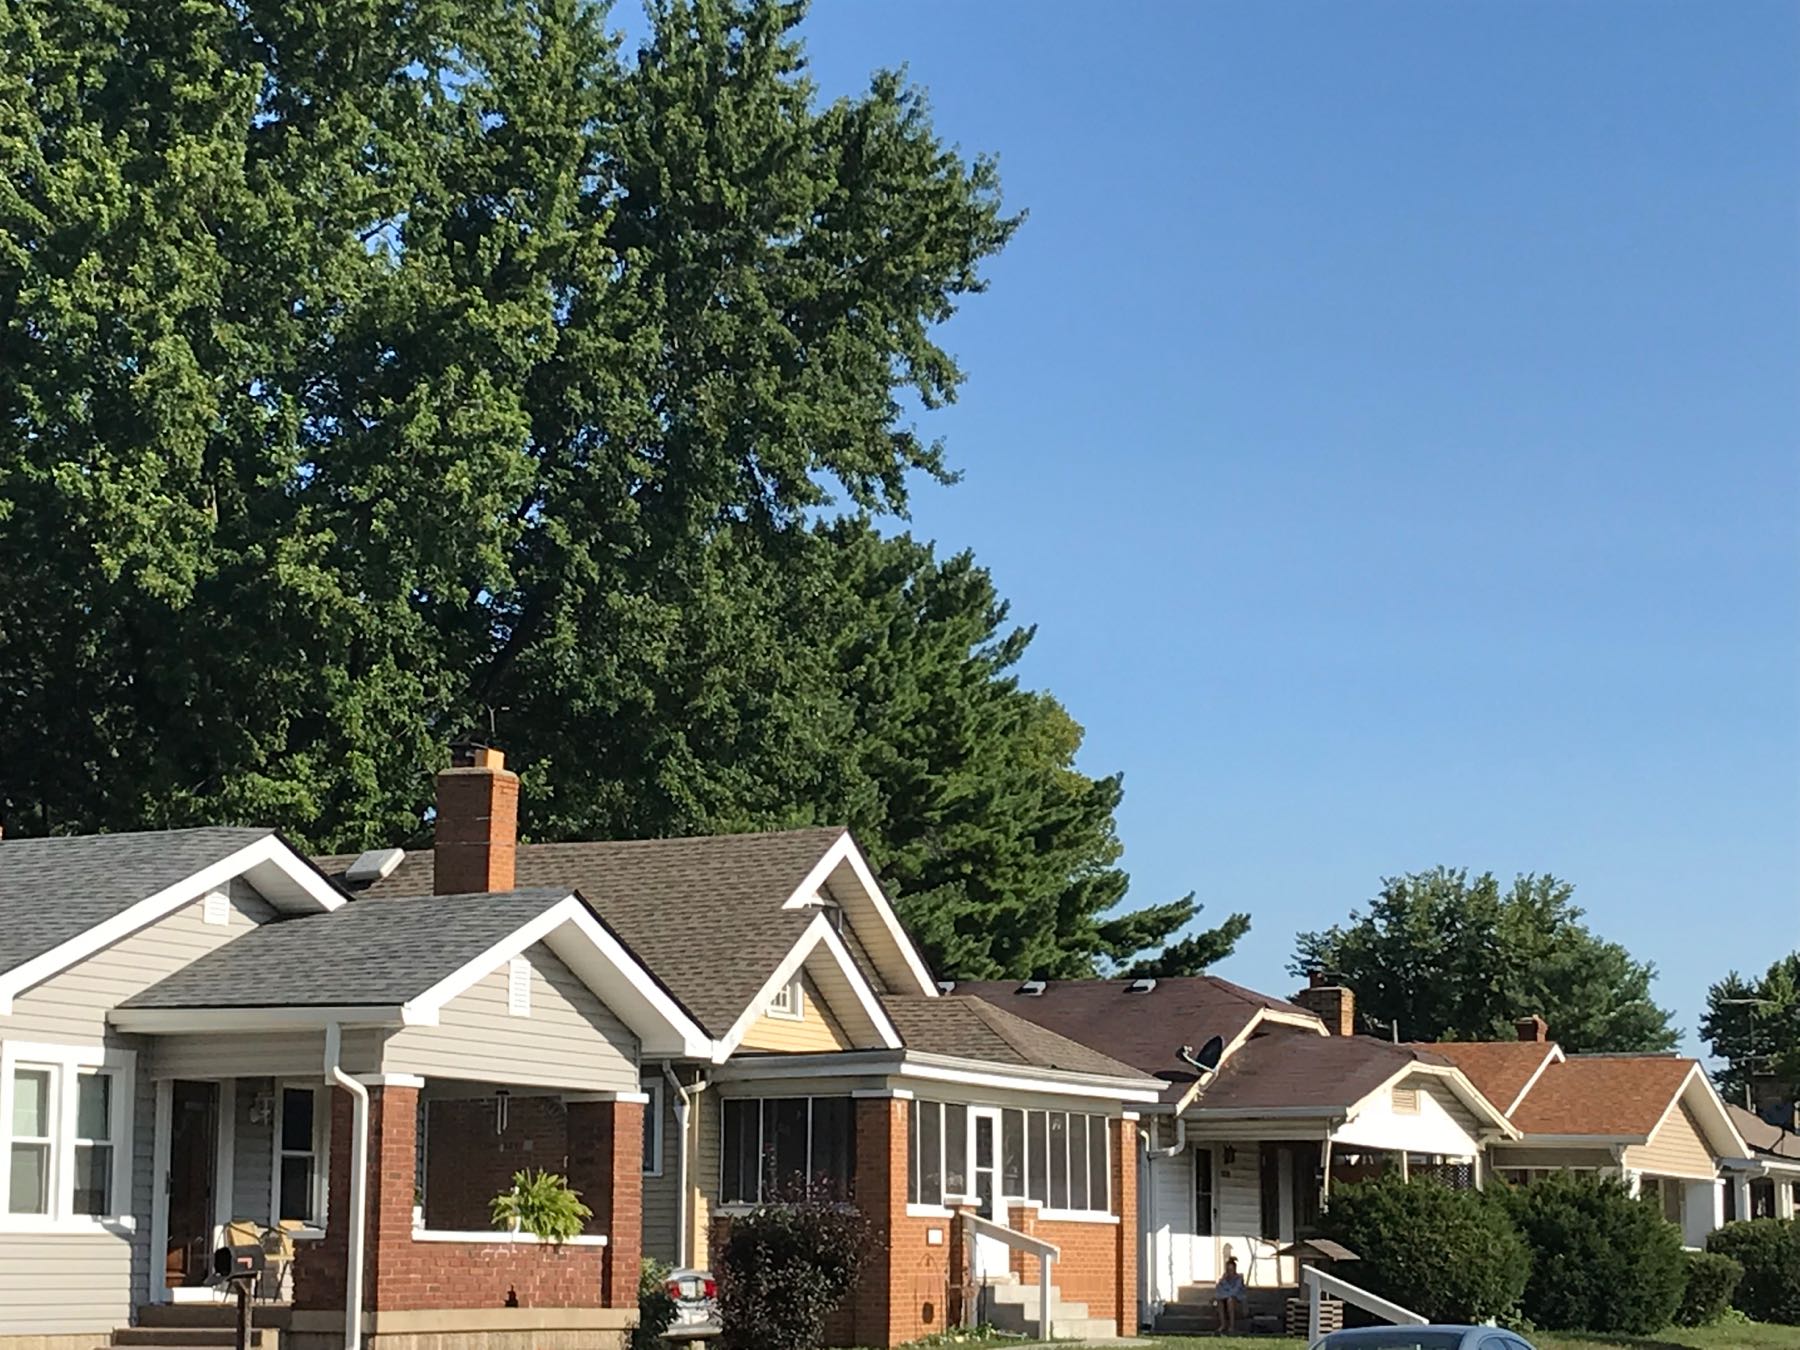
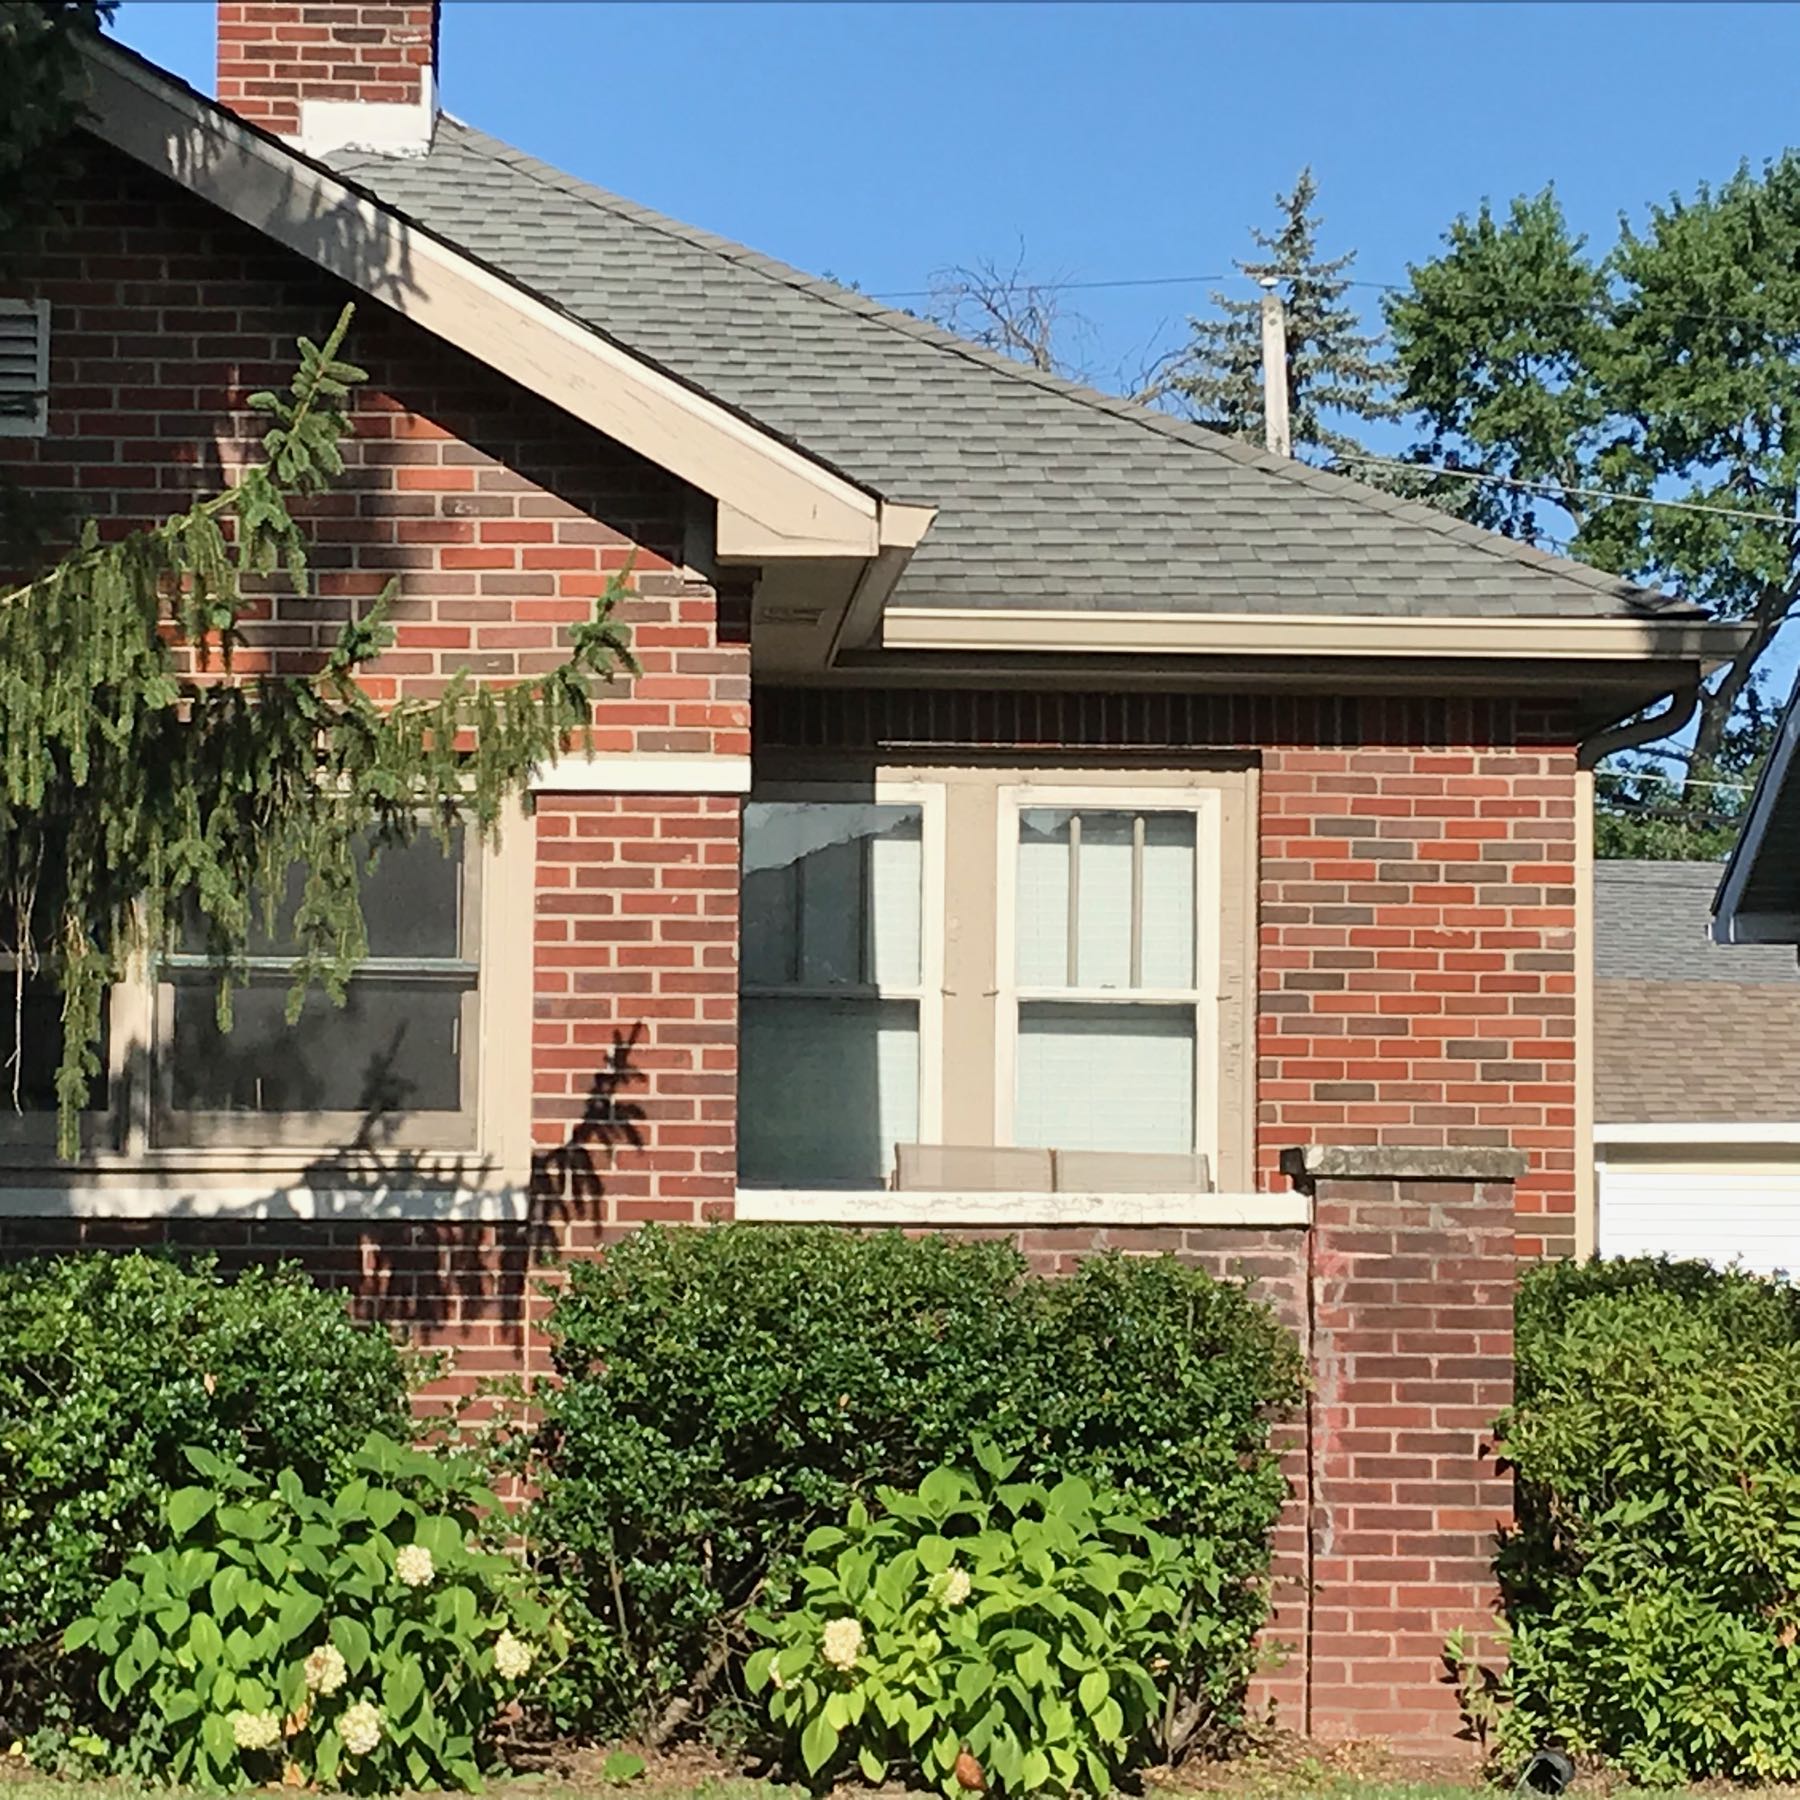
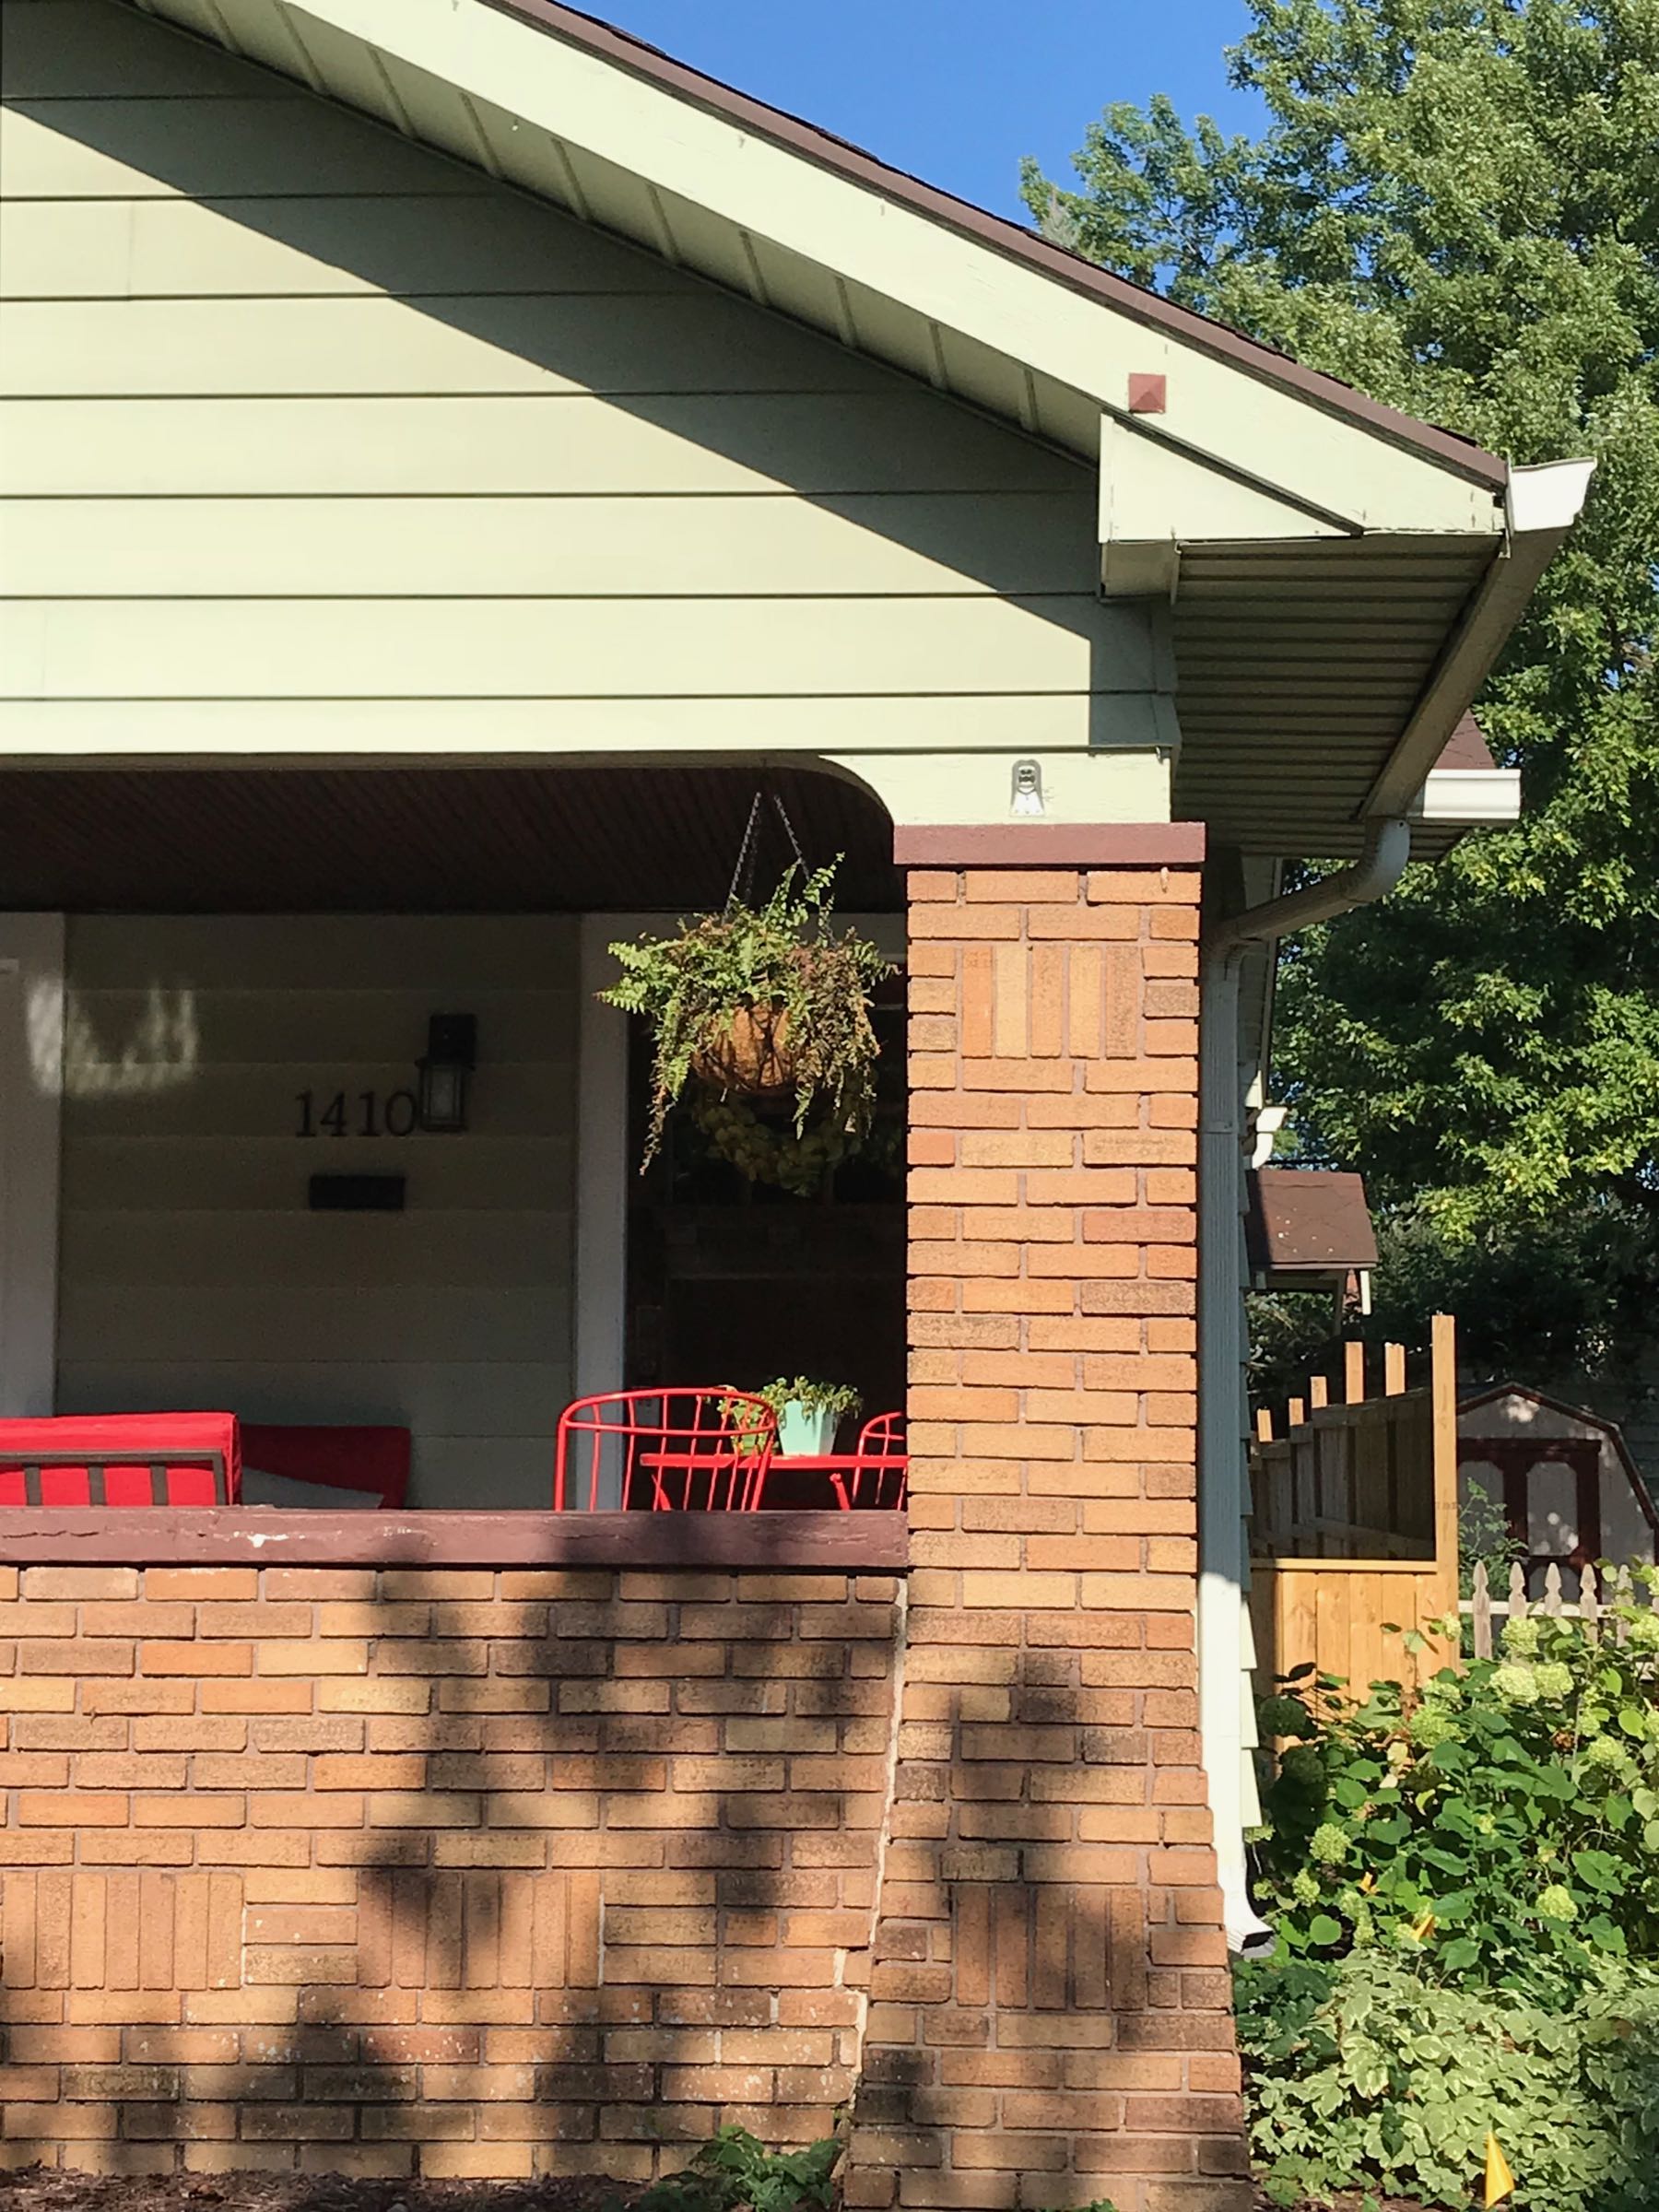
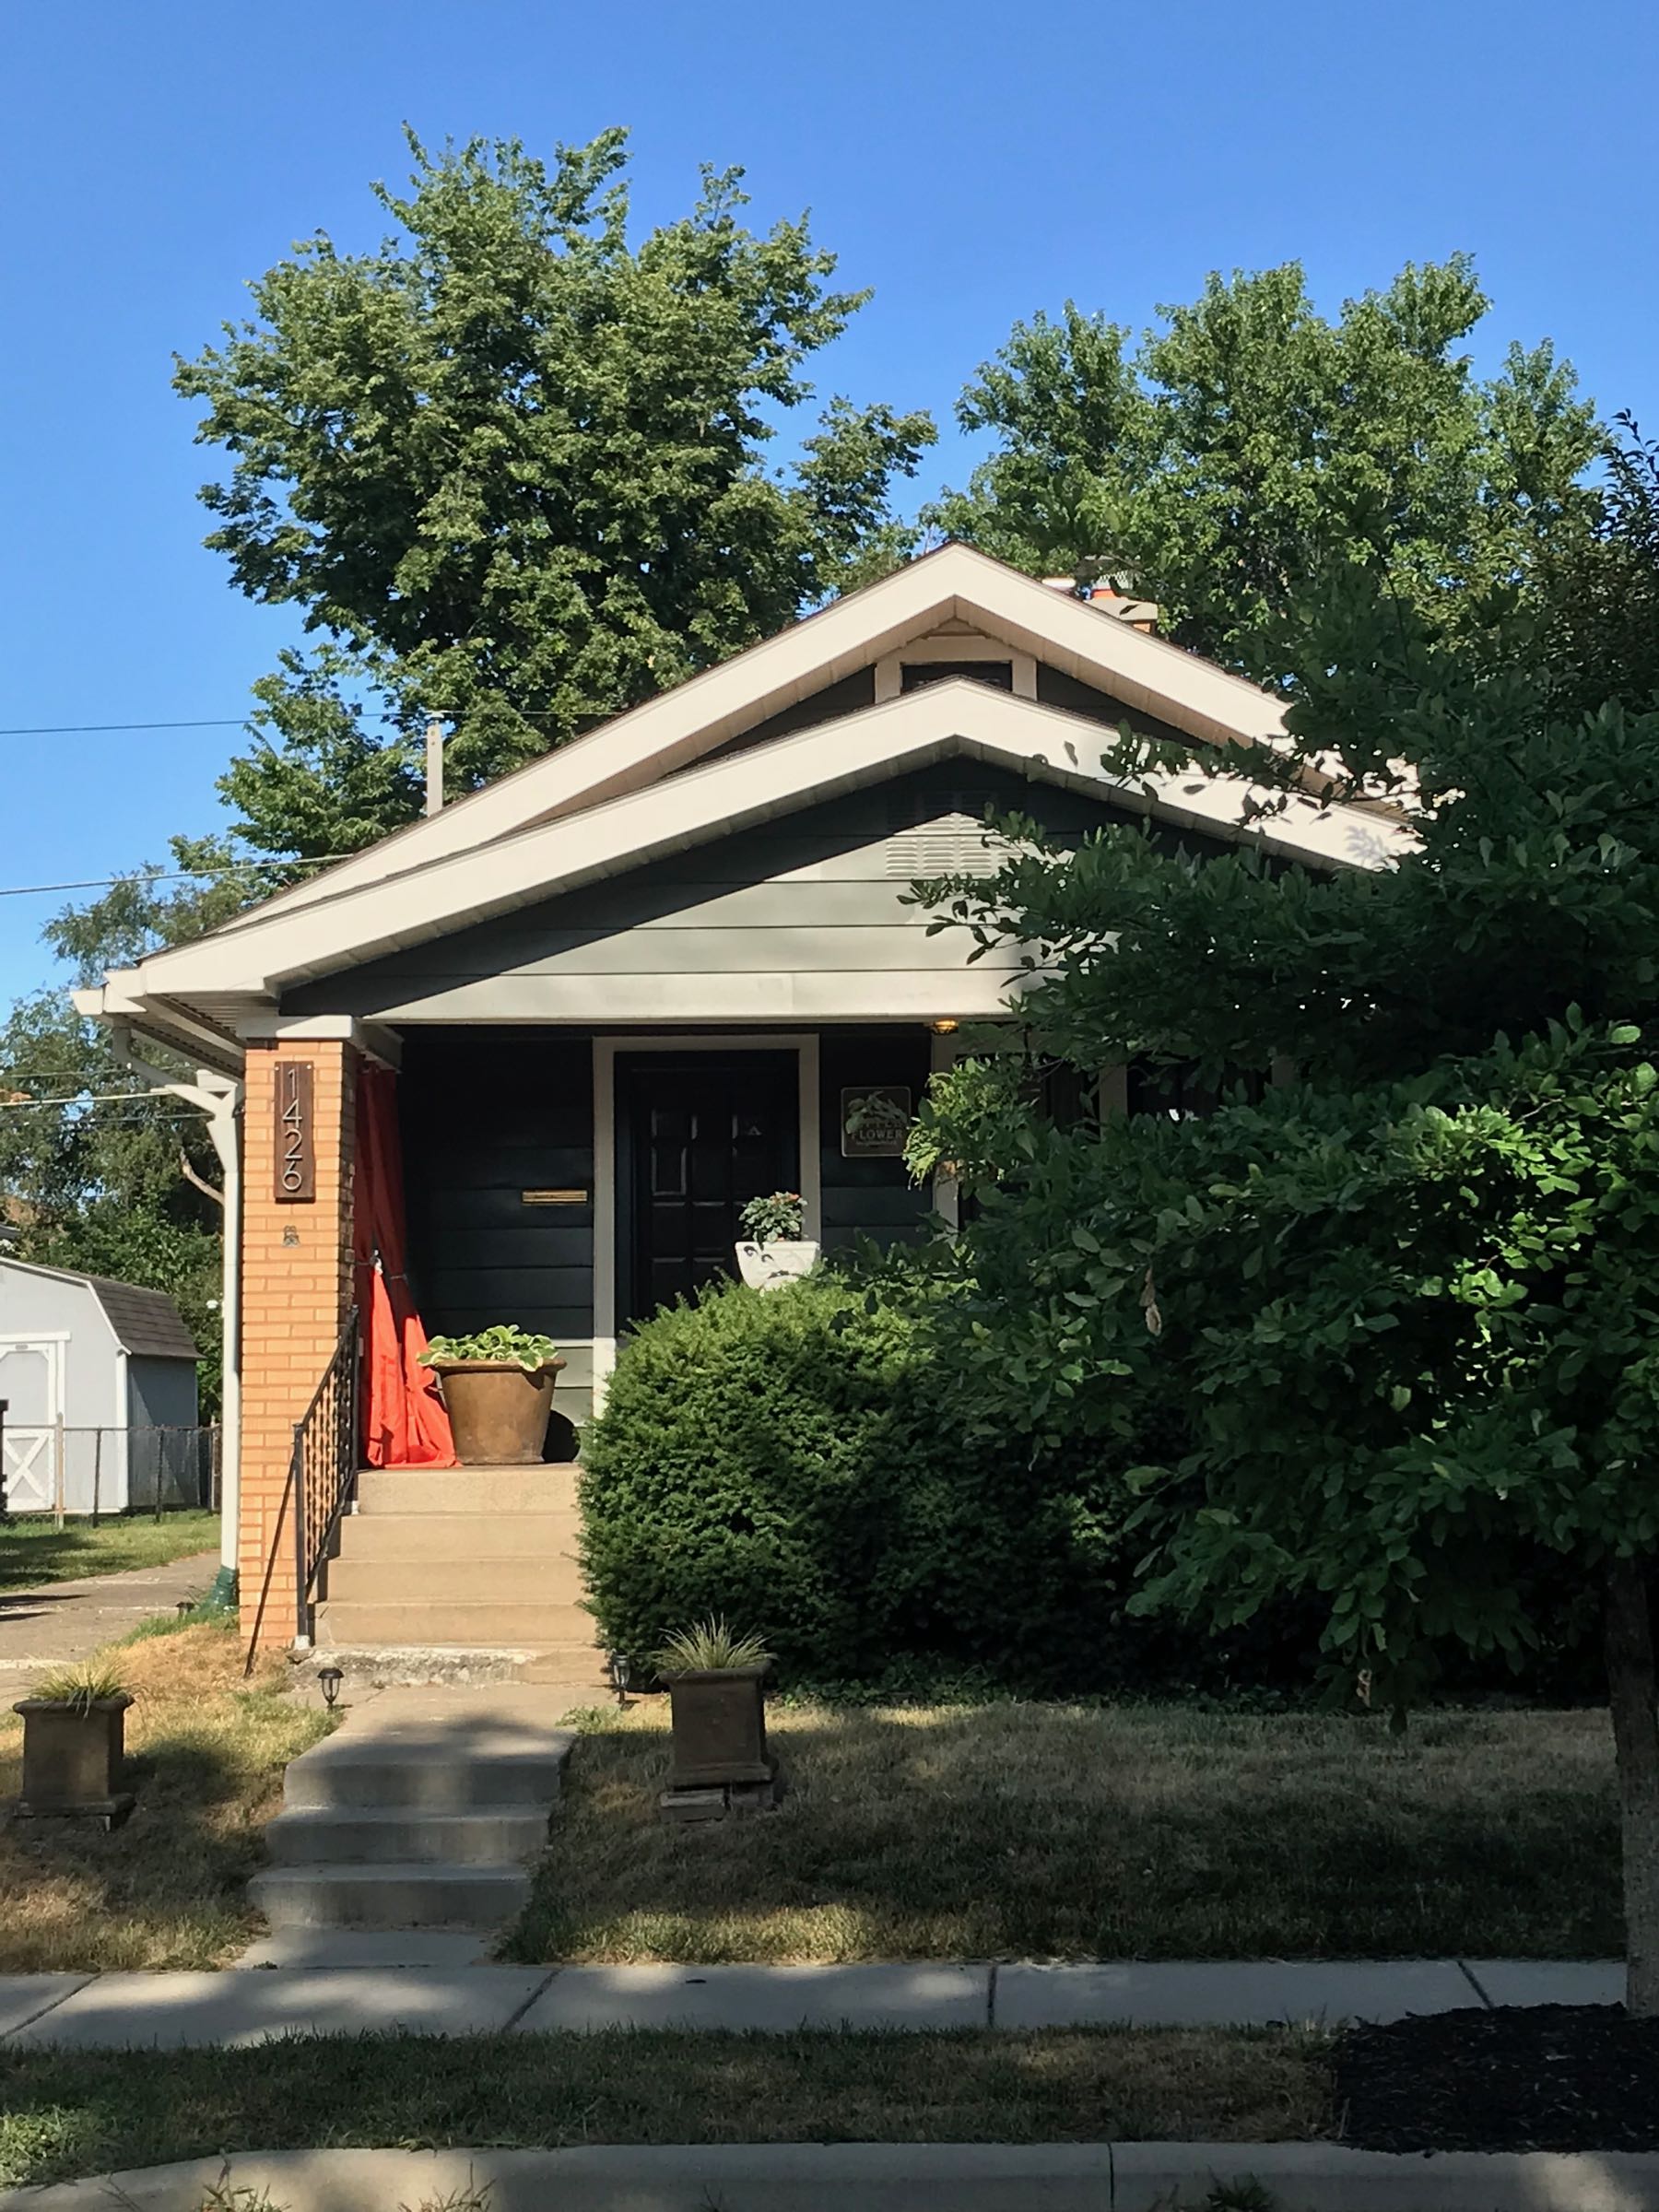
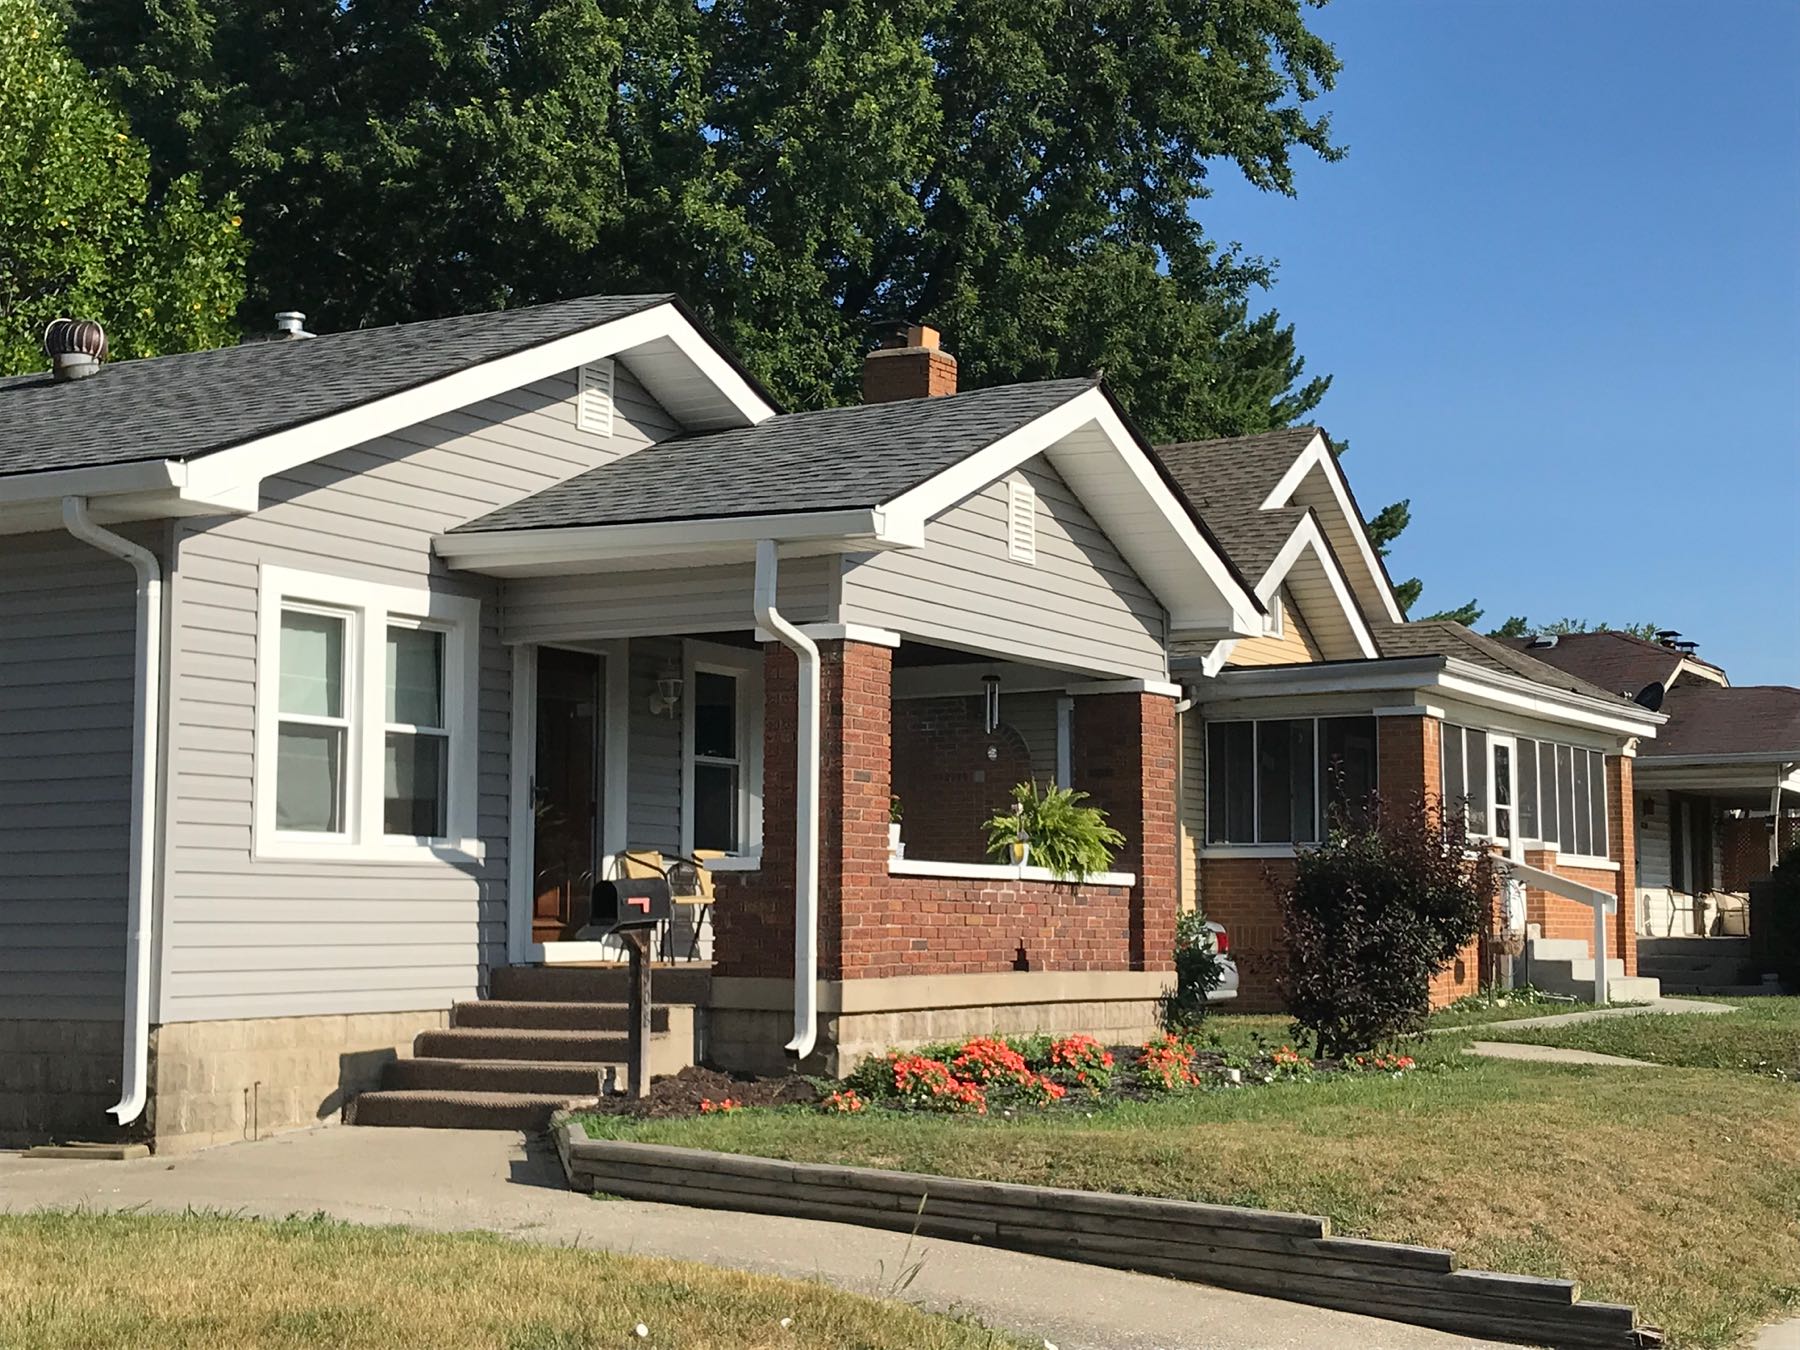
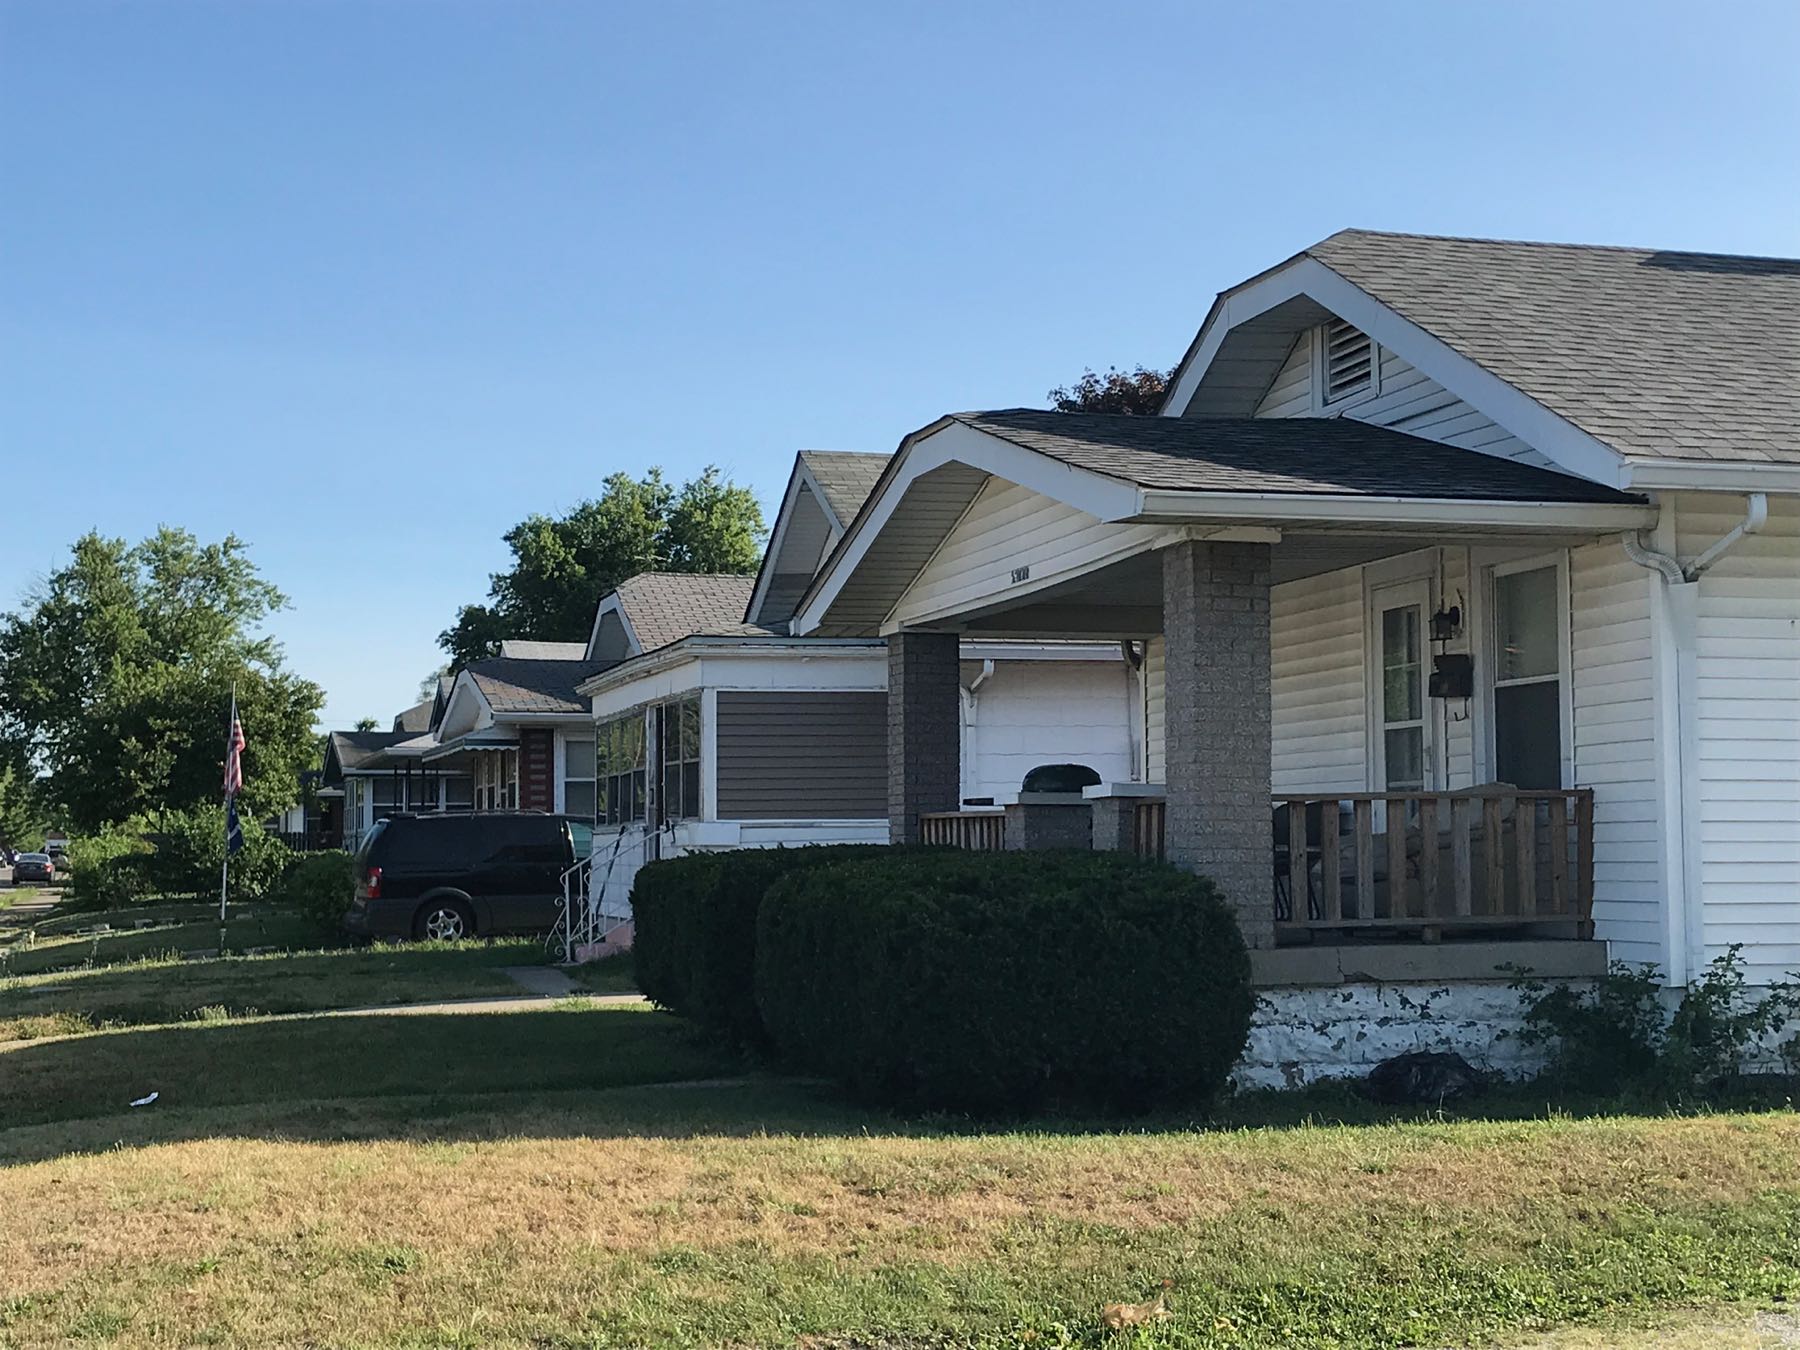
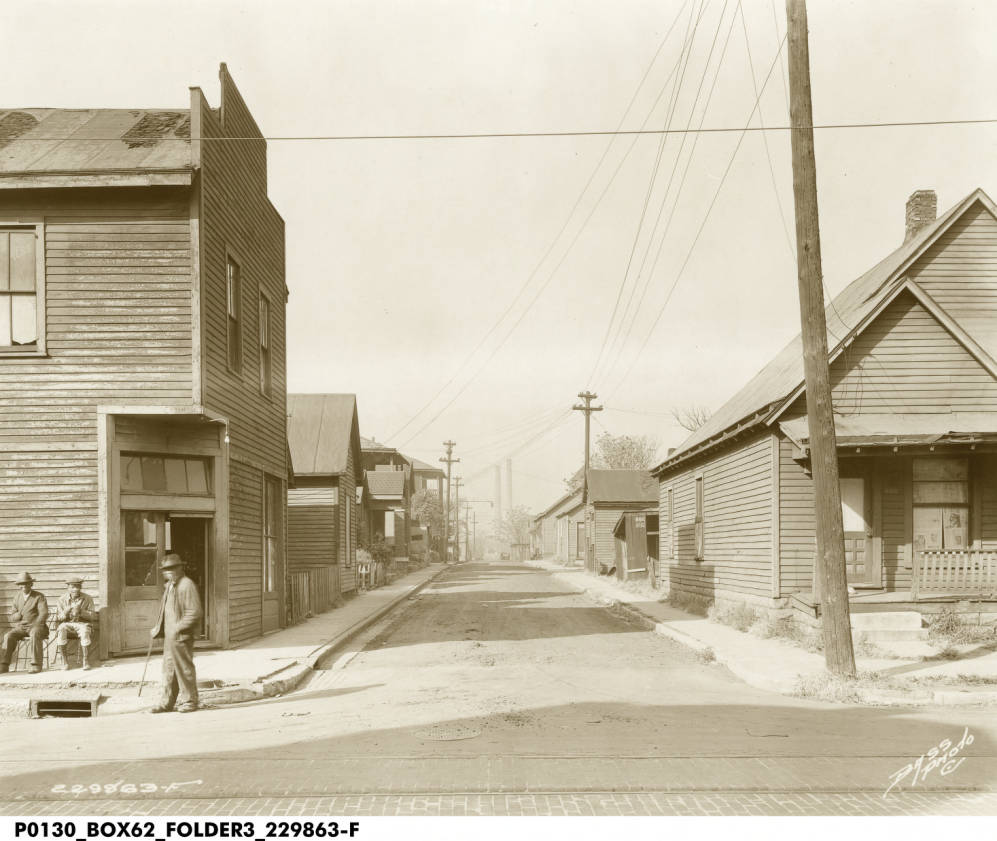
Bungalows in Little Flower. These homes are typical of the neighborhood’s housing stock, developed largely in the 1920s and 1930s.
Matt Nowlin, The Polis Center
While Little Flower is attracting more college-educated residents in recent years, it does not seem to be showing other demographic signs of gentrification. This traditionally German and Irish neighborhood has a growing of share of residents in their thirties and forties, as well as a growing population of children. Residents in this age group are less likely to live in poverty than other age groups, but they have seen household income decline 26 percent since 2010.
Founding a German and Irish Parish
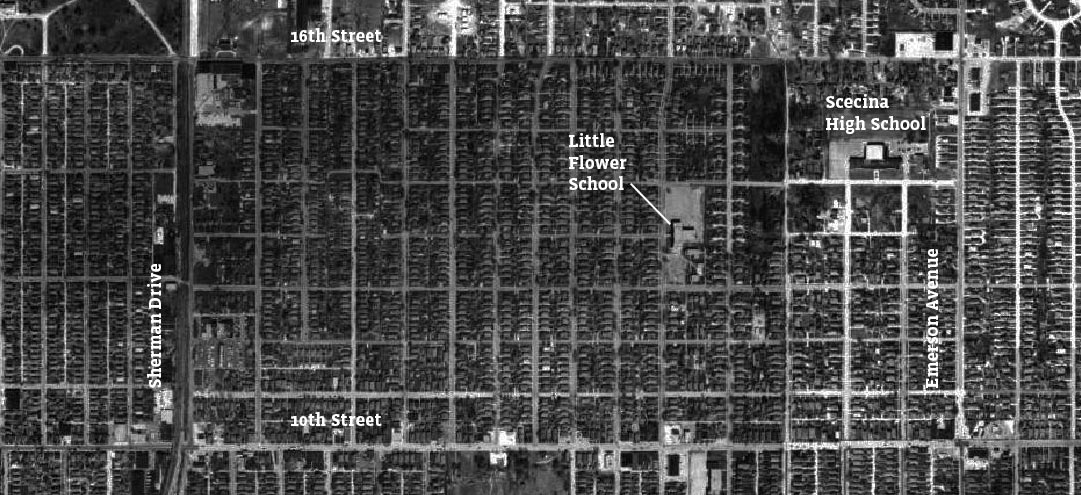
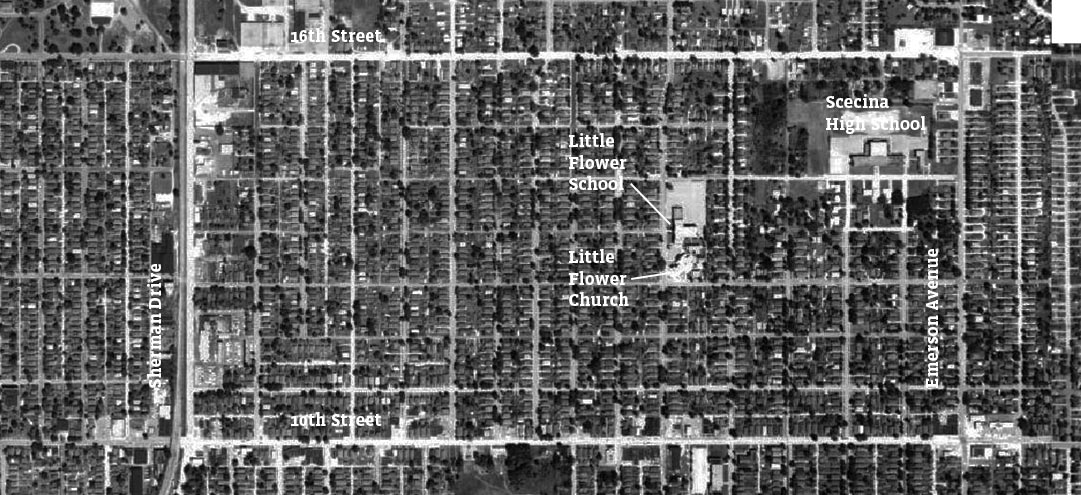
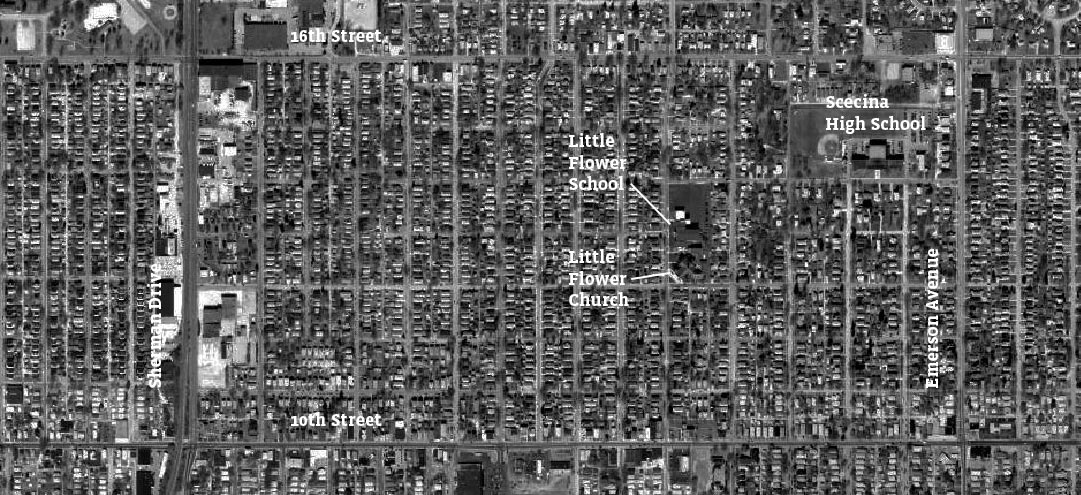
Little Flower, on Indianapolis’ east side, is a German and Irish neighborhood that developed beginning in the 1920s. It is bounded by 16th Street to the north, 10th Street to the south, Emerson Avenue to the east, and Sherman Drive to the west.
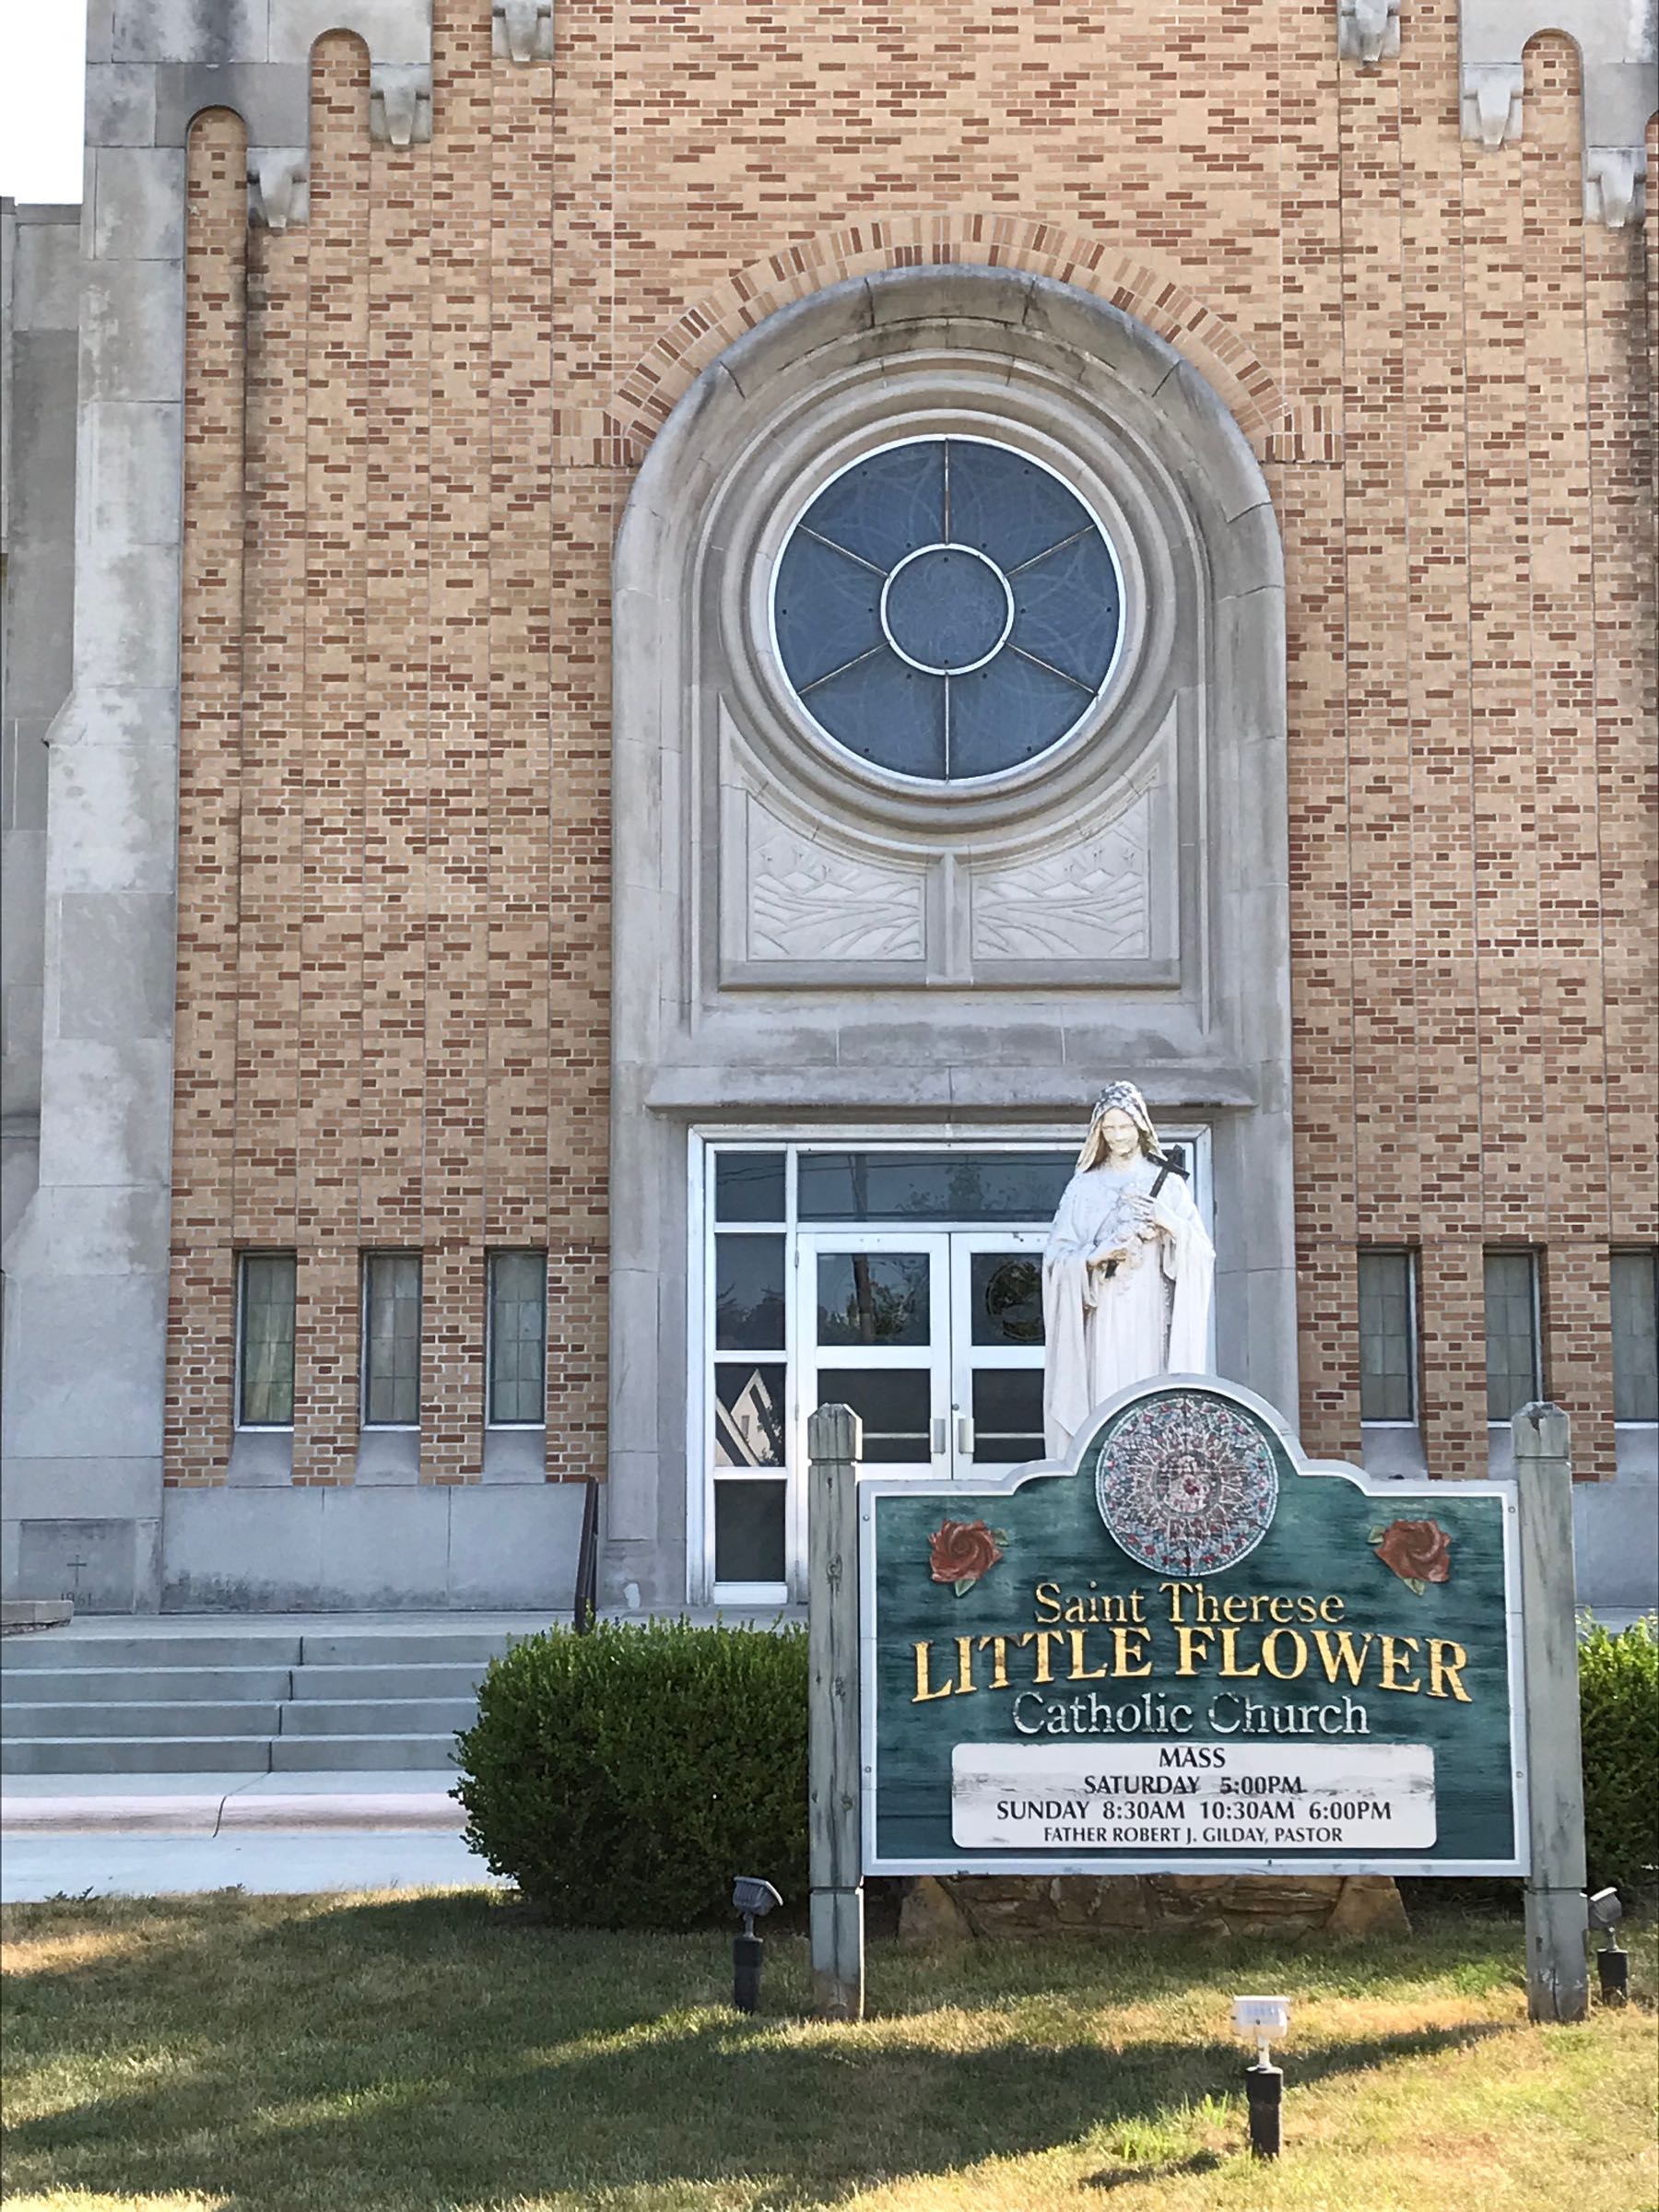
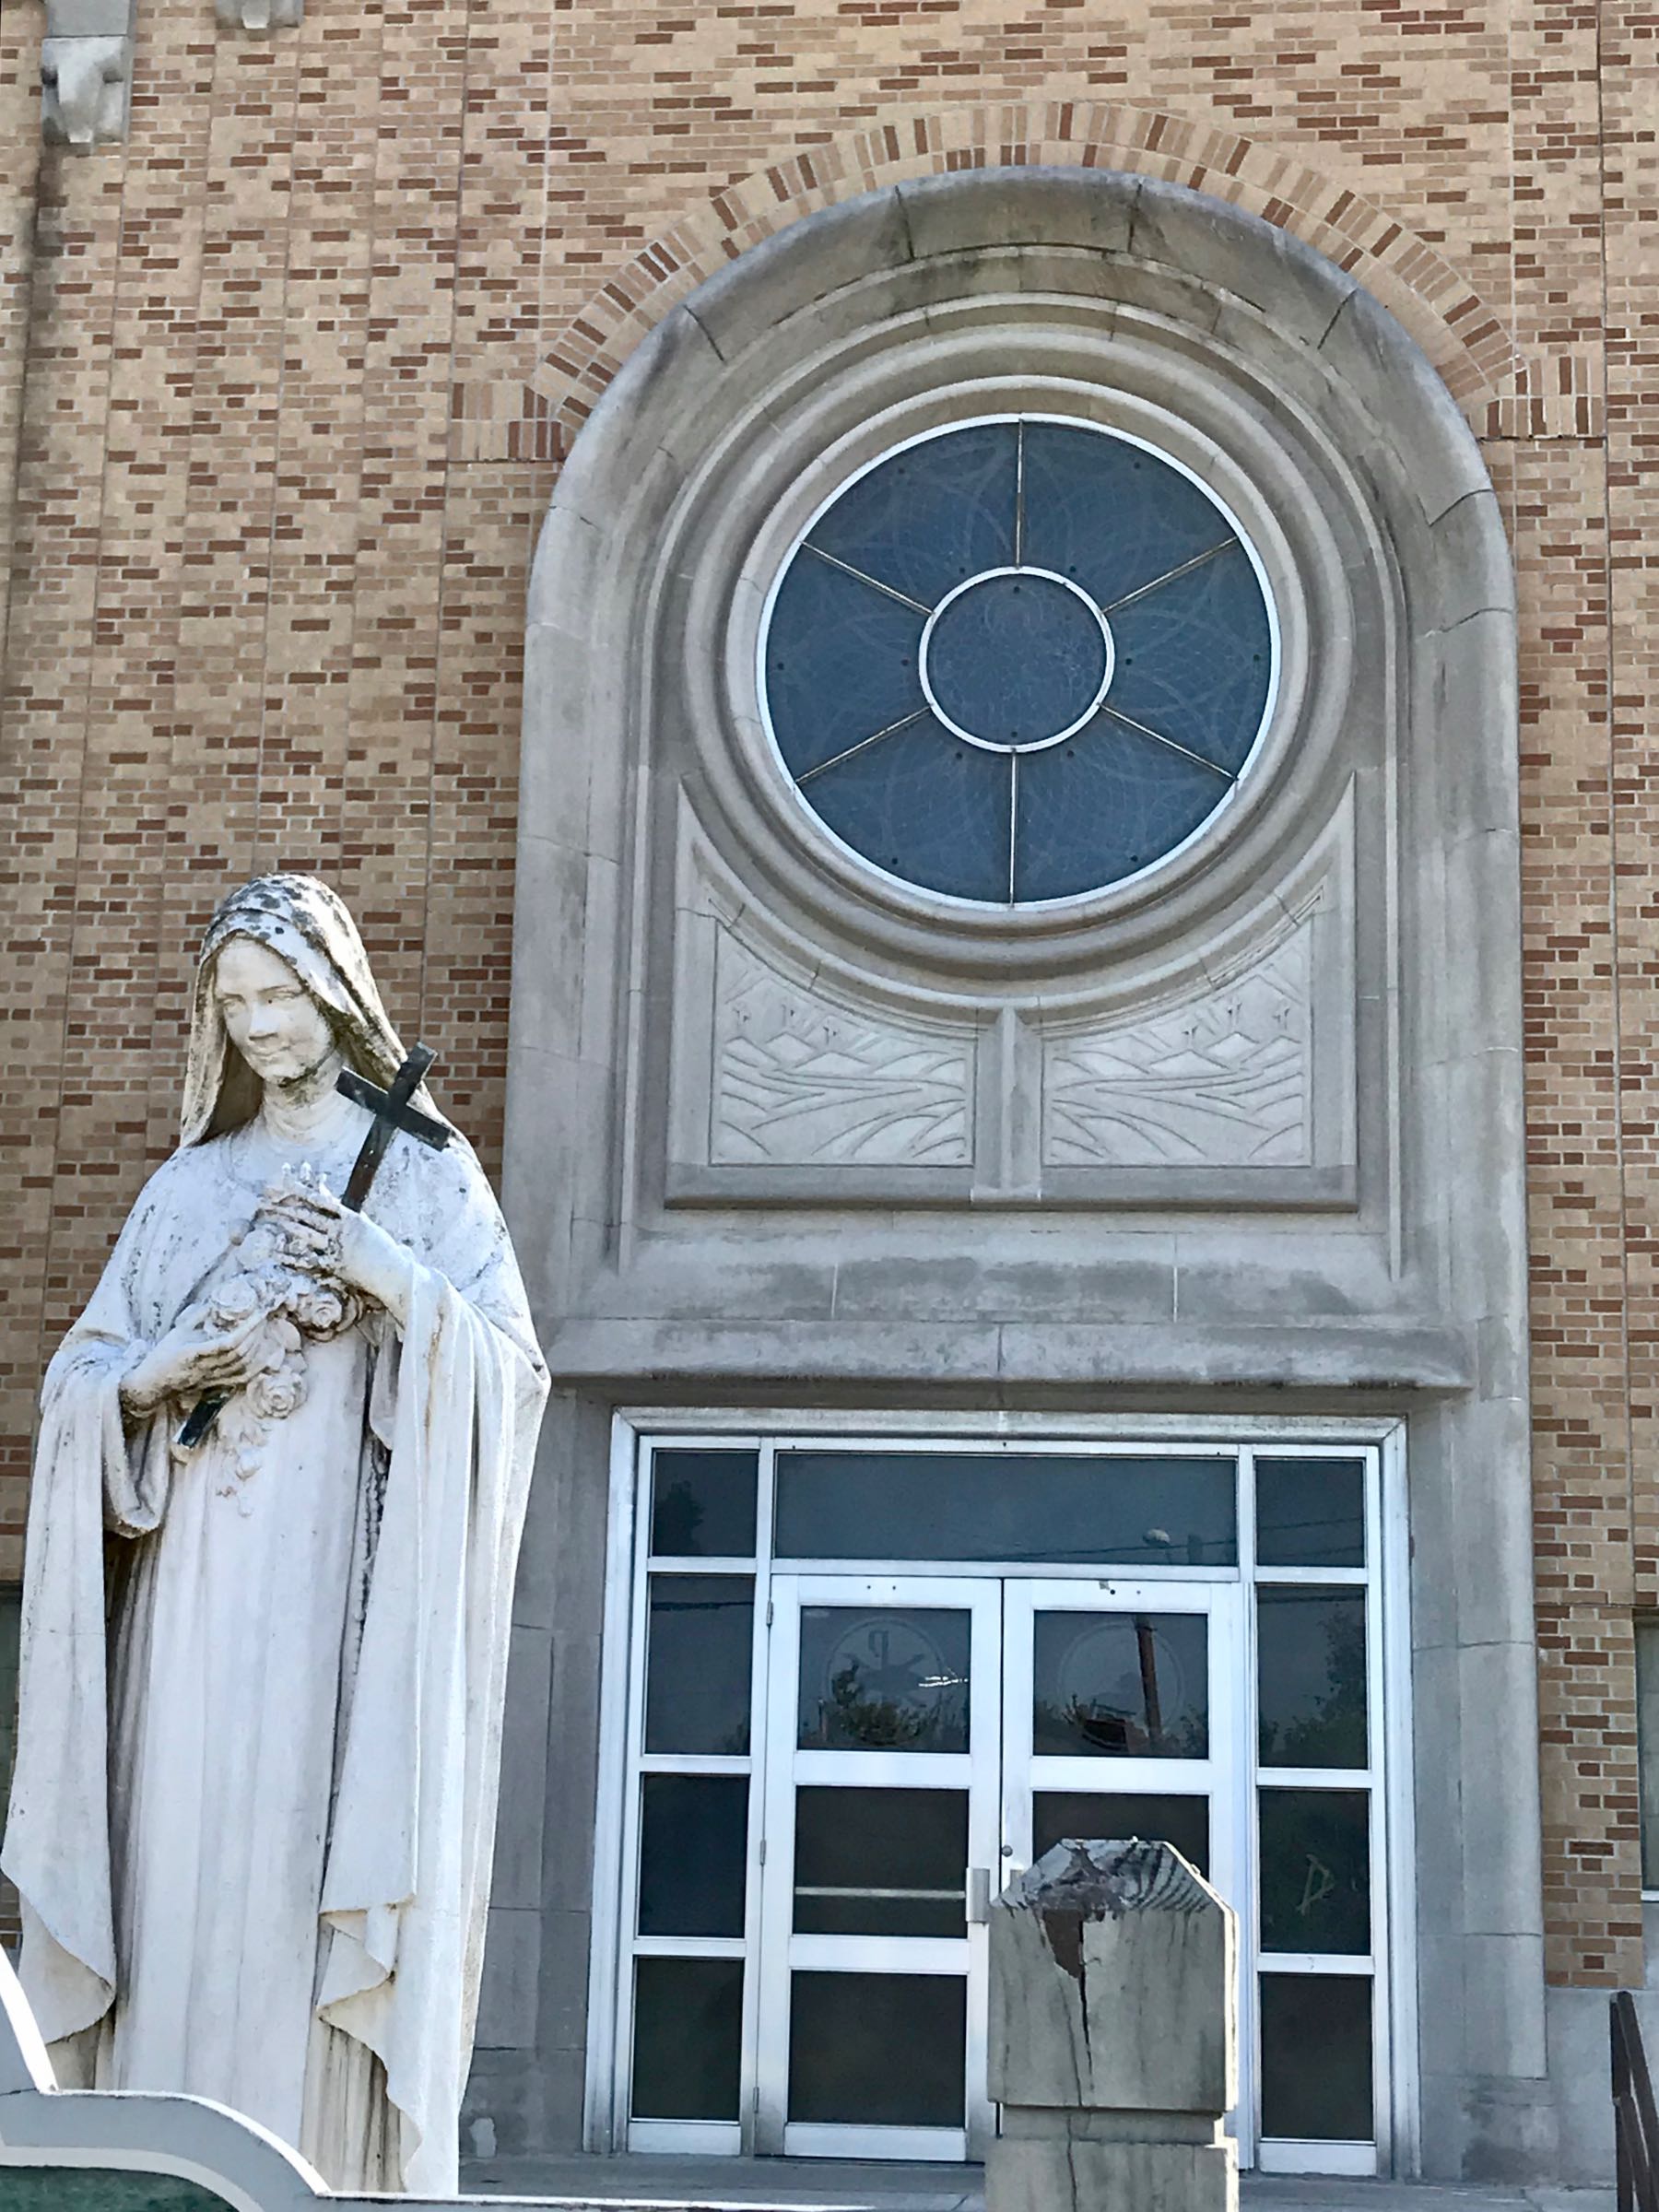
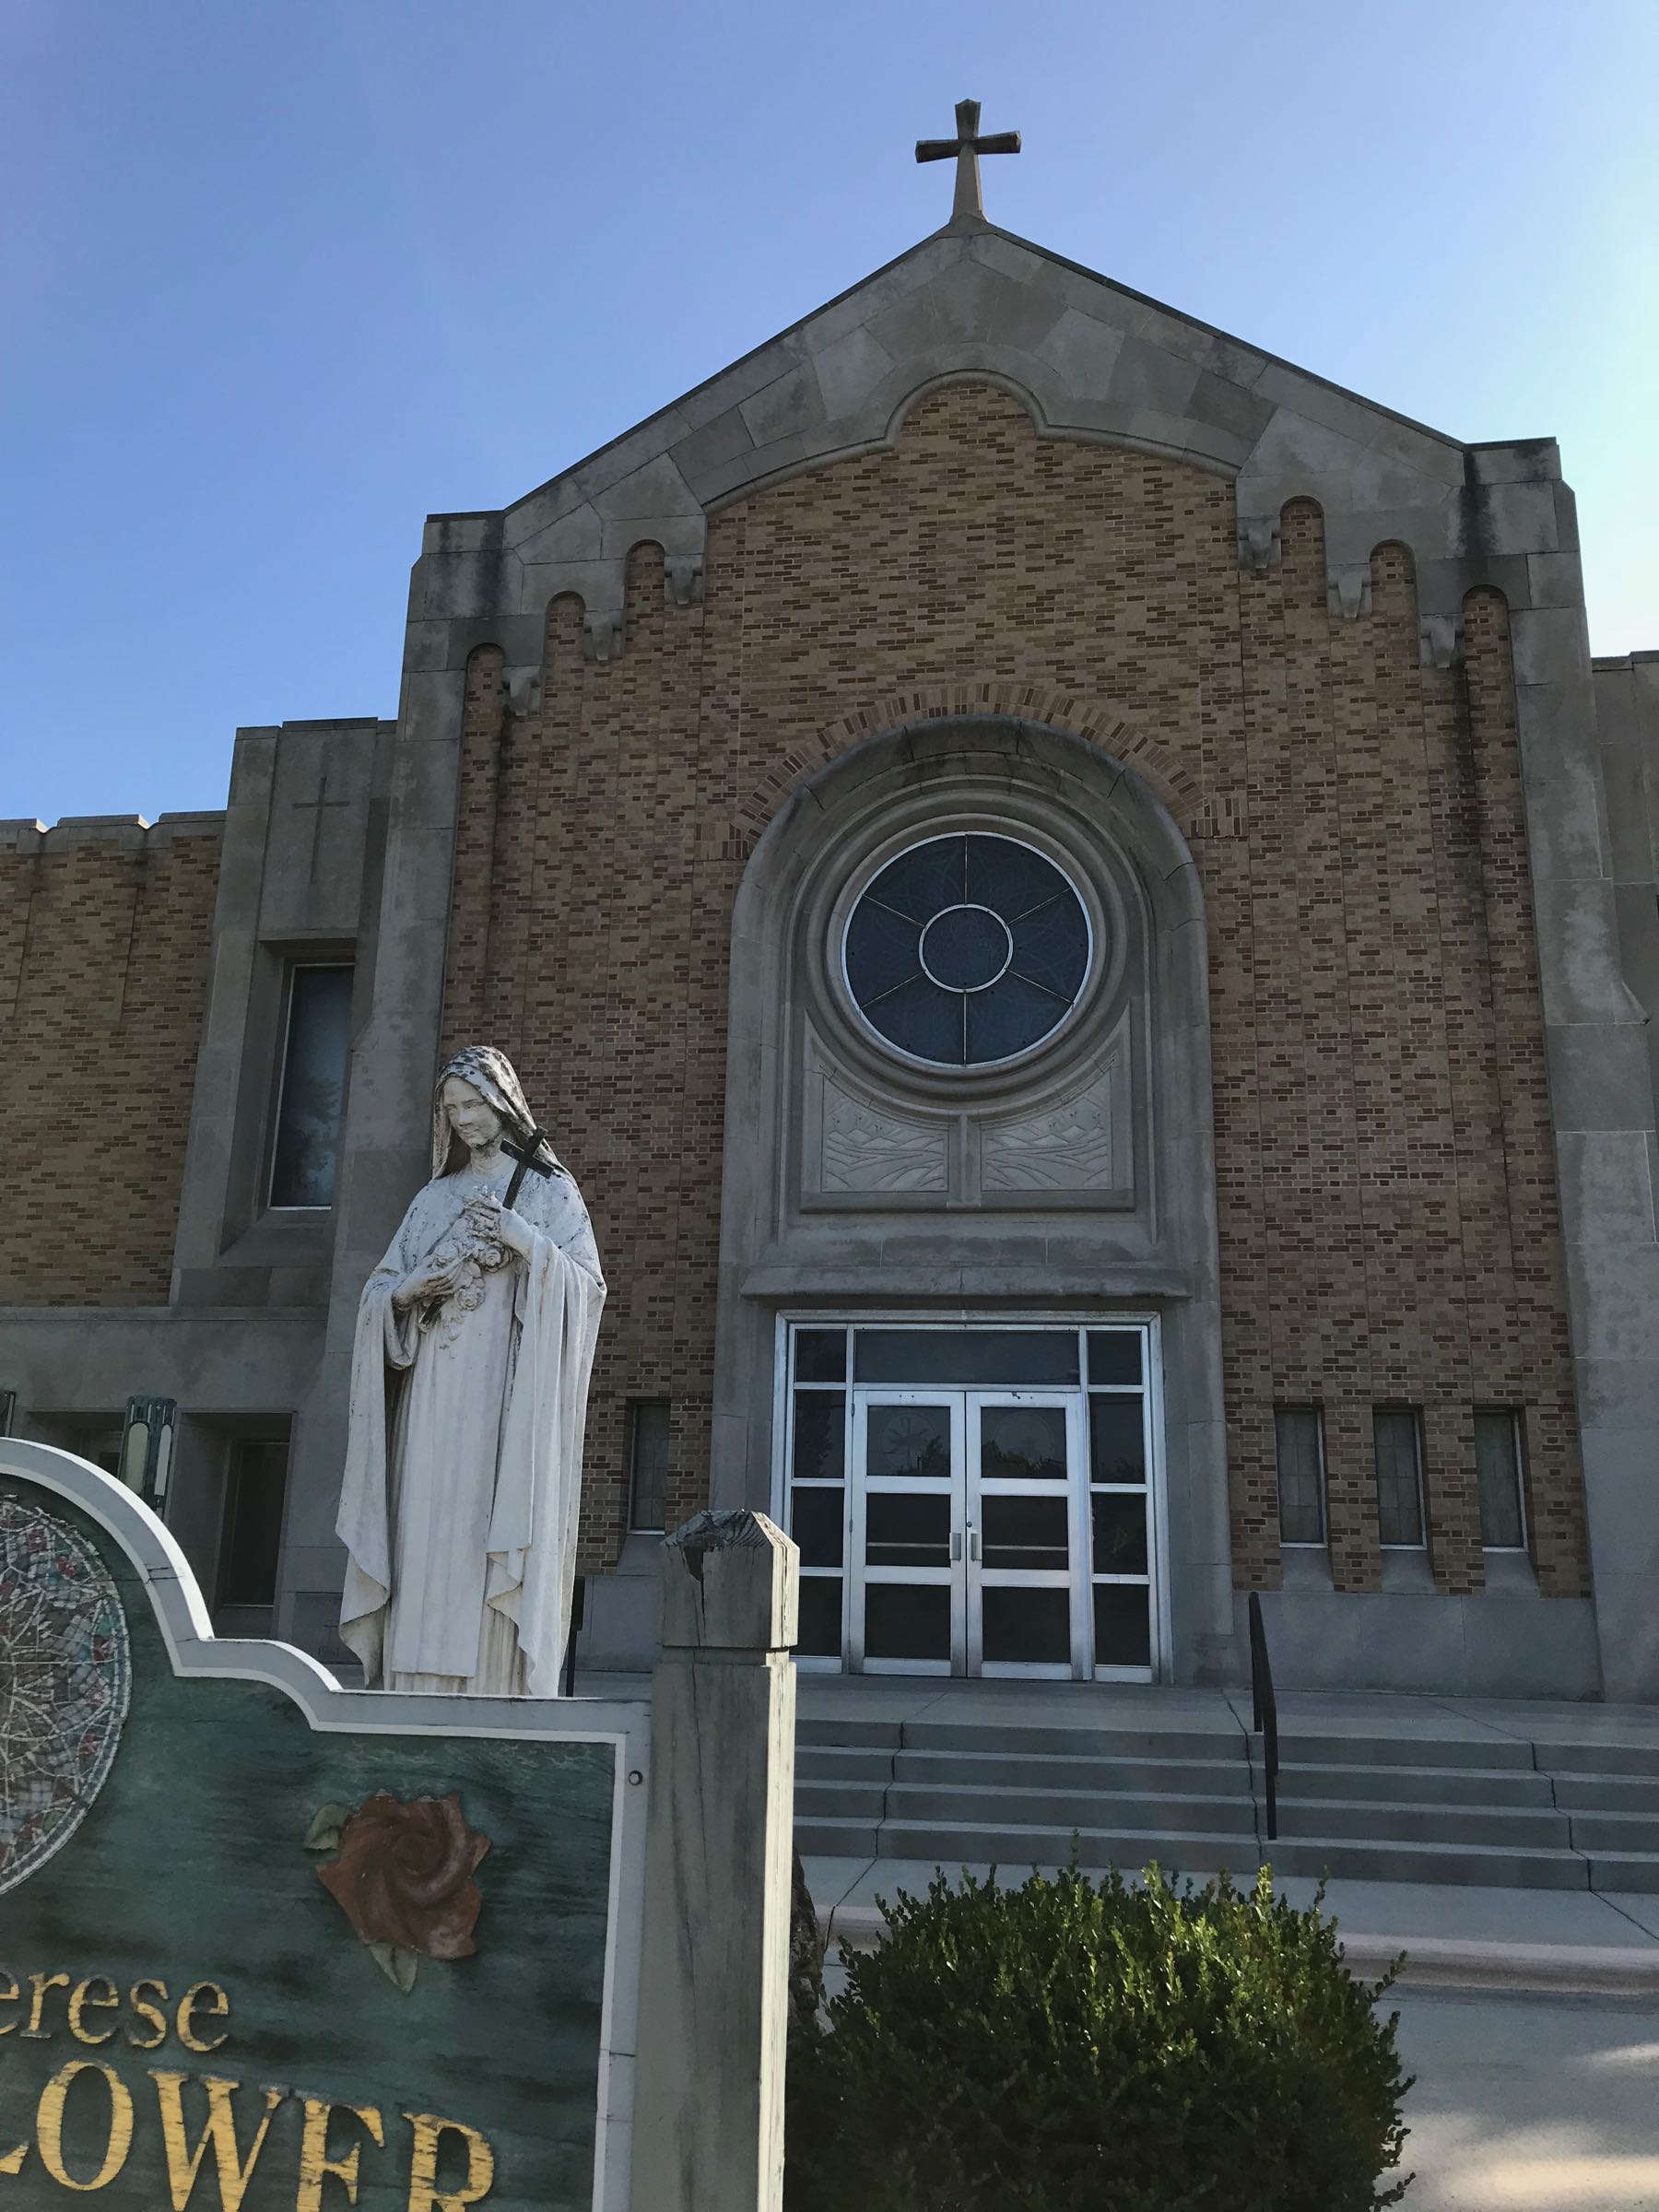
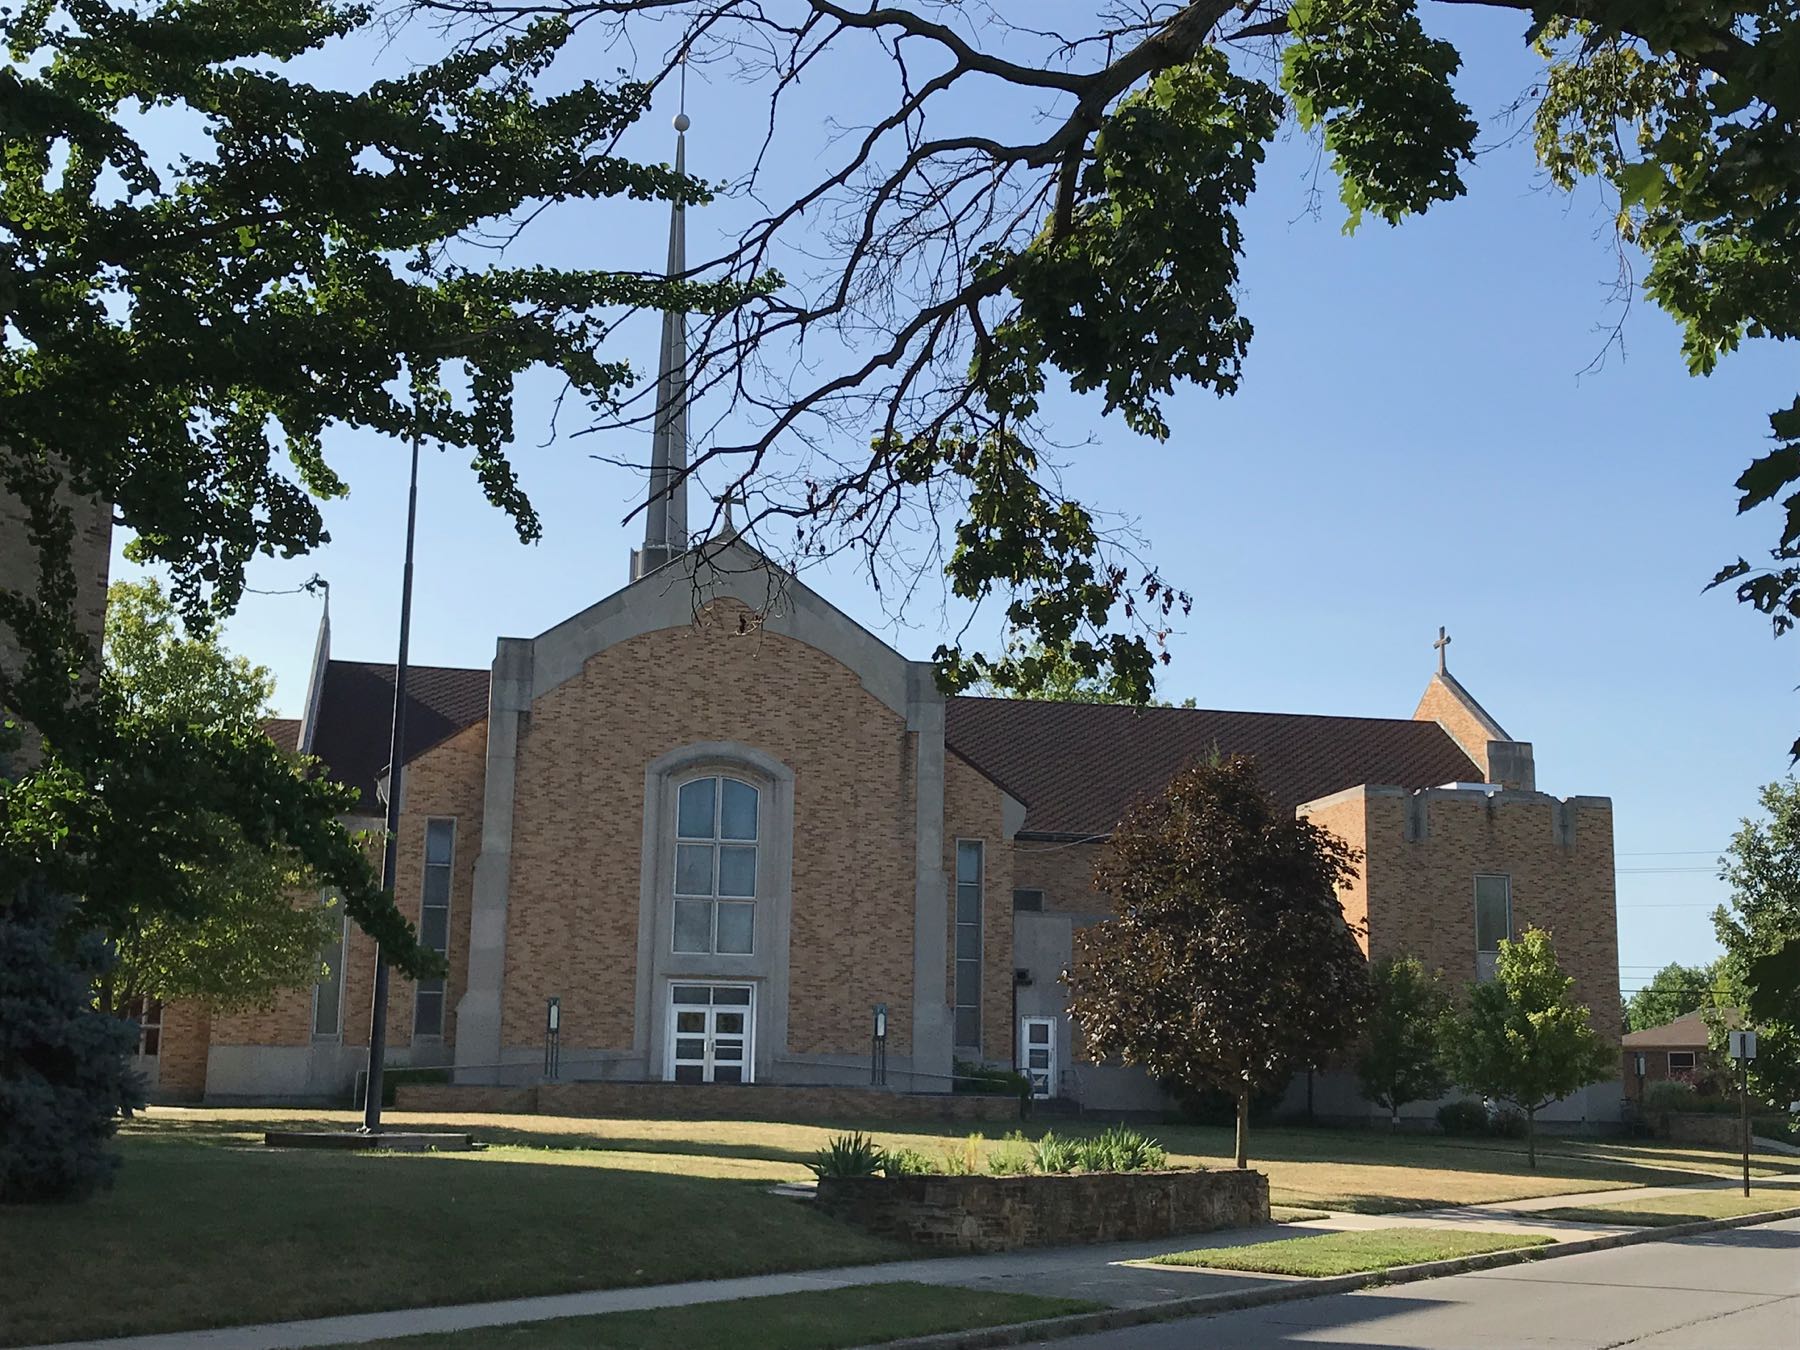
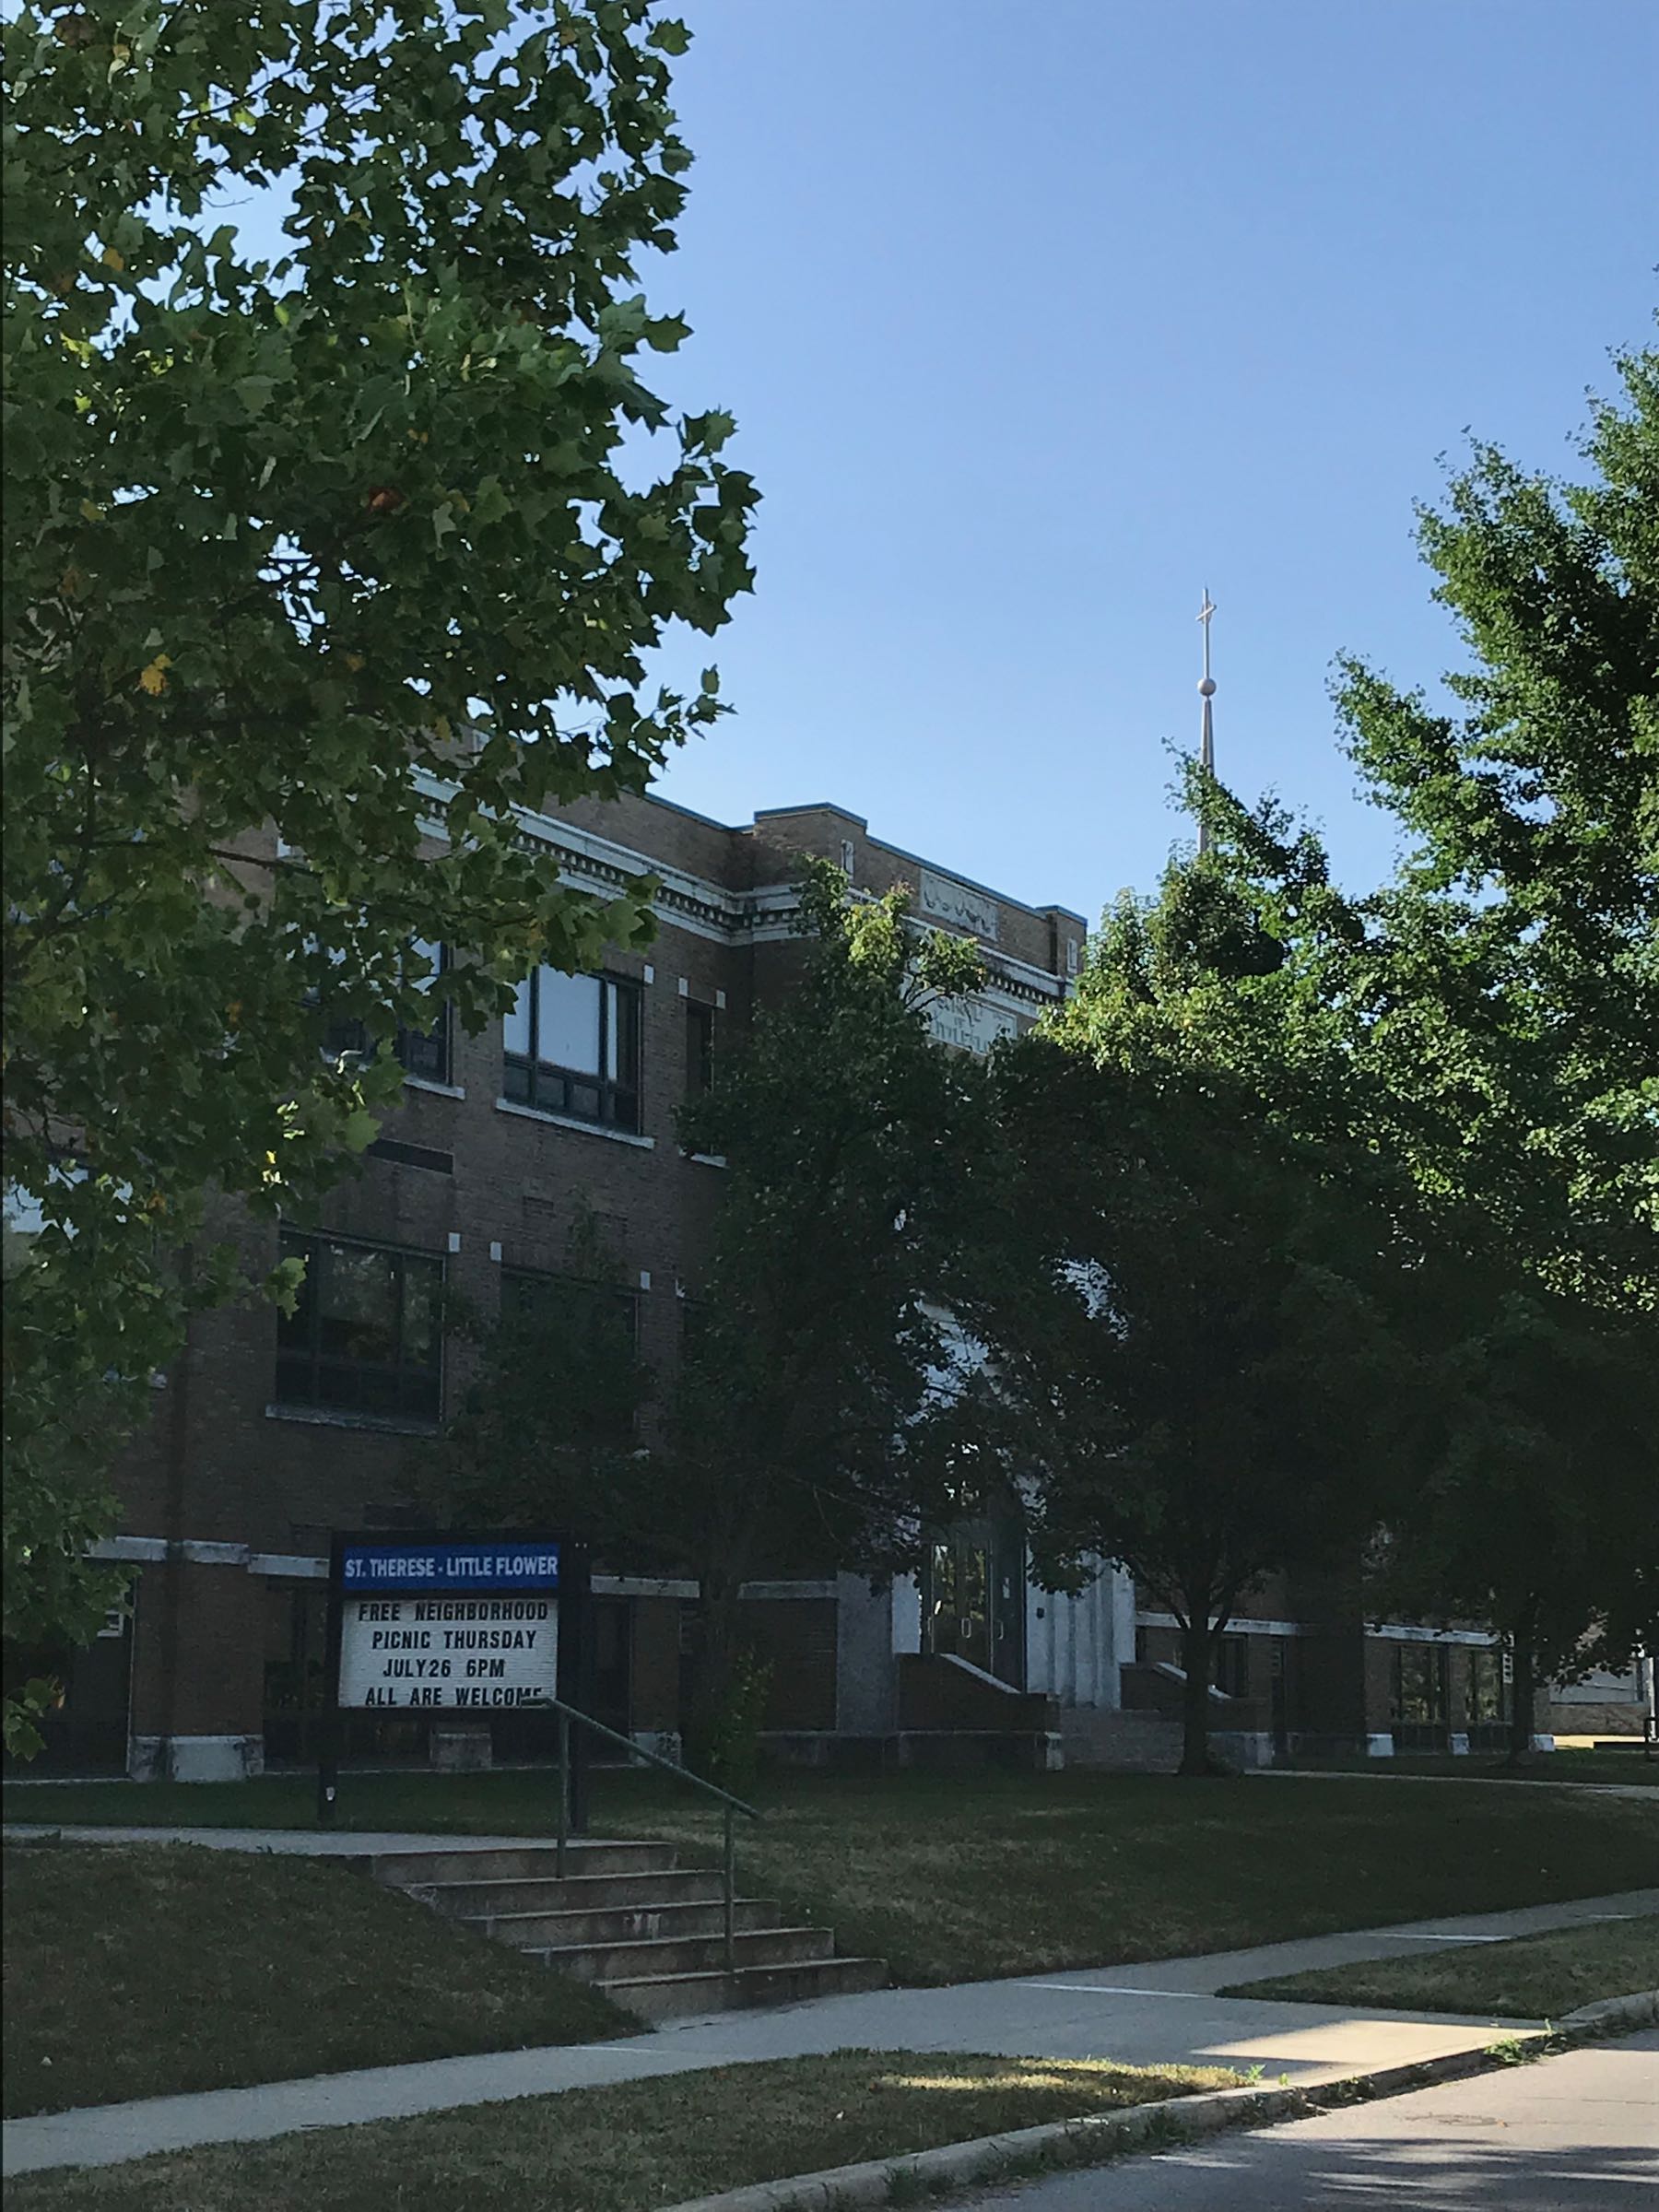
Its namesake Catholic parish, St. Therese Little Flower, was integral to the development of the neighborhood. In fact, according to a parish history, the land for the church and school was donated by real estate developers in the hopes that a newly established parish would attract homebuyers. The parish’s first masses were held on July 6, 1925 in a local grocery. The parish history puts the 1925 parish population at 460 people, made up of 75 households.
While the parish population hints at the size of the neighborhood in the 1920s, it isn’t until the 1940s that census data is collected with enough detail to accurately measure Little Flower’s population. In the 1940 census, Little Flower had a population of 4,188. According to the parish history, most parishioners were of German and Irish decent. Most of the population were native born whites, but of the 83 foreign-born residents, 45 percent were from German or Ireland (called Eire in the 1940 Census). In the 1970 Census, there were 366 residents who were foreign born or who had at least one foreign born parent. Two-thirds of these had roots in Ireland or Germany.
The American Community Survey now provides data about ancestry even for native citizens. In 2016, it was estimated that 1,180 residents were of German or Irish heritage (43 percent of the population).
Neighborhood Development
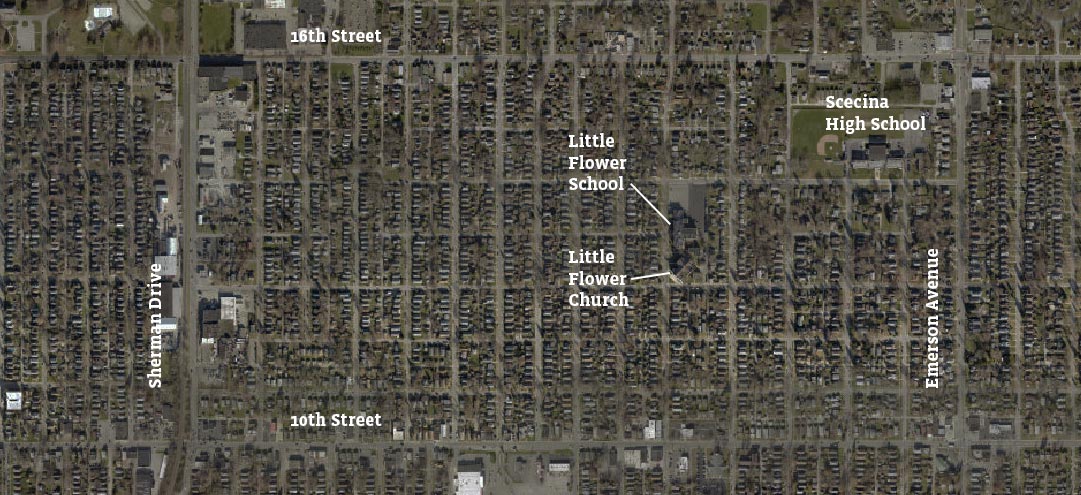
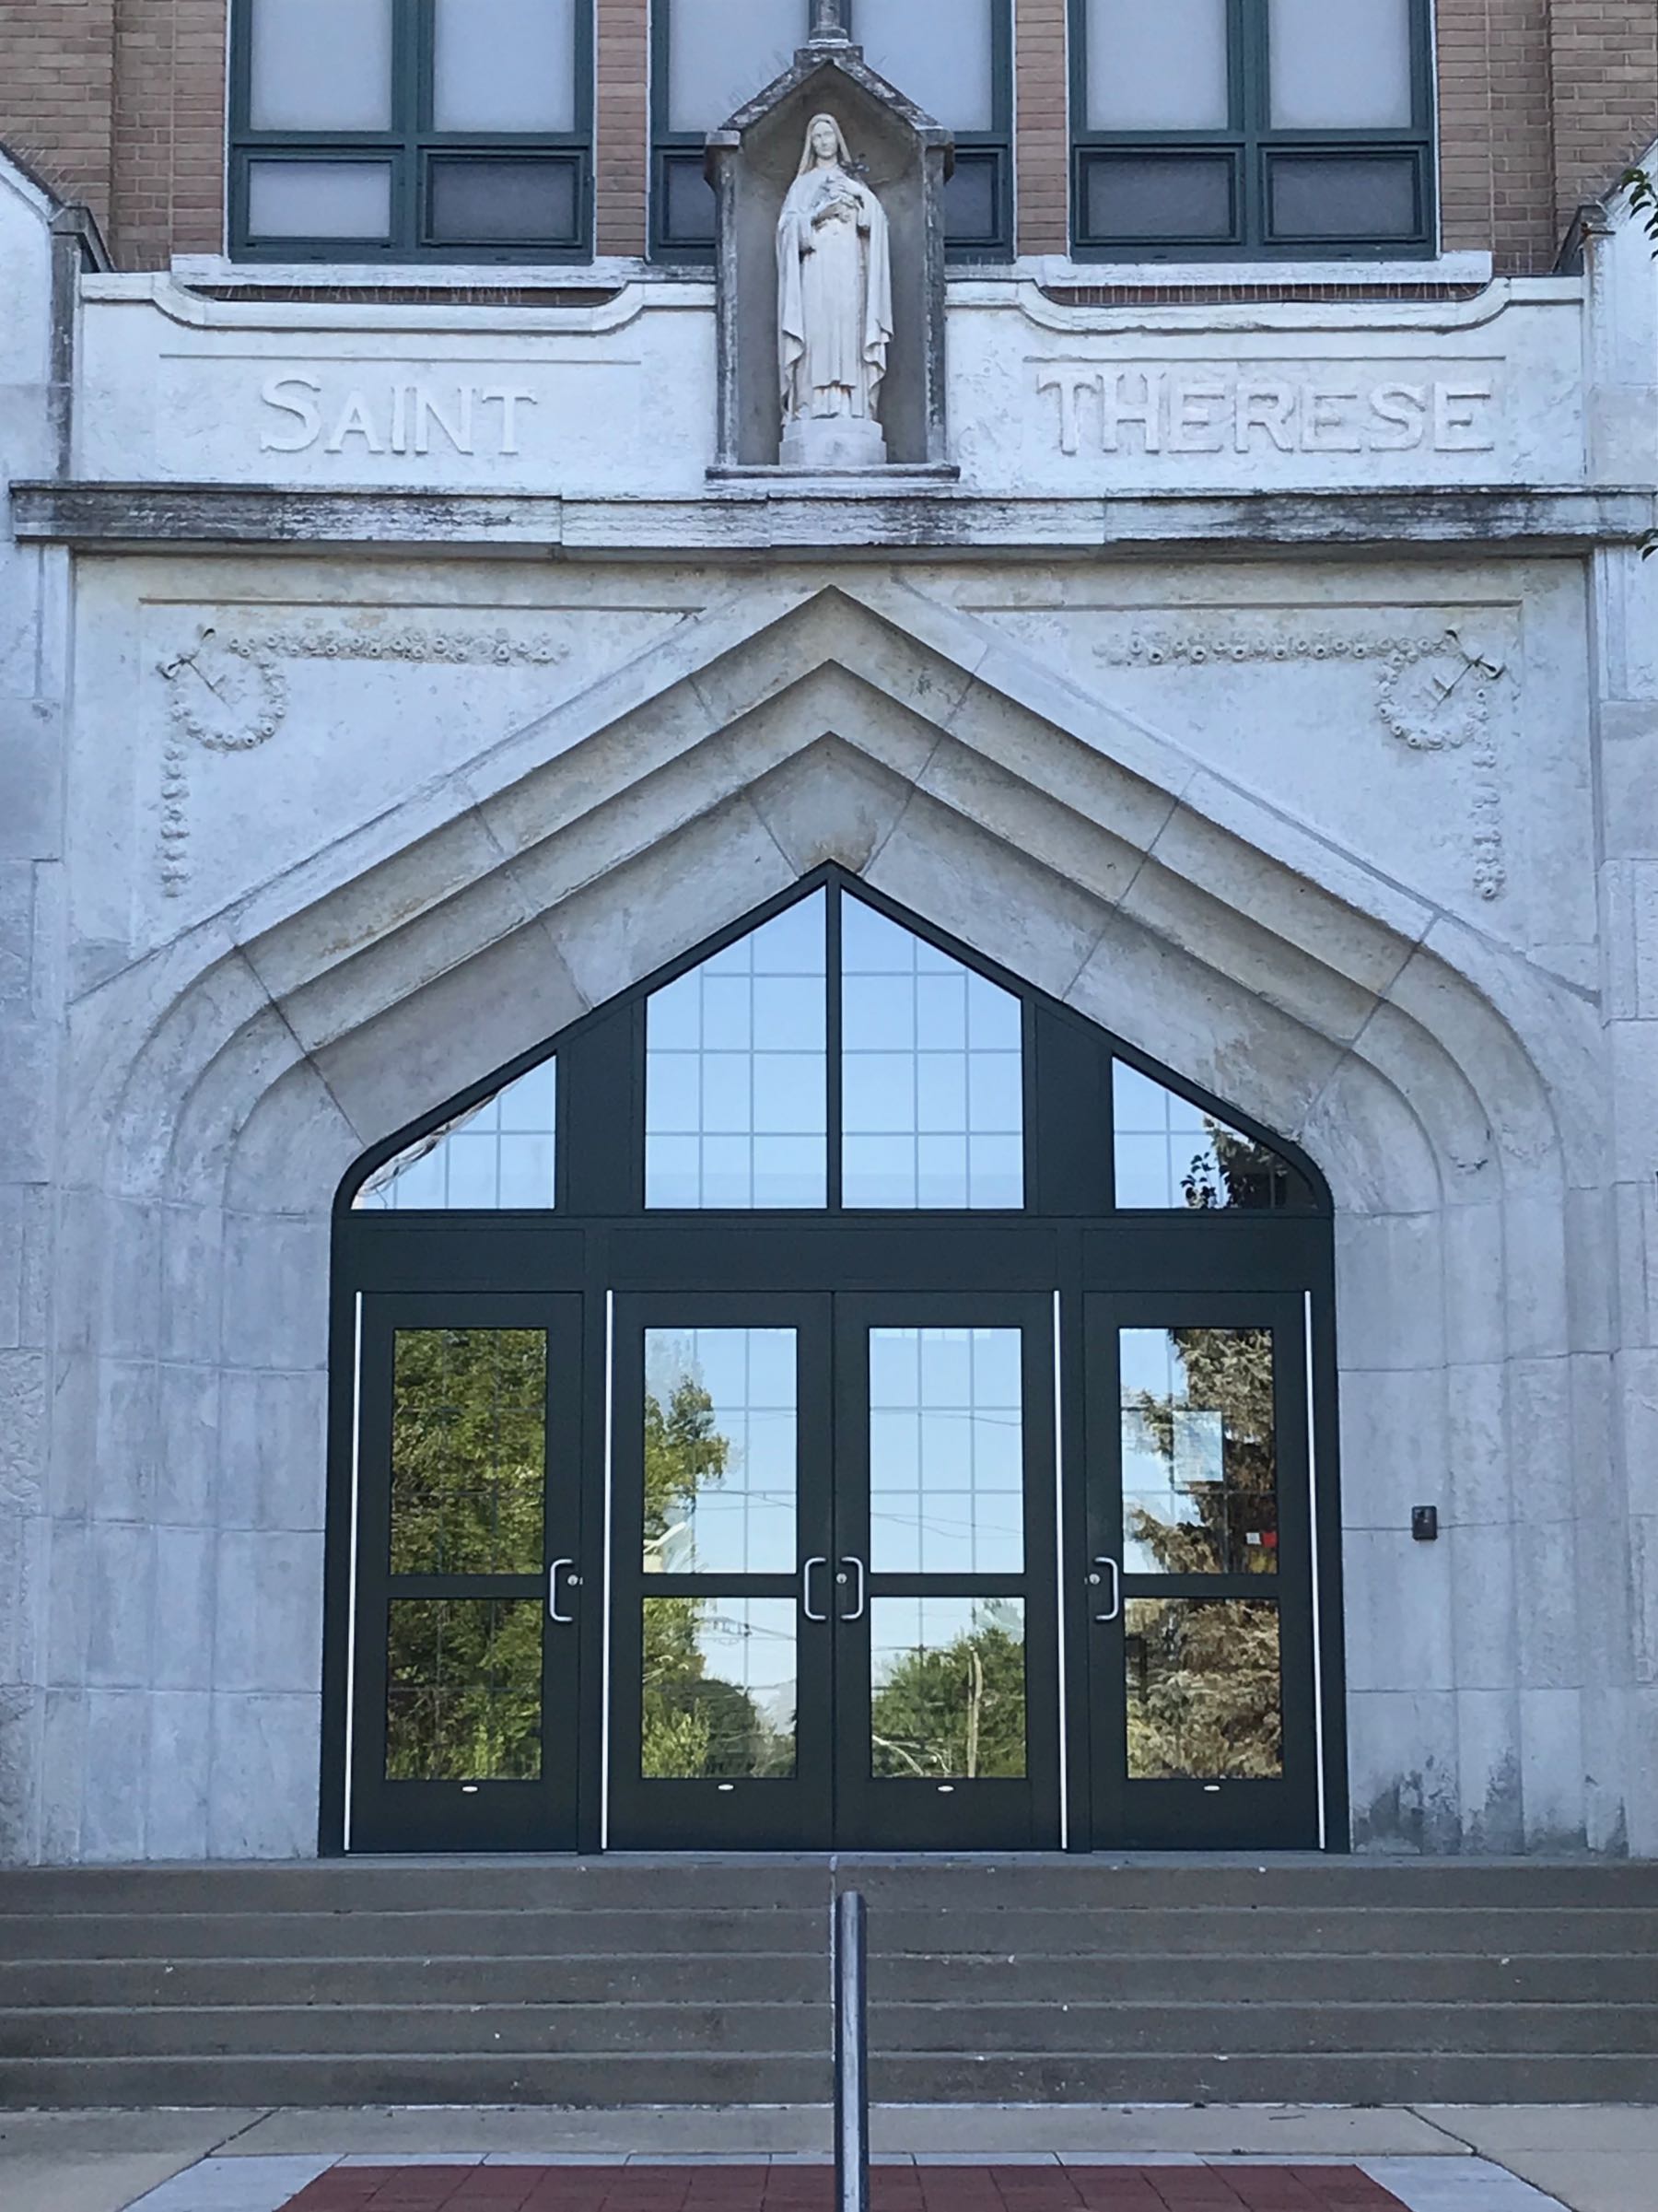
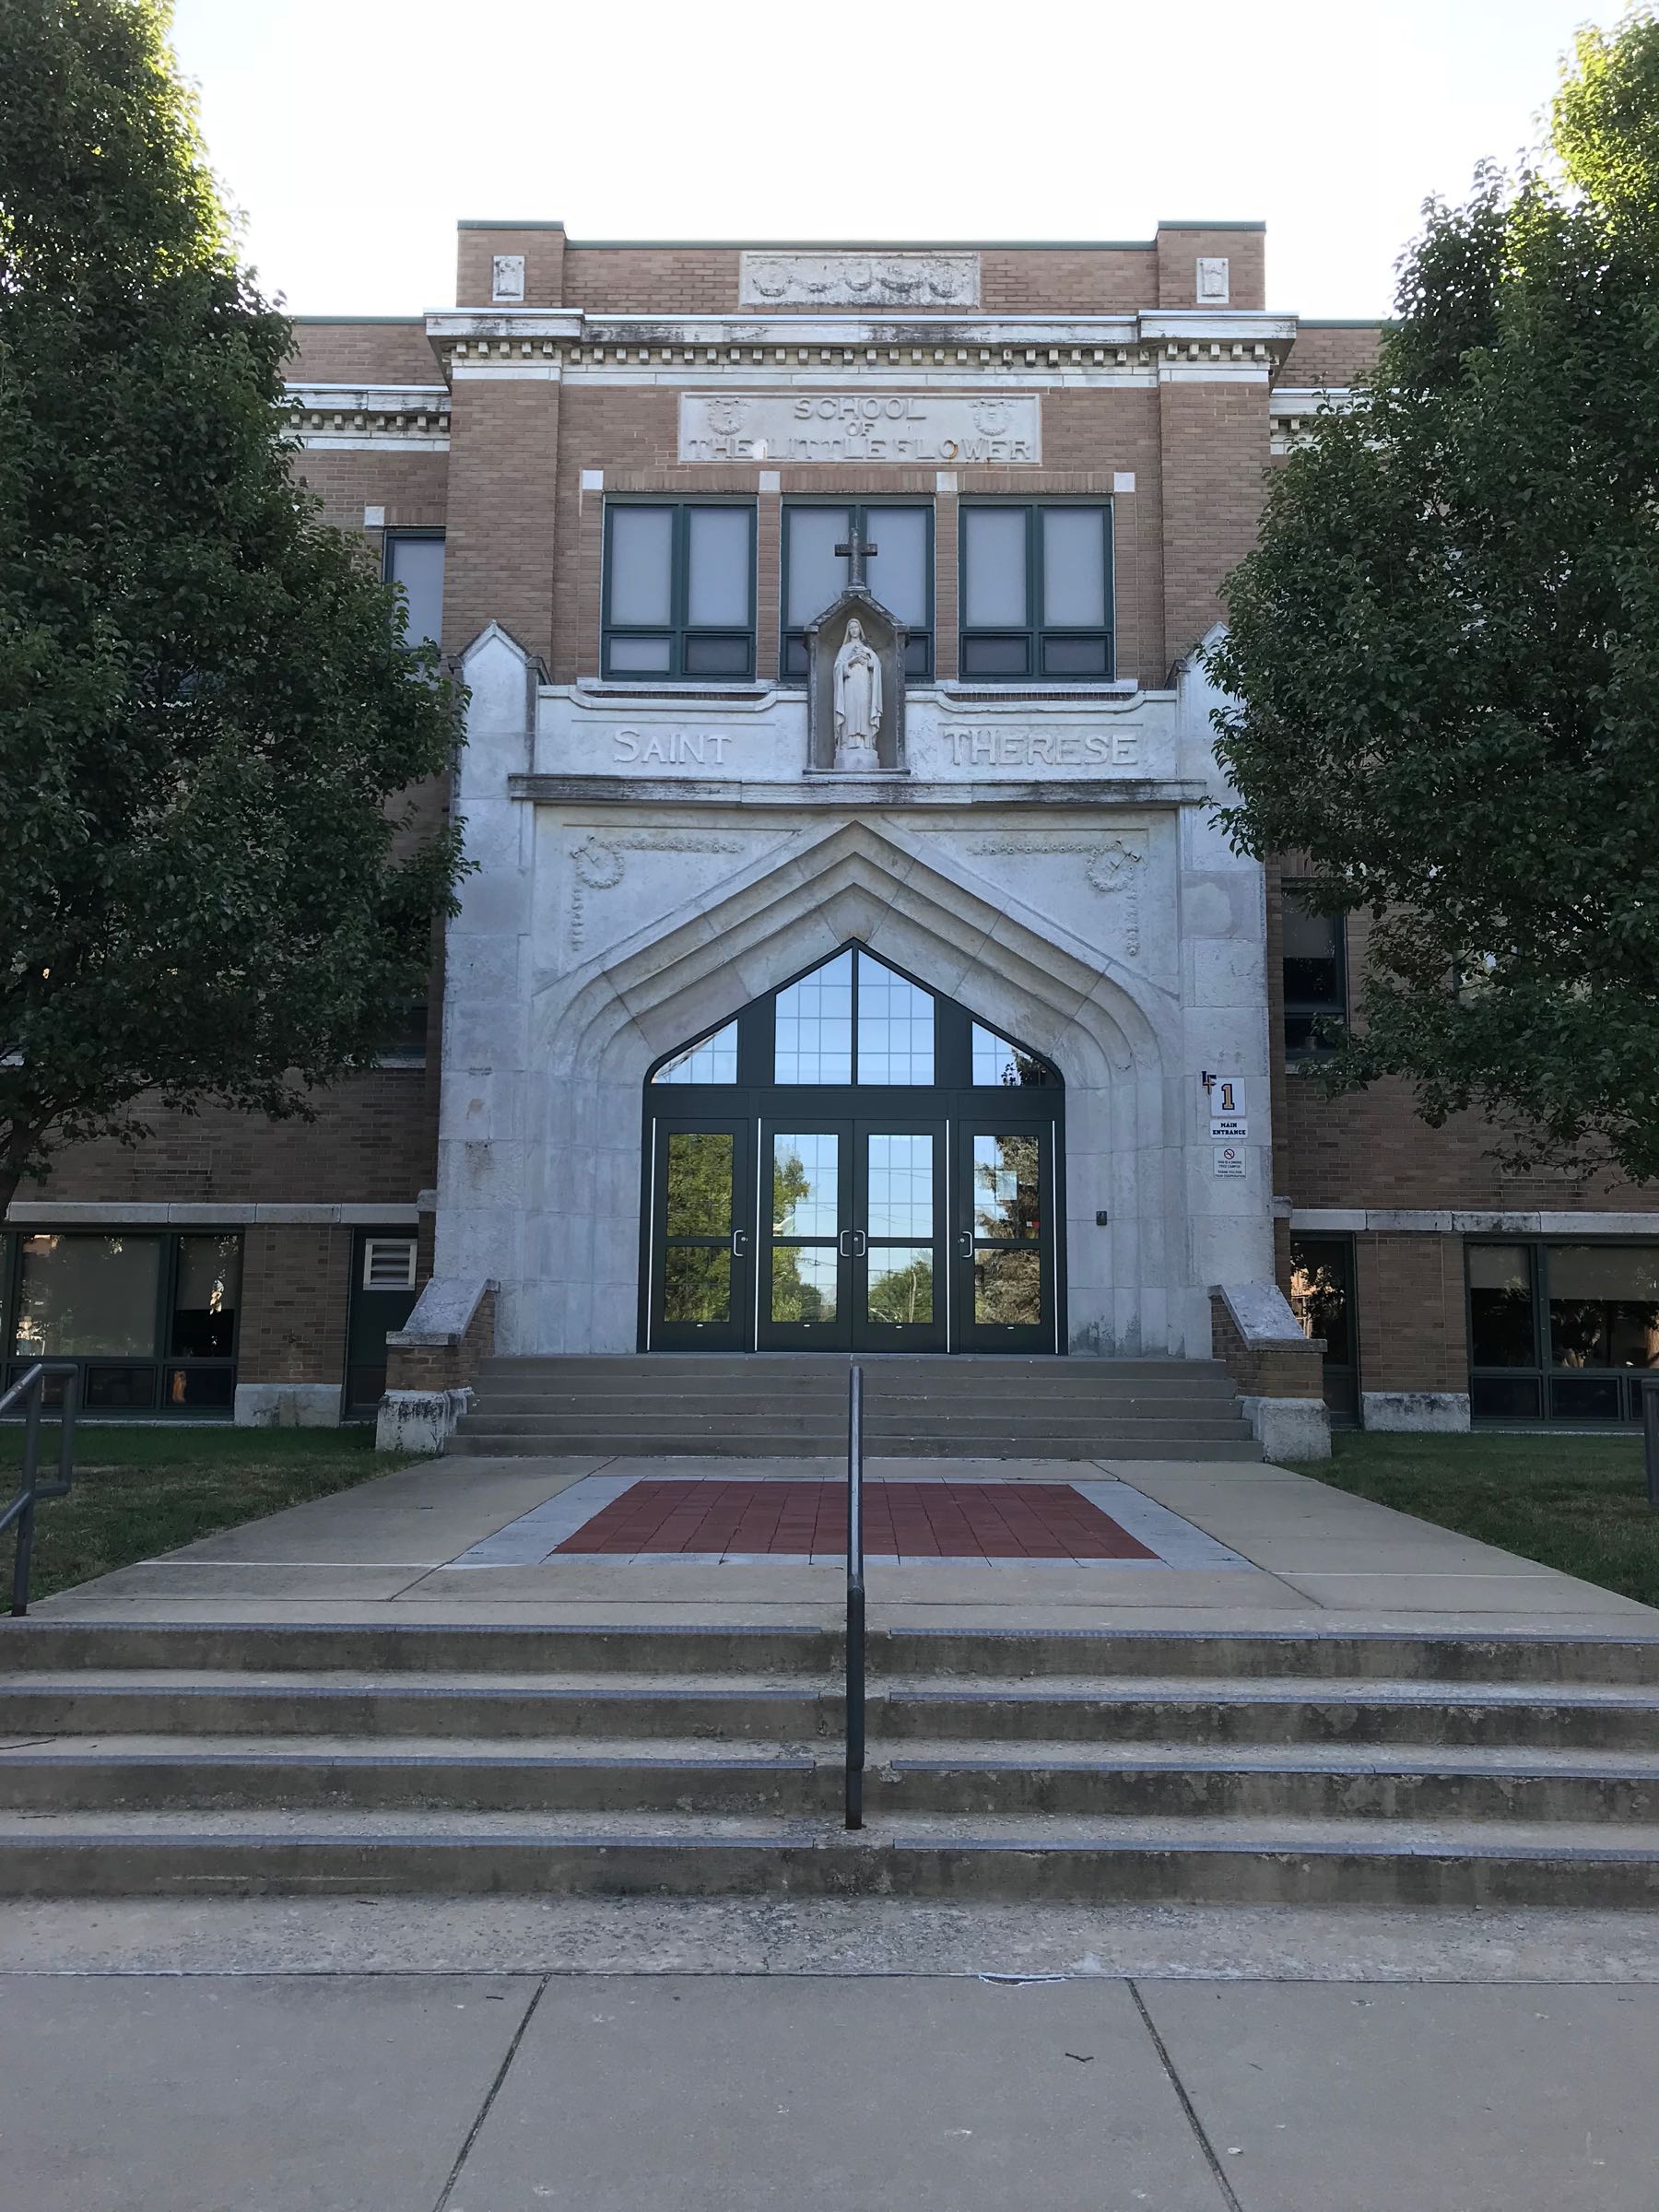
The Little Flower neighborhood was mostly developed by the earliest aerial photographs. The parish followed a common pattern, developing the school building first, followed by the church.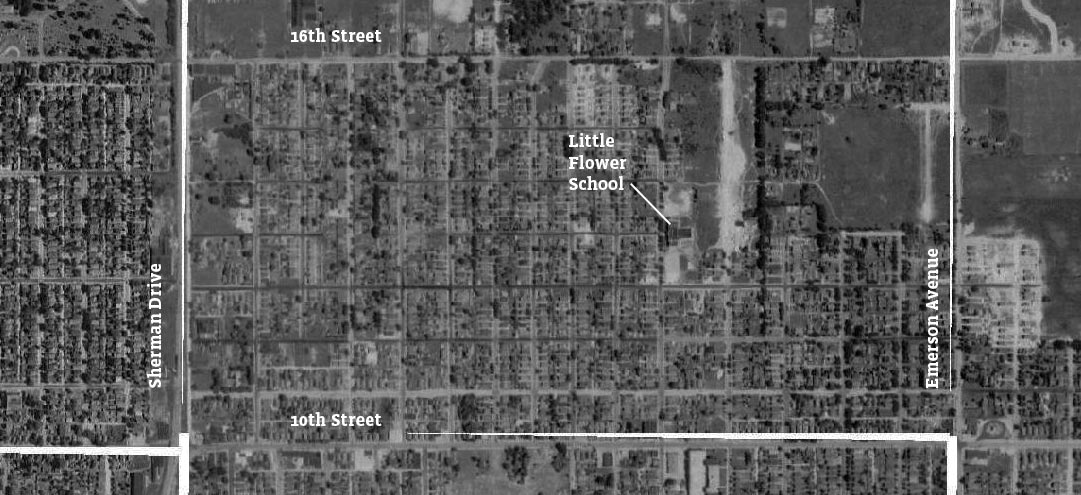
More College-Educated Residents, Residents in Their Thirties
Since 1970, Little Flower has been increasingly popular among young adults (age 20-34). The share of young adults grew until, in 1990, the neighborhood had a higher share of young adults than 78 percent of neighborhoods in the metro region. Since 2000, the share of young adults has actually tapered off, slightly.
The neighborhood has also become increasingly college-educated. In 1970, only 3 percent of residents had a bachelor’s degree, a lower rate the 83 percent of neighborhoods. Even in 2000, Little Flower’s college-educated rate was half the regional average. But in the last twenty years, the share of college-educated adults has increased by 223 percent. The neighborhood is now more educated than the median neighborhood in the region.
Little Flower is not attracting 20-34 year olds as well as other neighborhoods, given its declining rank in this indicator. It may be that the cohort of young adults in the neighborhood is aging. (A cohort is a population group of a given age. If you measure the same place ten years later, you might expect some of that same cohort would still live in the neighborhood and would now be ten years older.)
One-third of Little Flower residents are between 30 and 49 years old. The share of 20-29 year-olds has fallen since 2010, perhaps because that cohort aged. At the same time, there were increases among 30-49 year-olds and children.
These trends are not conclusive, but might suggest the retention of young families in the neighborhood, leading to increases in both middle-aged adults and children. However, the share of family households has not increased, according to the American Community Survey. Forty-seven percent of households were families in 2010, but only 44 percent in 2016.
Profile of Little Flower Residents in Their Thirties
As of 2016, residents in their thirties make up the largest share of Little Flower’s population. In order to better understand this growing segment of the neighborhood, we analyzed census metrics by age. (Often the age categories do not match across different indicators, so the groupings we use will vary.)
A 30-39 year-old in Little Flower is slightly more likely to be a woman than a man. (Fifty-six percent of this age group are women, according to the 2016 American Community Survey.)
A 30-39 year in Little Flower is slightly more likely to rent compared to the neighoborhood overall. About half of this group rents and half own their home (based on the 2010 Census, using the age group 35-44 years old). This is lower than the neighborhood’s overall 2010 home owernship rate of 58 percent.
As of 2016, women in their thirties are likely to be married (57 percent), but men are not (25 percent). As expected, roughly the same number of men and women are married in Little Flower, but men tend to be married in their forties.
25 to 44 year-olds more likely to carpool.
Means of Transportation to Work by Age
25 to 34 year-olds less likely to be in poverty.
Poverty Rate by Age
Real income declining for 25 to 44 year olds.
Median Households Income by Age (2016 USD)
Residents between 25 and 44 years of age are less likely to drive to work, but more likely to carpool, compared to the rest of the neighborhood. Only 76 percent of this group drives alone to work, while for the rest of the neighborhood, 87 percent drive alone to work. One in five 25-44 year-olds carpool, compared to only one in twenty for other age groups. They are less likely to take transit, and work at home at the same rate.
This group is less likely to be in poverty. Little Flower residents between 25 and 34 years old have a 12.1 percent poverty rate, which is almost half the neighborhood’s overall poverty rate (21.4%). An estimated two-thirds of 25-43 year-olds are at or above twice the poverty level.
Still, income is declining for this group. Median household income for householders age 25-44 was an inflation adjusted $55,701 in 2010, but has fallen to $41,184, and 26 percent decline. 25-44 year-olds earned more than the neighborhood overall in 2010, but now they are on par with other Little Flower households.
Little Flower has been a stable working-class community over the decades, and while education rates are rising relative to other neighborhoods, income is not. Seven out of ten neighborhoods have a higher average family income than Little Flower. It does not seem to show signs of dramatic neighborhood change and economic development, but Little Flower is home to a growing population of residents in their thirties. Retaining and serving those adults as they grow older will be critical to the success of the neighborhood and Indianapolis.
See How Your Neighborhood Has Changed
Find more interactive content from our series on neighborhood change.
No Results Found
The page you requested could not be found. Try refining your search, or use the navigation above to locate the post.
Next Up
 In Christian Park, a Postwar Neighborhood Experiences 21st Century Changes
Christian Park was subdivided in the 1920s, but mostly built after World War II. Once an all-white neighborhood with high home ownership, the area has become part of a Latino community on the southeast side, and home ownership has fallen.
 Income Inequality High Where Golden Hill and Northwest Indianapolis Converge
In the area where wealthy Golden Hills converges with the working-class neighborhoods of Northwest Indianapolis, income inequality is high and increasing. The area is also experiencing a growth of white households above the median income.
 Changes in Indy’s Historic Black Neighborhoods
In the 1970s, 4,000 residents left this nearly all-black neighborhood. Why? An increasingly desegregated housing market and closure of one of the country’s first public housing projects.
 Story Map: Moving Out – Suburbanization Since 1970
Indianapolis and Anderson were the region’s urban centers in 1970. Three-quarters of the population lived in those counties. Now, just over half the population live there, and Hamilton County is the second largest urban center.