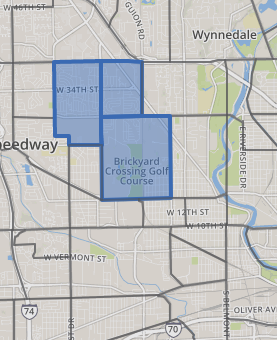
Though they developed as all-white suburbs between 1940 and 1970, the neighborhoods near the Indianapolis Motor Speedway are some of the densest and most diverse in Indianapolis.
In 1970, this area was fully developed, with a population of 17,886. The population was 99 percent white. Population had fallen slightly to 14,998 by 2010, but since then this area has been growing quickly. In 2016, the population was 16,104.
The population looks very different than it did in 1970, however. In 2016, 44 percent of residents were Hispanic, 28 percent black, 23 percent white, and two percent Asian, making this one of Indianapolis’ most diverse areas. According to a 2018 diversity measure from Esri, these three census tracts are among the top six in the county in terms of diversity.
According to Esri’s definition of their diversity measure, “the Diversity Index shows the likelihood that two persons chosen at random from the same area, belong to different race or ethnic groups. The index ranges from 0 (no diversity) to 100 (complete diversity).” These three tracts have diversity scores of 89.3, 89.3, and 86.5 out of 100.
Area Near Speedway Among Most Diverse in Indianapolis
2018 Diversity Index (Esri) by Tract
Tracts North of Speedway Growing Faster than Marion County
Population Growth Indexed to 2010
2010 Population = 100
Population and Density are Growing Since 2010
These tracts have been growing quickly since 2010. The annual growth rate in these three tracts between 2010 and 2016 was 1.8 percent, which is almost three times faster than Marion County’s 0.8 percent annual growth. For comparison, Hamilton County has been the fastest growing county in the region, at 2.5 percent annual growth.
The growth and diversity of the tract are probably linked. As we explored in our analysis of 2016 population estimates, net population growth in Marion County between 2015 and 2016 was due to growth in minority groups, despite population declines among whites. This area in northwest Indianapolis is on location where these populations are growing.
Despite a built environment that is largely suburban single-family homes, this area is also relatively dense, compared to Indianapolis. These three tracts, excluding the area with the speedway itself, have 5,169 people per square mile. That is over twice as dense as Indianapolis overall.
This Area Is Twice as Dense as Indianapolis
2018 Population Density (Esri) by Tract
Population Growing Faster than Marion County Overall
2010-2018 Population Growth Rate (Esri) by Tract
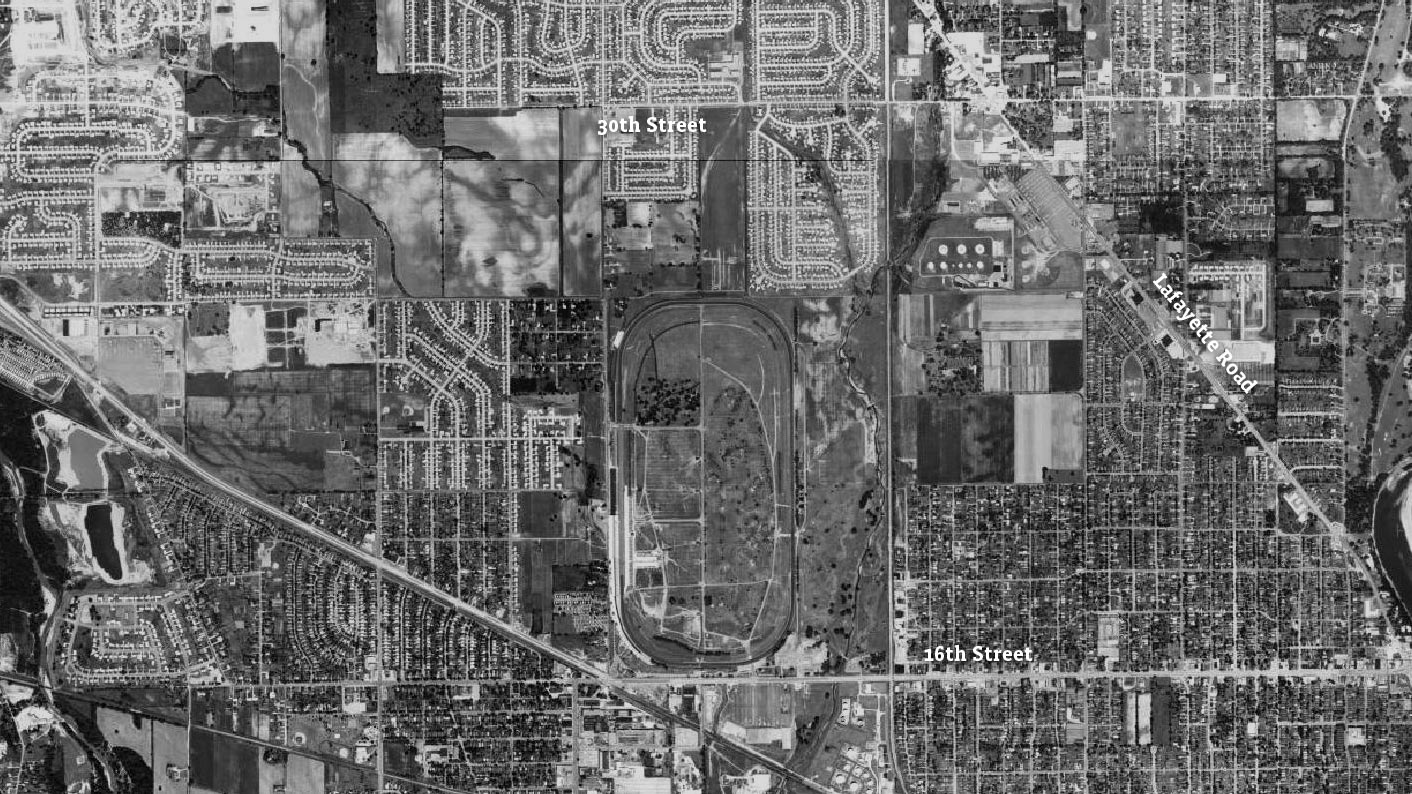
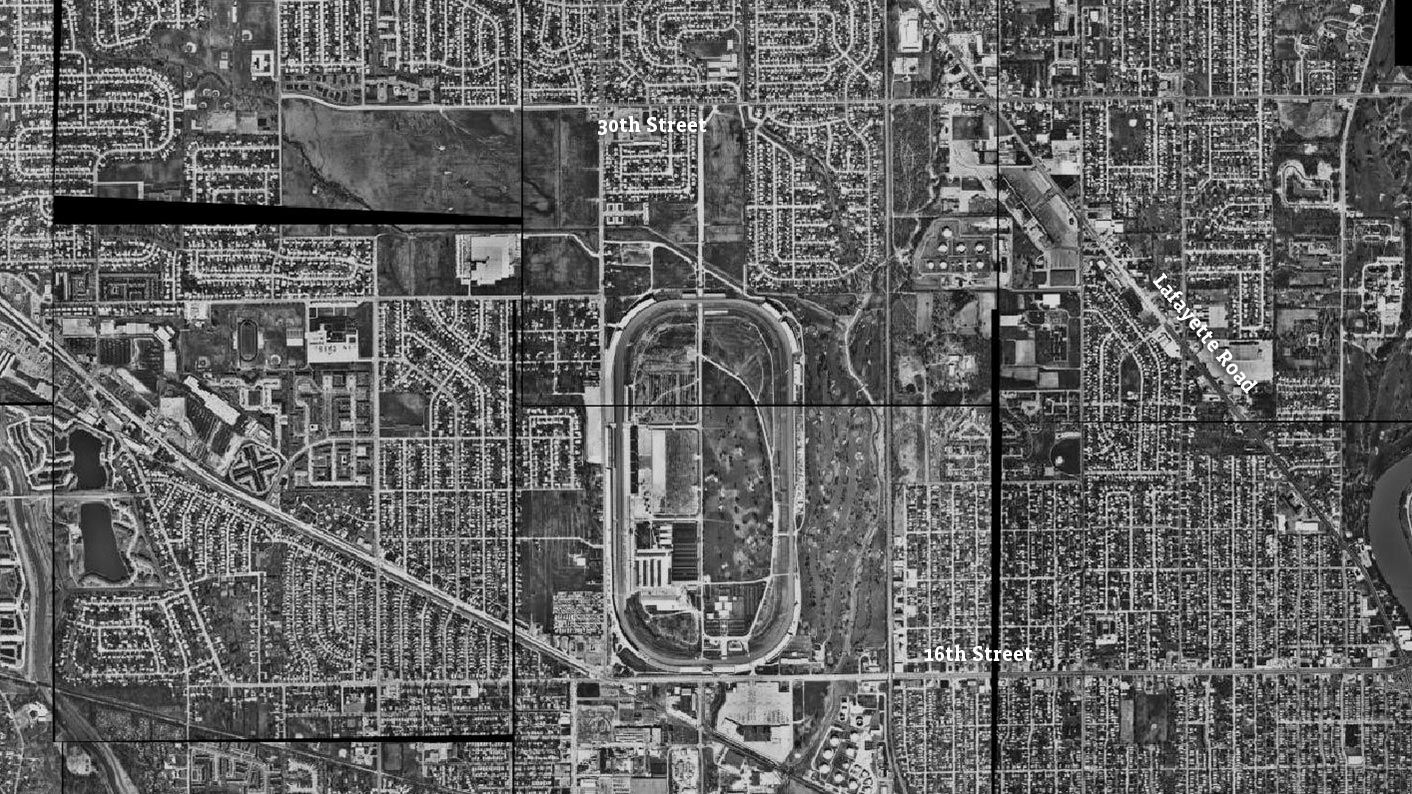
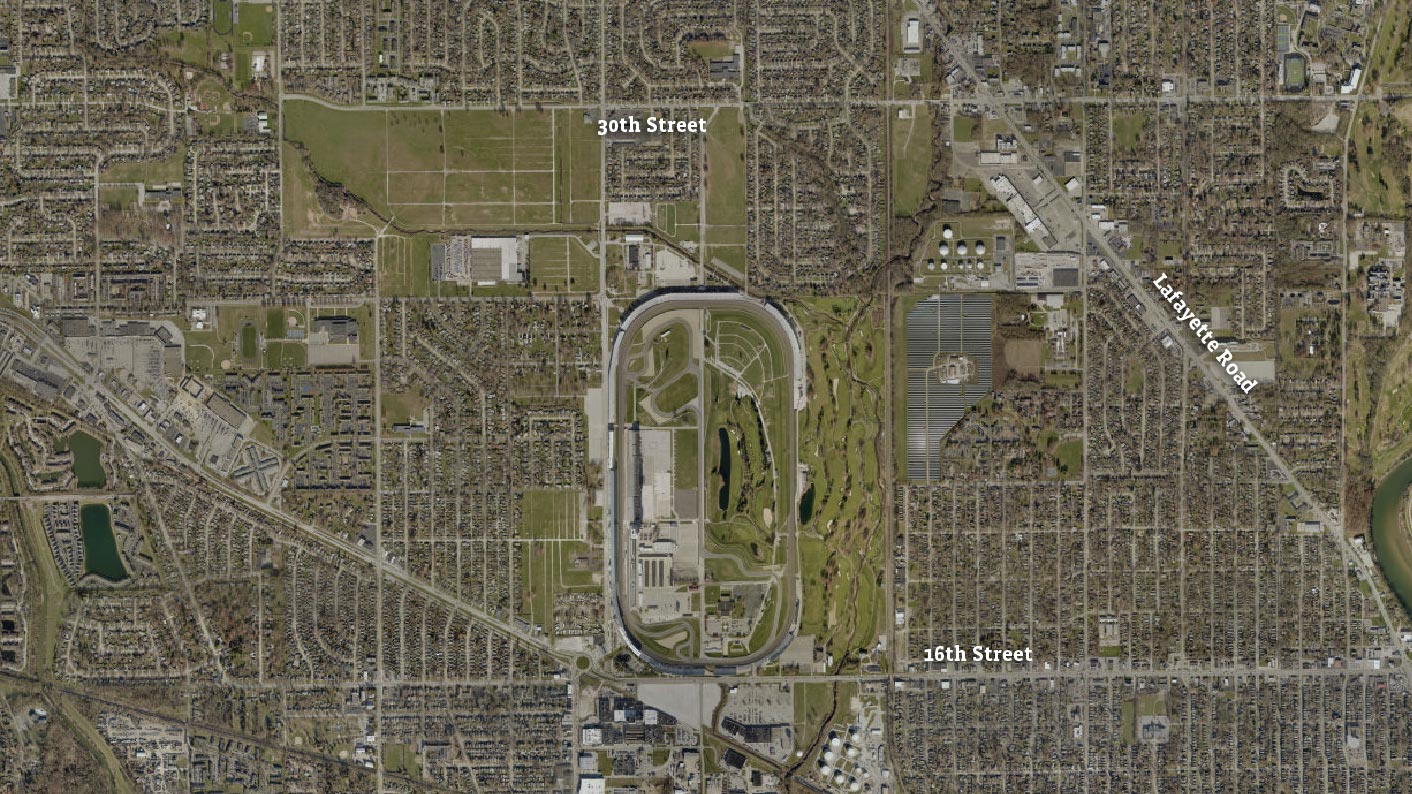
Watch as Neighborhoods near Speedway Develop
Scroll through the images to see how this area has changed through the decades. In 1941, this area was mostly farmland. Development was just starting to occur north of 16th Street. Two decades later, subdivisions filled most of the area to 30th Street and beyond.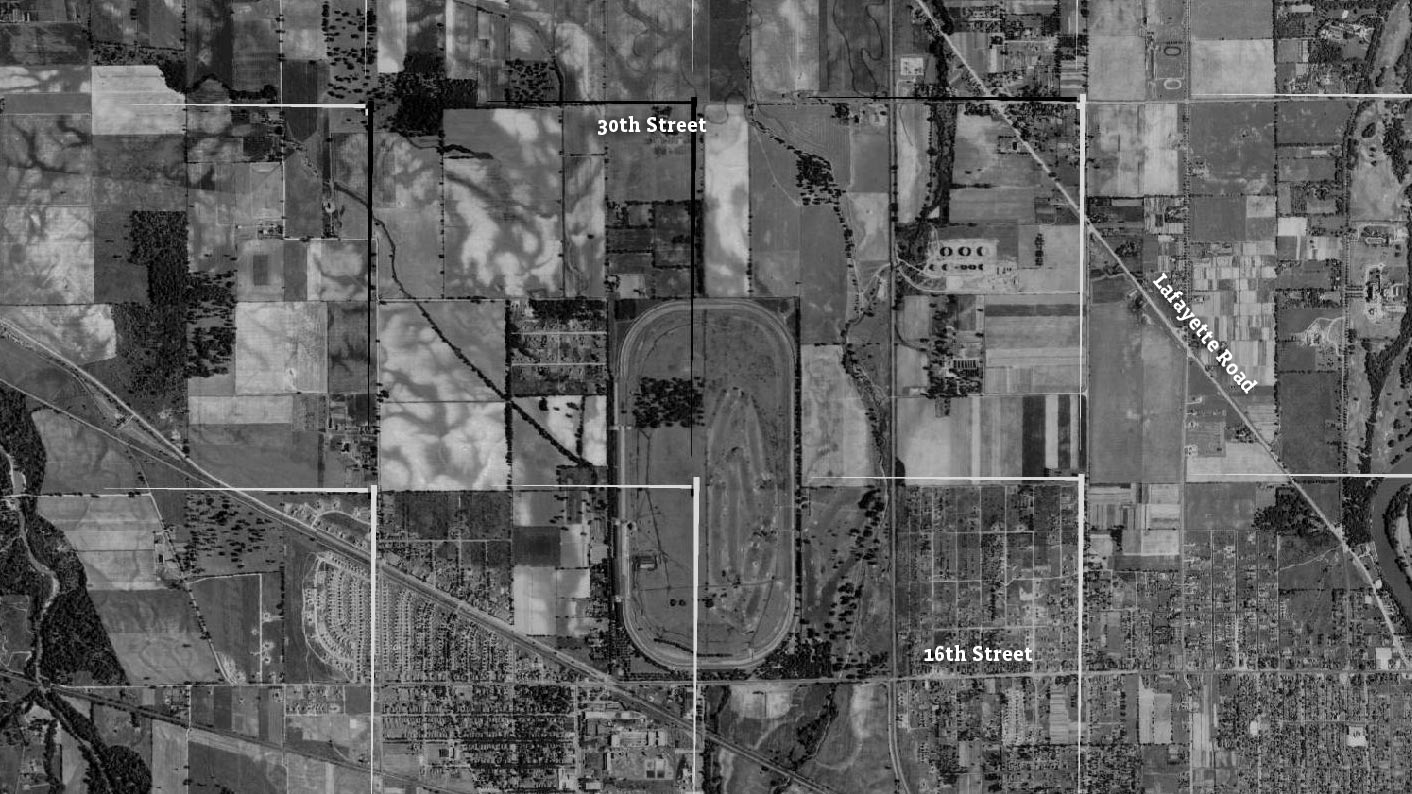
Youth Population Is Large and Particularly Diverse
This area has a large share of youth population 14 years old or younger. One fourth of residents are age 14 or younger, which is higher than 80 percent of Indianapolis census tracts. The large youth population is probably linked to the diversity of this tract. Across the county, young people are far more diverse than the population overall. In Marion County, people of color account for 65.5 percent of youth (under 18), but only 38.4 percent of adults.
Marion County Youth Are More Diverse than Adults
Population by Race and Age for Marion County (2016)
Click “Under 18” and “18 and Older” to compare race across these two age categories.
Within Marion County, the areas with the most youth aged 14 and younger are mostly in Decatur Township, Franklin Township, northwest areas along Lafayette Road and northeast areas along Pendleton Pike. The Near Eastside and Near Westside also have high rates of youth population. Areas with low rates of youth population include downtown Indianapolis, the corridor along North Meridian Street, and neighborhoods in the north-central area of the county.
Youth Population Higher than 80% of Indianapolis
2018 Pct. of Population Age 0-14 (Esri)
See How Your Neighborhood Has Changed
Find more interactive content from our series on neighborhood change.
No Results Found
The page you requested could not be found. Try refining your search, or use the navigation above to locate the post.
Next Up
 Story Map: Race and Migration Since 1970
In 1970, half of the region’s Black population lived in 12 square miles north of downtown Indianapolis. As Black residents moved into ’60s suburban communities, 120,000 White residents left the city’s core for newer suburbs.
 What We’re Reading: February 21, 2018
This week, Health Affairs reports on high child mortality in the US, NPR dives into the contract workforce, and NASA offers a very cool population estimator.
 The Changing Demographics of the Foreign-Born Population in America and Indiana
We recently came across these interesting maps created by the Pew Research Center showing the changing demographics of the foreign-born population in America. Several media outlets featured these fascinating maps where Pew compared the biggest sources […]
 Worst social crisis in the country?
One in three children in America grow up without a father in the home. Seventy-three percent of Black children in the U.S. are born to single parents. Only 16% of […]