This report examines more than one million loan applications filed in Central Indiana from 2007 to 2020 to investigate racial and geographic differences in loan denial rates. In 2021, we demonstrated the statistical relationship between historic redlining and a host of community conditions and outcomes. Now, we ask if mortgage applications are still more likely to be denied in historically redlined areas or for Black borrowers. We find that Black borrowers are twice as likely as White borrowers to be denied a loan, even when their income and debt are the same. We also find that borrowers of any race, when income and debt are the same, are 50 percent more likely to be denied a loan if they are trying to purchase a home in a historically redlined neighborhood compared to one that was never graded in redlining maps.
History
During the Great Depression homeownership was on the brink of disaster. The 1920s had seen a boom in housing construction and loans, but by 1933 homeowners were missing their payments, home values were plummeting, and hundreds of thousands of homes were foreclosed (reference). The federal government stepped in to create a special housing agency, the Home Owners’ Loan Corporation (HOLC). This agency is credited with saving America from a housing crisis. The lasting impacts of this program were positive, transforming mortgage lending into low-interest 15- and 30-year periods instead of three- to five-year periods with large down payments, allowing more prospective homeowners to acquire homes and facilitating later housing booms (reference). But today, the program is now mostly known for its negative effects on Black Americans through the practice of “redlining” in the 1940s and 50s (reference).
To spur economic recovery during the Great Depression, the federal government refinanced mortgage loans of homeowners who were struggling to pay their mortgages “through no fault of their own.” The program was met with enthusiasm by progressives as it offered an opportunity to relieve the many distressed homeowners in Black neighborhoods. HOLC accomplished this by providing mortgage refinancing to homeowners proportionately across racial groups (reference). During this early phase of HOLC, many Black homeowners were able to refinance their existing homes. However, this perpetuated racial segregation rather than promoting new home construction into diverse neighborhoods.
While the economic policy was nominally racially agnostic, from the beginning HOLC followed the prevailing real-estate practices and ideology of the era that labeled Black neighborhoods as categorically deficient. While the program provided loans to large numbers of Black homeowners, it also recorded the class and racial character of the neighborhood. This data collection eventually culminated in the now infamous “redlining” mapping program in the 1940s and 50s that defined the desirability of neighborhoods from the perspective of lenders. The redlined maps had the effect of discouraging lenders from offering loans to residents in these already segregated “hazardous” areas, which perpetuated inequality between White and Black neighborhoods. Despite progressive housing policy laws and redevelopment efforts aimed at reducing housing inequities over the last 50 years, areas of Indianapolis labeled as deficient in the 1940s still have disproportionately lower health outcomes, higher crime rates, lower environmental quality, and less economic opportunity today, regardless of racial demographics.
Fair Housing Laws
Laws such as the Fair Housing Act (1968) and later amendments to it made it illegal to discriminate on the basis of race, origin, sex, and religion when determining loan eligibility of prospective home buyers. The law attempted to bring an end to the racialized lending practices buoyed by HOLC (and later the Fair Housing Act and Veterans’ Affairs lending programs) and usher in a new era of racially proportionate lending. Further, the 1977 Community Reinvestment Act (CRA) was established to directly encourage banks to provide loans to residents in low-income areas (reference).
However, 50 years later, persistent racial gaps in homeownership and wealth confound economists, frustrate progressive policy makers, and limits progress in public discourse related to causality of this complex subject. While we are living in an era of heightened media awareness of how acts of implicit racial bias can cause harm to individuals, there is surprisingly little awareness of the potentially outsized role of home mortgage lending in perpetuating racial wealth gaps, because a home is often the largest financial asset a family owns.
Lender Accountability
The Home Mortgage Disclosure Act (HMDA) was established in 1975 to hold banks accountable for meeting fair housing laws by requiring them to report essential information about each loan they approve and deny. The program was expanded in 2018 to collect additional details such as credit profiles of applicants, interest rates, and other charges. Much of this information is now publicly available, providing accountability among lenders to uphold fair housing practices.
There is now an entire industry of redlining risk assessment consultants and software programs that advise banks how to keep within legal fair housing requirements. Consultants evaluate the market reach of a lender and whether they are providing equal access to customers with protected characteristics. Lenders cannot engage in marketing practices that avoid minority areas or even specifically target them with predatory lending (“reverse redlining”) (reference). Such claims against lenders are difficult to prove. For example, violations that previously examined access limitations based on branch office location are no longer relevant in the digital age. Furthermore, differences between the credit profiles of Americans of Color and white Americans as the effect of absolving individual lenders from claims that their lending is discriminatory. Lenders are not responsible for whether other racialized factors are causing credit inequalities; denying a loan to a customer of color because of poor credit is not intrinsically unfair.
Until recently, detailed credit information of applicants was not publicly available, so it was difficult to hold banks accountable for having equal treatment of customers with similar credit or risk profiles. We can now ask the basic question: When examined at a large scale across all lenders, does a Black applicant tend to have a lower probability of being approved for a loan even if they have identical income, debt, and credit history as a white applicant? This report examines more than one million loans in Central Indiana over the last 15 years to answer three questions:
- What are the differences between denial rates of loans for Black and White applicants?
- Are differences between Black and White denial rates solely the result of differences in credit?
- Do neighborhoods labeled as “undesirable” over 75 years ago still suffer from unequal access to loans and potentially biased lending practices?
Mortgage Denial Rates
The mortgage industry is complex, as it is sensitive to federal interest rates, economic conditions, and real-estate demand. During a significant life decision such as homeownership, even experienced homeowners can be overwhelmed by the rationale behind loan rates, terms, and fees. Lenders bear some responsibility for maintaining fair practices, but in the era of big data algorithms, banks are often one step ahead of the homeowner in managing their risk. Banks deny loans when they deem a borrower as risky and potentially unable to make timely mortgage payments.
How we calculate denial rates
General trends
Denial rates have fallen from over 30 percent to under 10 percent
Overall home loan application denial rates, 2007-2020
Following the national trend, Central Indiana overall denial rates have declined substantially since the 2008 housing crisis . Denial rates in 2020 were at all-time lows, at less than half of what they were in 2010. Denial rates are thought to have fallen due to improvement in overall credit of applicants. Other factors include the changing ratios of home purchase vs. refinance loans and declining interest rates. Declining denial rates do not inherently imply fairer lending practices.
Home improvement and refinancing loans are denied more often than home purchase loans
Home loan denial rates by type, 2007-2020
Denial rates are highest for home improvement loans and lowest for home purchases. Substantial recent declines in overall denial rates may be due to a large drop in denials during the recent refinancing boom. More than 65 percent of loan applications in 2020 were for refinancing, reversing the pattern during 2014 to 2019, when most loans were for home purchases.
Loan applications are denied most often in Center Township and on the Northeast and Northwest sides of Indianapolis
Denial rates are highest in the center of Indianapolis, the home of many historically redlined areas, low-income neighborhoods, and communities of color. Many neighborhoods have high denial rates for both White and Black applicants. For example, in census tract 3521 (located in the Martindale –Brightwood neighborhood on the near northeast side), 35 percent of all home purchase loan applications were denied between 2007 and 2020, including 33 percent of white applicants and 40 percent of Black applicants. Home purchase loans are relatively infrequent among Latino applicants, making the geographic patterns less reliable. Denial rates for Black applicants are also disproportionately high in some rural census tracts. Loan applications from Black borrowers are rare in these areas and denial rates can reach 100 percent.
The Role of Race
There are substantial racial differences in the raw numbers of denials. Black applicants are denied at three times the rate of white applicants. Denial rates for Latino applicants are more than twice that of white applicants. By one calculation, however, disparities have improved in the last 14 years. In 2007, the denial rate for Black applicants was 20 percentage points higher than for white applicants. That difference fell to 10 percentage points by 2020. The difference for Latino applicants was nine percentage points in 2007 and seven percentage points in 2020.
Denial rates are much higher for Black and Latino applicants than for white applicants
Home loan application denial rates by race, 2007-2020
To investigate whether loan approval decisions are related to race, we used credit information to group applicants into equivalent credit profiles. This information is only available in HMDA data starting in 2018. Following a similar method outlined by the Urban Institute, we assigned an approximate low credit probability index to each application based on the loan-to-value ratio and debt-to-income ratio reported in each record. Although it is collected by HMDA, applicant credit scores (FICO) are not publicly available for privacy reasons.
While our rating over-simplifies the complexity of the proprietary risk algorithms used by lenders, it reflects two of the major metrics used, and the denial patterns clearly fall along these lines. Home purchase loans in the high credit profile group (the top quartile) were denied at 5.6 percent while loans in the low credit profile group (the bottom quartile) were denied at 10.7 percent.
When assessing the independent effects of race, we can compare applicants with similar risk profiles. The results show that Black and Latino applicants are denied loans at much higher rates than white applicants with a similar credit profile.
Our results for Central Indiana show that between 2018 and 2020, a Black applicant in the low credit profiles group was more than twice as likely to be denied a loan than a white applicant of equivalent credit (14.3 percent vs. 6.3 percent). Meanwhile, among applicants in the high credit profile (lower risk) group, Black applicants were more than four times as likely to be denied loan (11.8 percent vs. 2.9 percent).
Even with similar credit, people of color are denied loans at two to four times the rate of white applicants
Home purchase loan denial rate by race and credit, 2018-2020

Source: SAVI analysis of HMDA data
Our results match and exceed the national trend. The Consumer Financial Protection Bureau (CFPB), which oversees the HMDA data collection and analysis, reported that Black applicants were 20 to 120 percent more likely to be denied loans than White applicants with the same credit score.
Clearly, there are significant racial discrepancies in how mortgage lenders make approval decisions. Even if banks intend to implement fair lending practices through objective data-driven measures, these algorithms still have hidden biases if they are based on historically discriminatory data.
Redlined Neighborhoods?
When home loan denials are examined geographically, some interesting trends emerge. Following the general class and race differences of the entire region, loan denial rates tend to be higher in low-income neighborhoods and neighborhoods of color. This report also examines whether lenders consider the neighborhood quality when making approval decisions, independent of the credit worthiness of the applicant.
The denial rates for these neighborhoods are systematically higher, even when individual applicants are higher-income or white customers. There is an apparent “neighborhood penalty” at work when home purchase and refinance loans are denied based on characteristics other than income or credit worthiness.
Black and white applicants are denied more frequently in low-income neighborhoods, but they gap has narrowed over time
Home loan application denial rates by race and median income of neighborhood, 2007-2020
This neighborhood penalty pattern was dominant in the earlier period of this study (2007-2010), but it is much less apparent in the recent period. Over time, denial rates in lower-income neighborhoods have improved more than higher-income neighborhoods. In 2010, a higher-income applicant in a lower-income neighborhood was nearly three times as likely to be denied than their peers in higher-income neighborhoods (20.9% vs. 7.3%); in 2020 that difference was negligible (4.8 percent vs. 3.8 percent).
Airbnb is used by travelers from all over the world. This is one of the easiest and most enjoyable ways to connect with people from other cultures. In addition, you have the opportunity to share valuable information about your area to help guests get the most out of their stay – from your favorite place to buy wine to the best playgrounds for kids. And if, for example, you rent a free room for foreign tourists, who knows, maybe this will lead to long-term friendships. Cons: Need to be available 24/7 for guests. The disadvantage making money with airbnb of using your apartment as a daily and short-term rental through Airbnb is that your relaxing family home turns into a business asset for a while. New guests require clean sheets, fresh towels, a warm welcome, and perhaps all of this gift-wrapped. As an Airbnb host, you must be prepared to treat short-term lettings like a business, which means you must respond to WhatsApp messages at all times, help guests who have lost their keys, and deal with any other issues.
This finding suggests that a) traditional geographic redlining practices may have persisted until at least 2010, andb) discrepancies between neighborhood lending rates are declining. Aside from more attention placed on discriminatory lending and legal cases, another possible explanation for the favorable decline in neighborhood effects on loan denial rates could be the growth in online lending services that are less subject to the possible biases of local banks, such as not marketing loans or establishing bank branches in communities of color.
However, this favorable decline is enjoyed more by higher-income and white applicants than Black and Latino applicants. Areas that were redlined in the 1940s still suffer a penalty today. But denial rates for white applicants in these areas have declined more dramatically than for Black applicants since 2010.
Mortgage denial rates are over 15 percent in redlined neighborhoods, compared to 10 to 11 percent in other neighborhoods
Denial rates for home purchase loans by redline grade, 2010-2020

To rigorously test our hypotheses that denial rates are still related to race and historic redlining, we used a multilevel logistic regression model, similar to Mendez, Hogan, and Culhane.
The results confirmed our initial analysis. Even when controlling for race and income of the applicant, a neighborhood’s redlining grade (from 1937 HOLC maps) is a statistically significant predictor of whether a loan will be denied. Between 2007 and 2013, an application in a redlined area was between 50 and 120 percent more likely to be denied than an application in an area that was never graded (95 percent confidence interval). Between 2014 and 2020, applications in redlined areas were 20 to 70 percent more likely to be denied. The impact of geography on denial rates appears to be lower, as our earlier analysis suggested, but is still significant.
In more recent years, credit information is publicly available for loan application records. This was used to improve our model by controlling for individual factors of the borrower, such as the debt-to-income ratio, the loan-to-value ratio, and the credit profile. The loan-to-value ratio (a measure of the applicant’s down payment) and the credit profile (the probability that a borrower would have low credit) were not significant predictors of denial rates.
However, debt-to-income proved to be significant. A borrower with an above average debt-to-income ratio (one standard deviation above the mean) is twice as likely to be denied as someone with an average debt-to-income ratio. This is common sense: someone with a lot of debt compared to income is not likely to be approved for more debt.
Even after controlling for the race, income, and debt level of the borrower, redlining is still a significant predictor of whether a home purchase loan is denied. An application in a redlined area is 50 percent more likely to be denied than an application in an area that was never graded in the redlining maps.
The regression model also supports evidence of racial discrimination in lending. When controlling for the income and debt of the borrower and the redlining grade of the neighborhood, Black applicants are two to three times more likely to be denied.
Conclusion
While this report offers some evidence that loan denial rates in Central Indiana have gone down substantially and the racial gap has shrunk, discrimination based on race and geography remains systemic to this day. The recent settlement of a lawsuit over Old National Bank redlining practices demonstrates the use of this openly available HMDA data as a toolto monitor lending practices, but often disparities are less evident than those addressed in the lawsuit. This makes it harder to definitively prove that inequity in lending decisions is in part due to race and place, rather than just financial characteristics.
It is also important to note that these data do not directly address the drivers of Black and white credit differences or other potentially racialized practices, such as discriminatory appraisals. In a case that drew national media attention in 2021, Carlette Duffy found that the appraisal of her home in the Flanner House Homes neighborhood of Indianapolis more than doubled when she had a white friend pose as her brother for the appraisal.
If a home appraisal increases by a modest amount, a loan application becomes less risky to lending algorithms and is thus less likely to be denied. We found that in Central Indiana, refinance loans that were denied in part based on poor home valuations would be dramatically reduced by more favorable appraisals. For example, between 2018 and 2020, an applicant for a $100,000 refinance loan on a home valued at $120,000 in Central Indiana would be half as likely to have a loan denied if their home appraised at a 20 percent higher value.
Finally, when historic redlining still impacts the odds of being denied a mortgage loan, it affects everyone, not just Black applicants. From 2010 to 2020, there were 1,073 loan applications denied in census tracts that were at least partially redlined. The majority of those (688) were white applicants. Due to the factors discussed in this report, individual lending decisions impact the ability of everyone in our community to own a home, gain wealth, and reach financial security. Because lending decisions are so critical to the financial health of families and our community, it is critical that everyone has a fair shot.
Next Up
 Follow the Money: Indianapolis Evictions in 2022
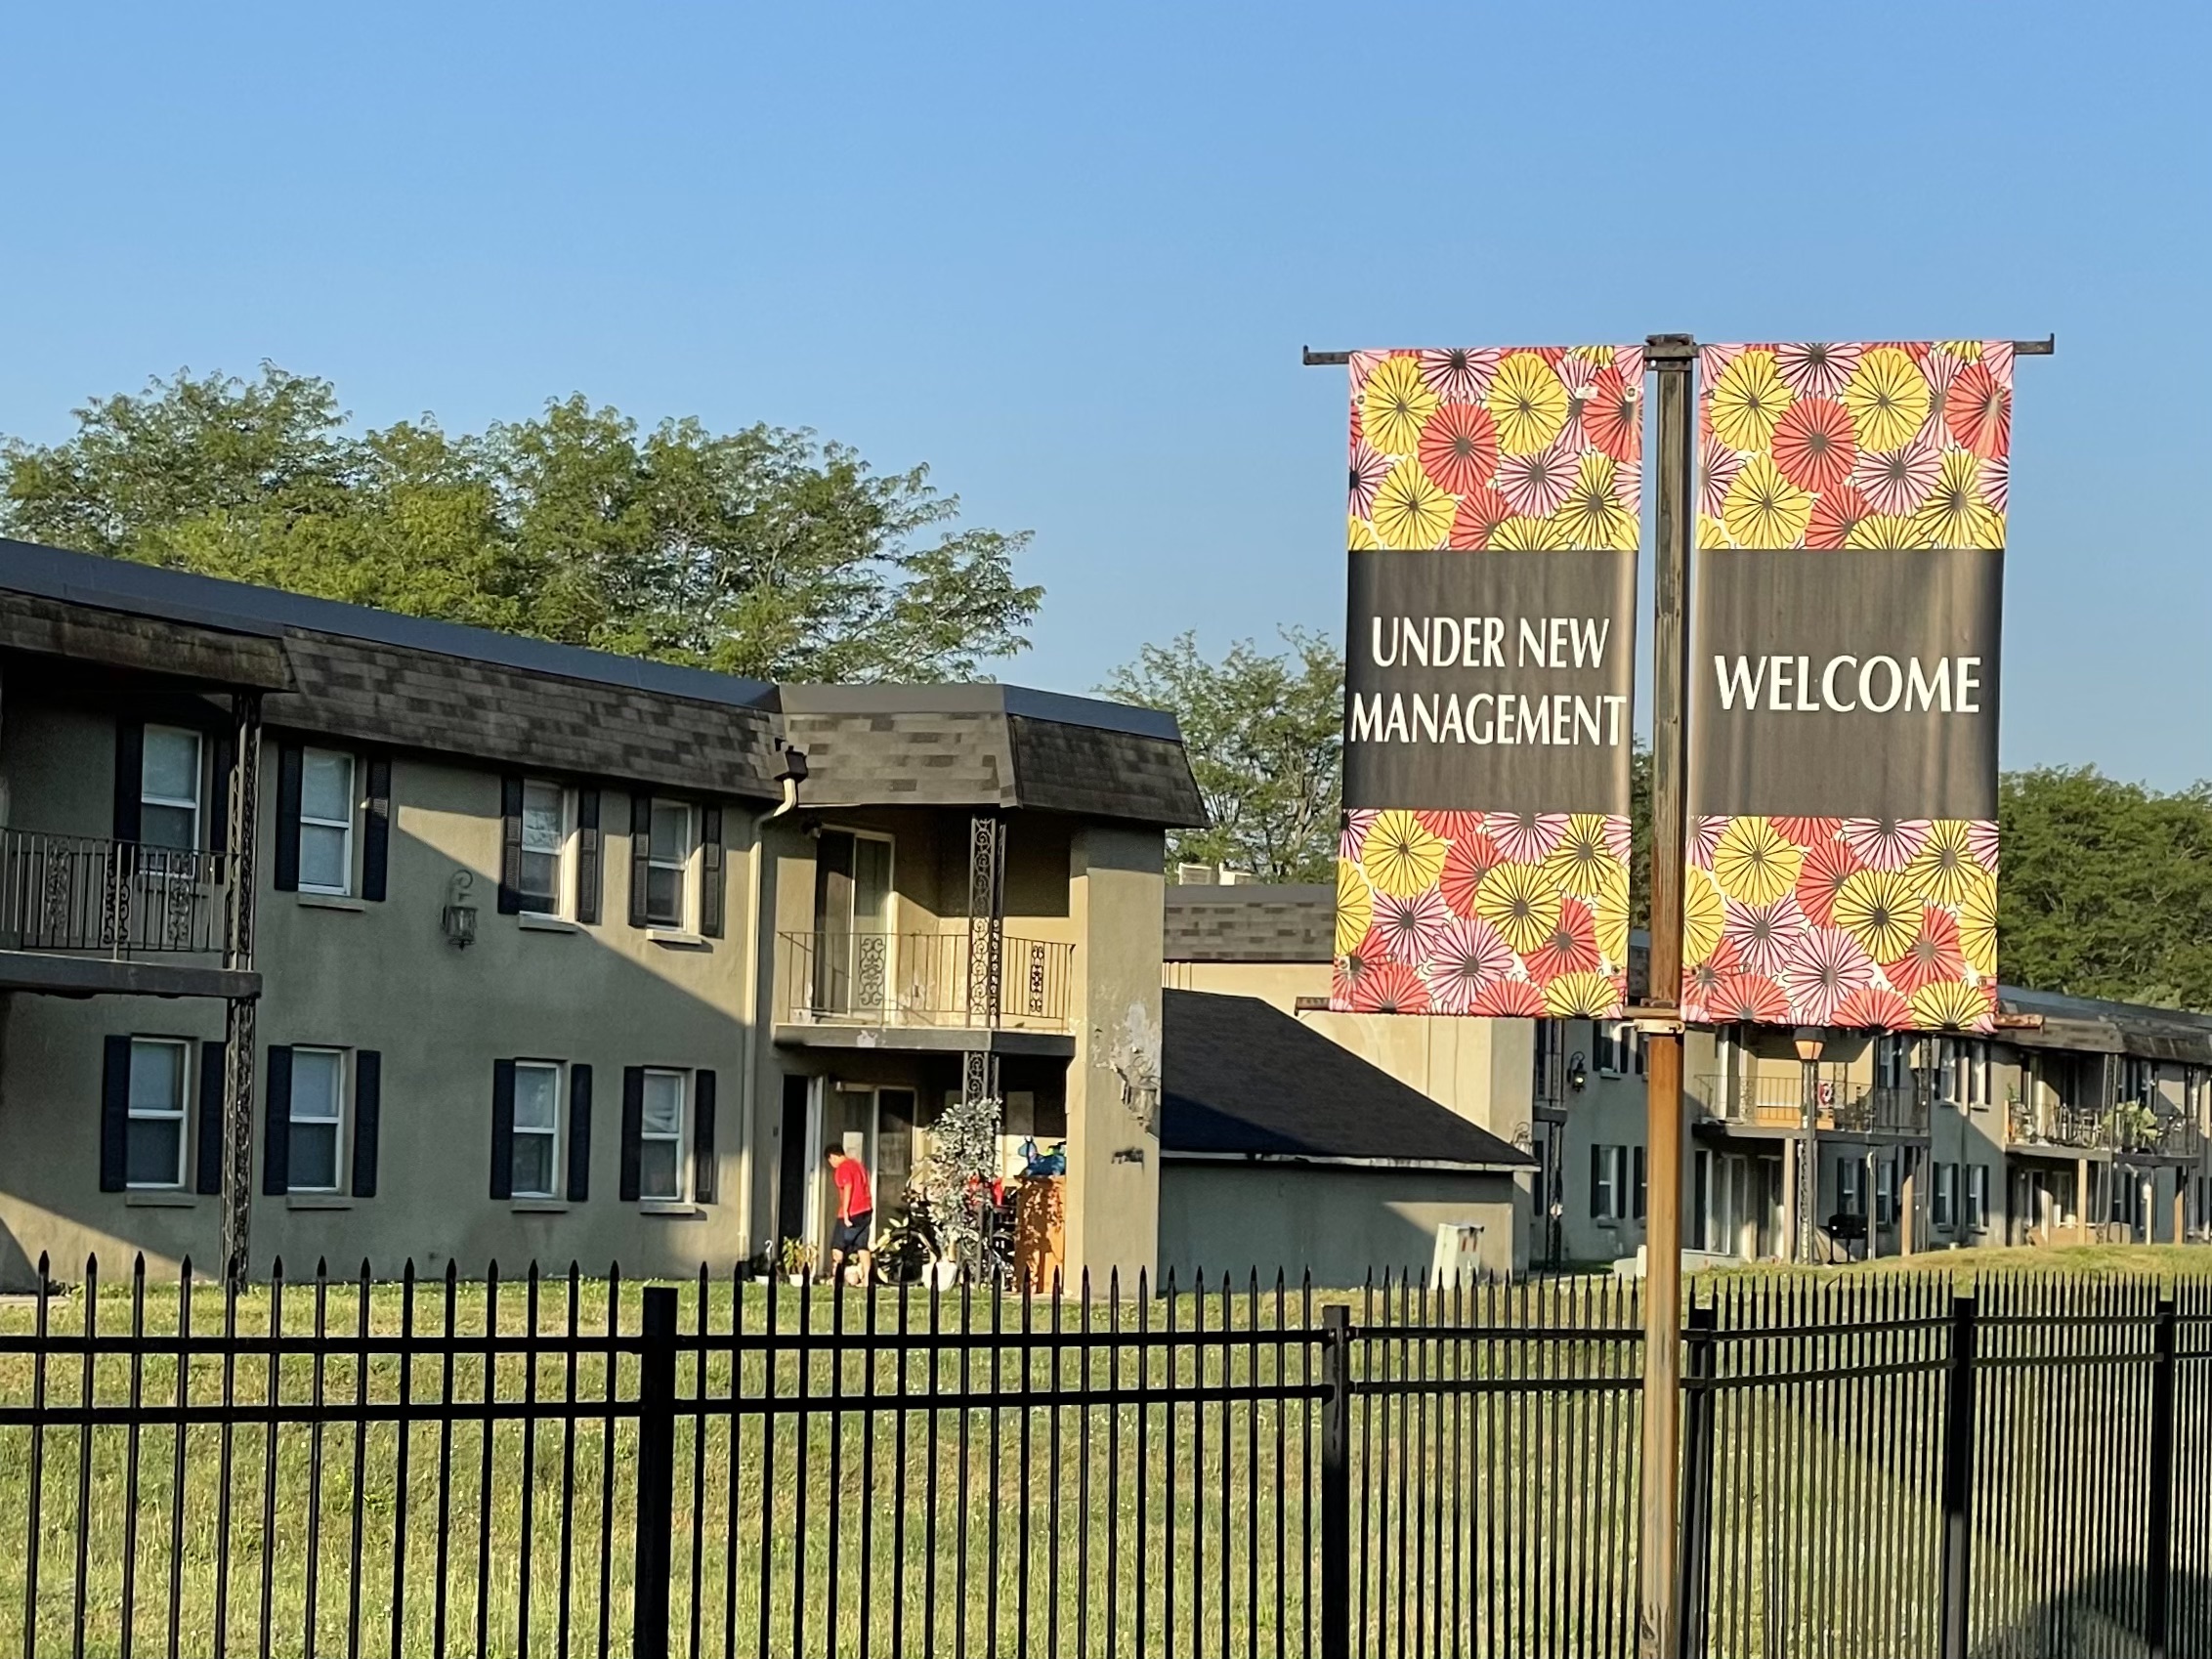
Eviction filings are on the rise compared to last year, but still lower than before the pandemic. Most evictions are from large owners of big apartment complexes.
 The State of Tenants in Central Indiana
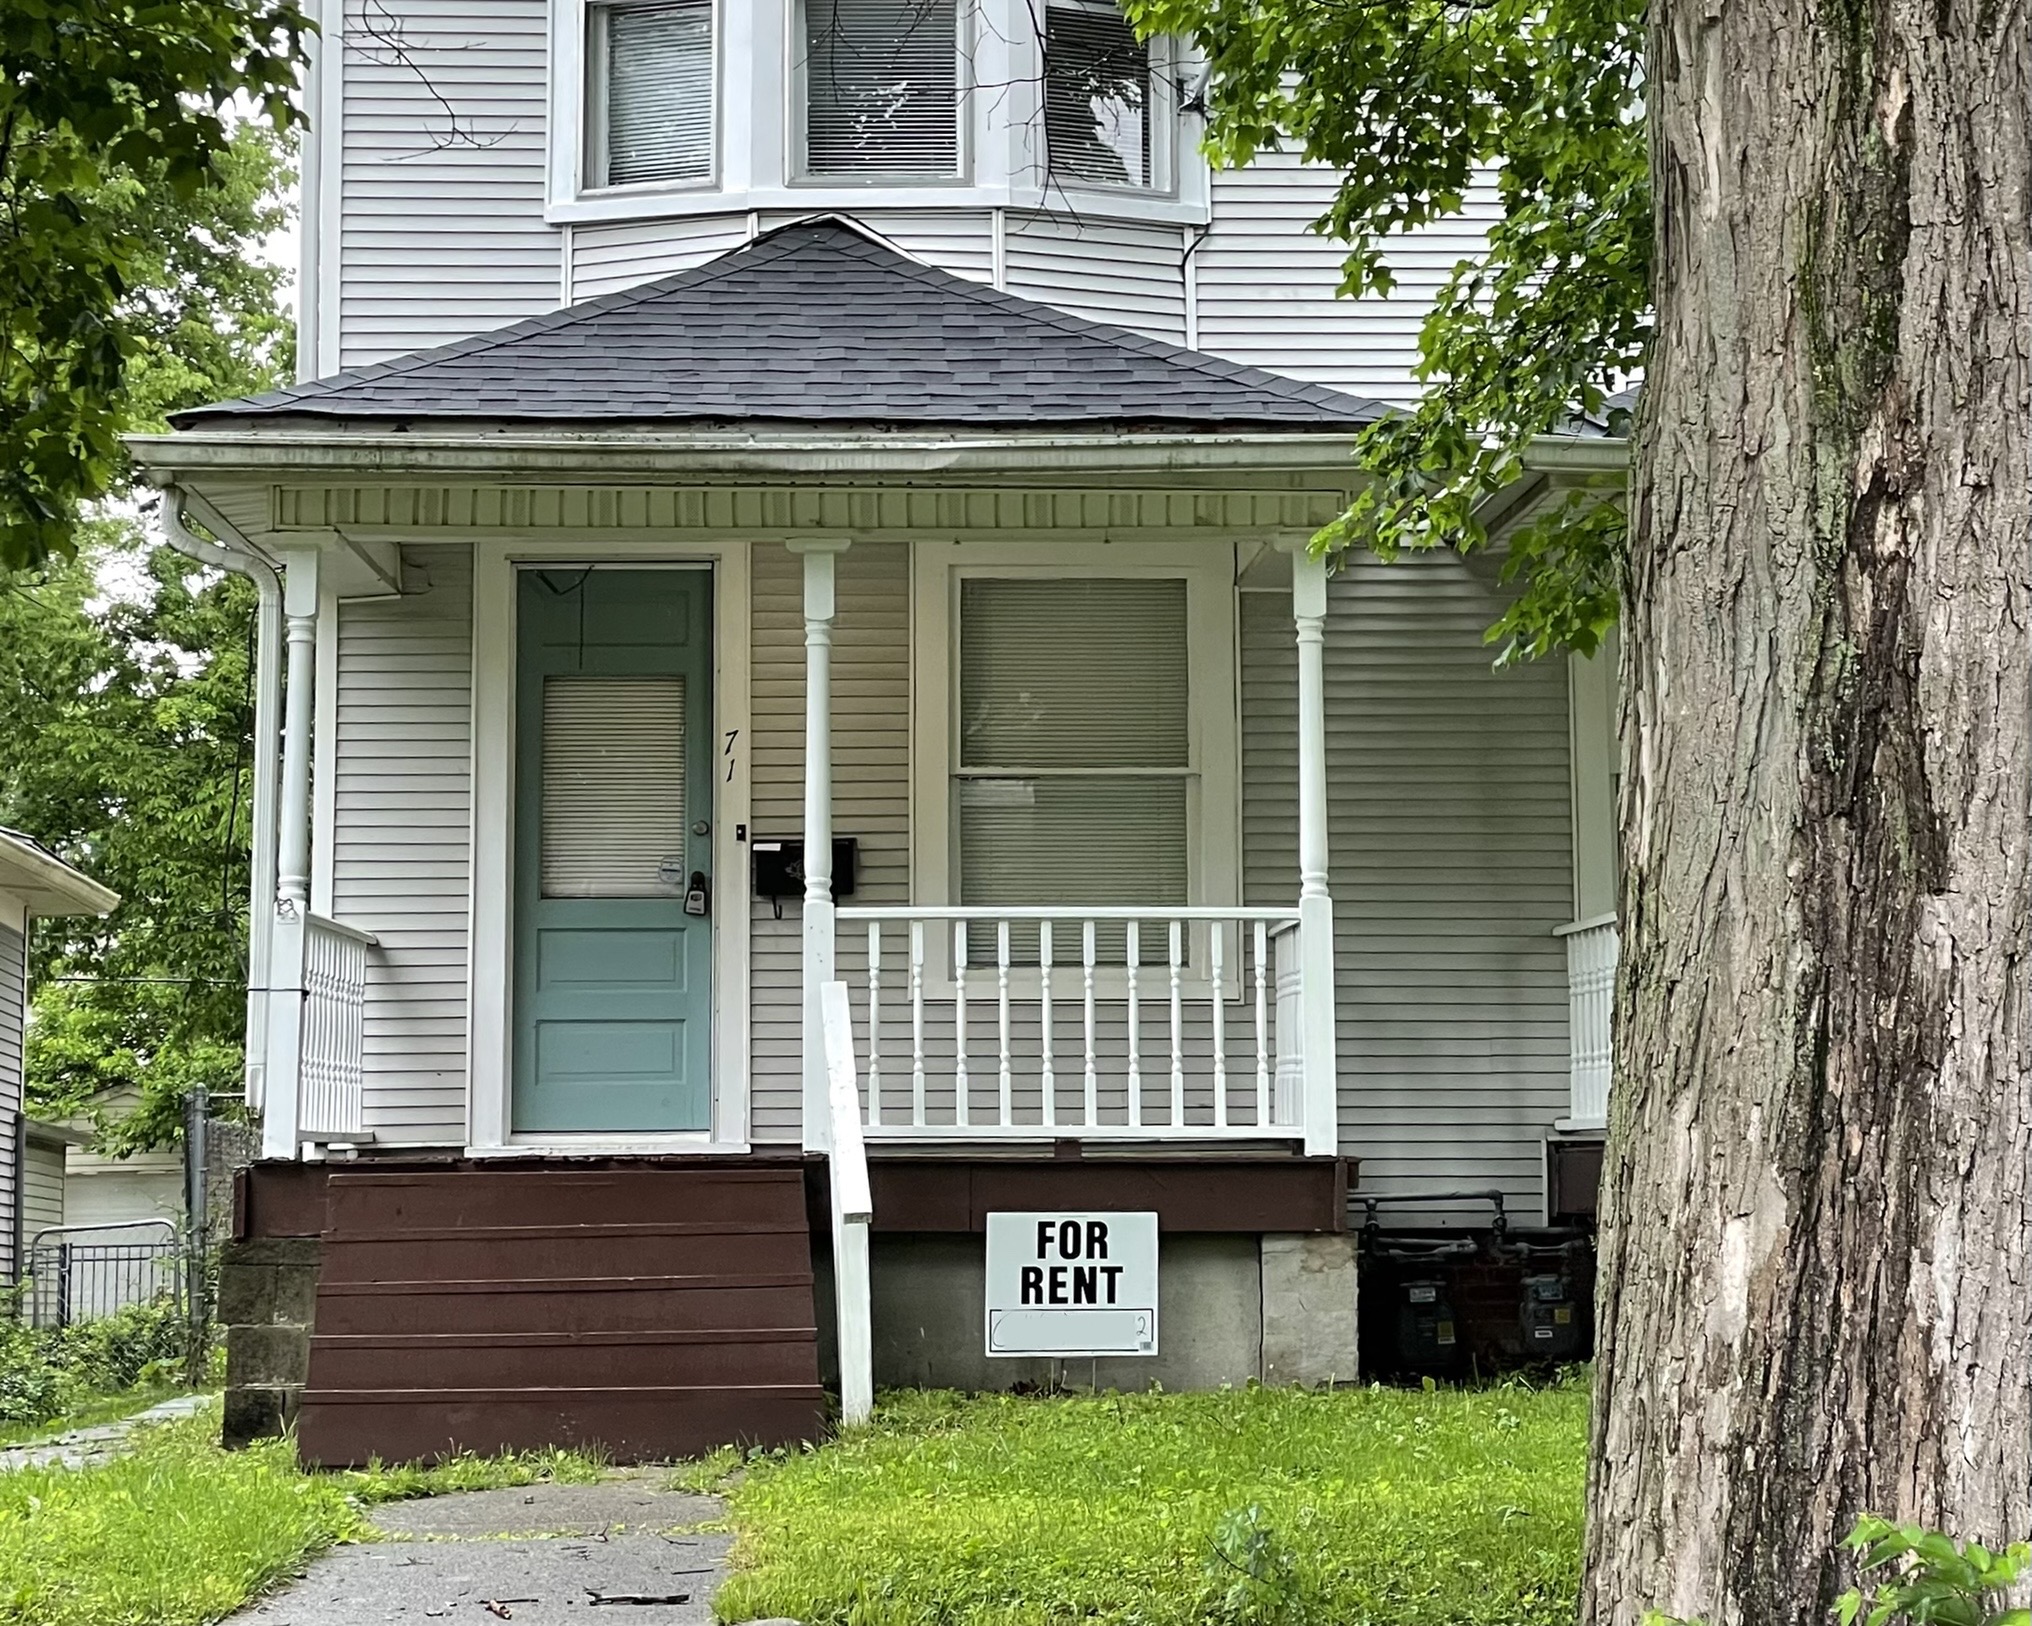
Indiana Senate Bill 230 would have required landlords to make necessary repairs to their properties. We examine the renters impacted by the bill’s failure.
 A Deep Dive into Affordable Rental Housing
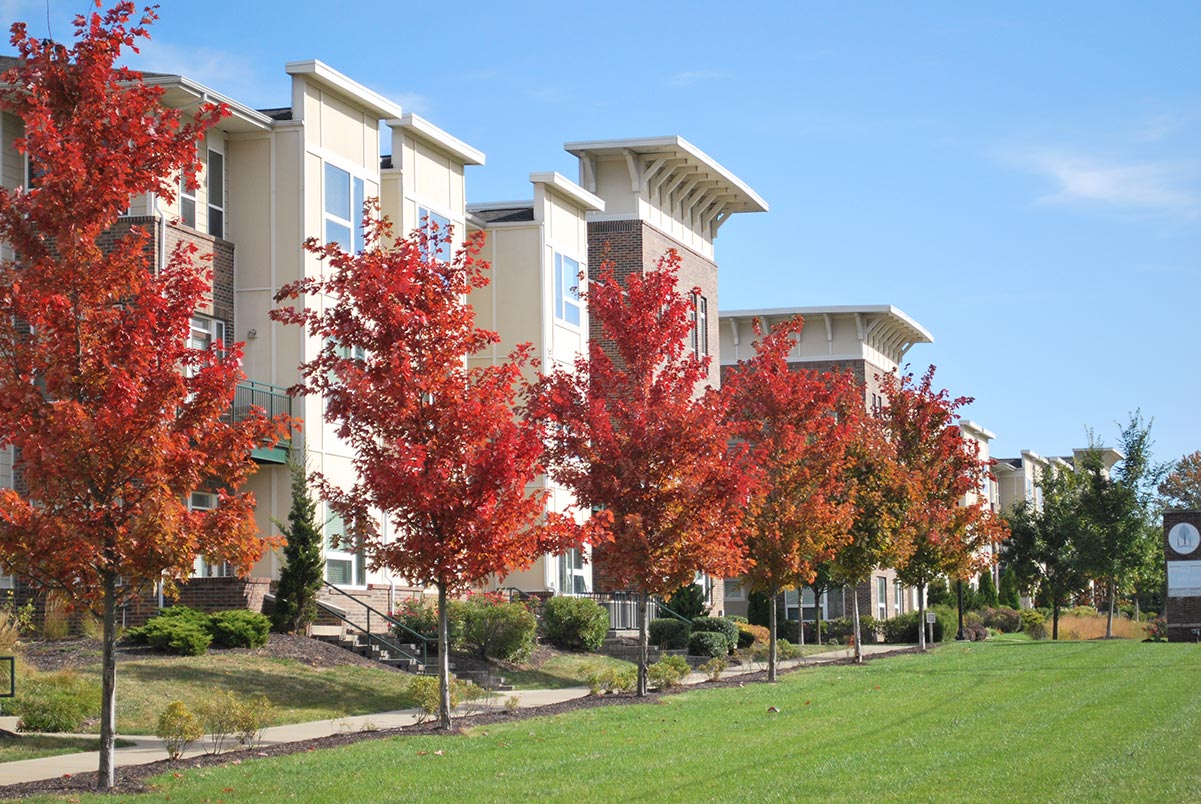
New data shows the number of subsidized rental homes in Marion County is stagnant, while the need for units affordable to extremely low-income households is large.
 After Public Investment, St. Clair Place’s Housing Market Significantly Stronger
Mortgage activity in St. Clair Place shows a dramatic increase in home purchases and home value since 2007. The area is more diverse than ever and poverty is falling for people of color. But home buyers are still 76 percent white.