SAVI just published the latest data release (2016) from the Home Mortgage Disclosure Act (HMDA). Banks report lending activity by census tract, recording information about the loan and the borrower. We are going to dig into this data to find areas where mortgage activity has increased quickly over the past five years. In future posts, we will use the same data to find other information, like what tracts have experienced the largest growth (by number of loans) and whether lending is segregated around the region (by examining the race of borrowers).
Pros and Cons of Analyzing Percent Change
In this article, we look at growth as a percentage of the number of mortgages originated in 2012. This allows high growth areas to be revealed, even if they have a small number of loans. With this method, less populous areas in the region can still show significant growth. This is also the downside of this indicator. It is difficult for tracts with more loan activity to achieve high growth rates, because they have a higher starting point.
Income in Mortgage Data
HDMA data contains information about borrowers income levels. Low-income borrowers earn less than 50 percent of the area median family income, moderate-income borrowers earn 50-79 percent, middle-income borrowers earn 80-119 percent, and upper-income borrowers earn 120 percent of the area median family income. In 2016, the Indianapolis region’s median family income was $66.7K.
We will look at growth in mortgage origination activity overall, and then break it down by income level.
New Home Purchase Mortgages
(Pct. Change, 2012-2016)
![]() Above Average Growth
Above Average Growth
Average Growth
Below Average Growth
Click ![]() to open a detailed legend and toggle layers.
to open a detailed legend and toggle layers.
Legends for each layer are based on the average growth rate. Pink tracts had an above average mortgage growth rate, and blue tracts, below average. A census tract with average mortgage growth is shown as white. The average growth was 50 percent for all borrowers, -10 percent for low-income borrowers, 39 percent for moderate-income borrowers, 60 percent for middle-income borrowers, and 78 percent for upper-income borrowers.
All Borrowers
The home-buying market had strong growth in the region over the past five yeras. In the 11-county metro area, there were 50 percent more home purchase mortgages originated in 2016 than in 2012. In 2012, 21,576 mortgages were originated for the purchase of a home. This grew to 32,428 in 2016. The growth in Marion County was 59 percent, from 7,600 mortgages in 2012 to 12,070 in 2016.. The county with the fastest growth in mortgages was Shelby County, which grew by 70 percent. However, Shelby County had small number of new mortgages—319 in 2012 and 543 in 2016. Hamilton County grew 34 percent, from 5,546 mortgages in 2012 to 7,451 in 2016.
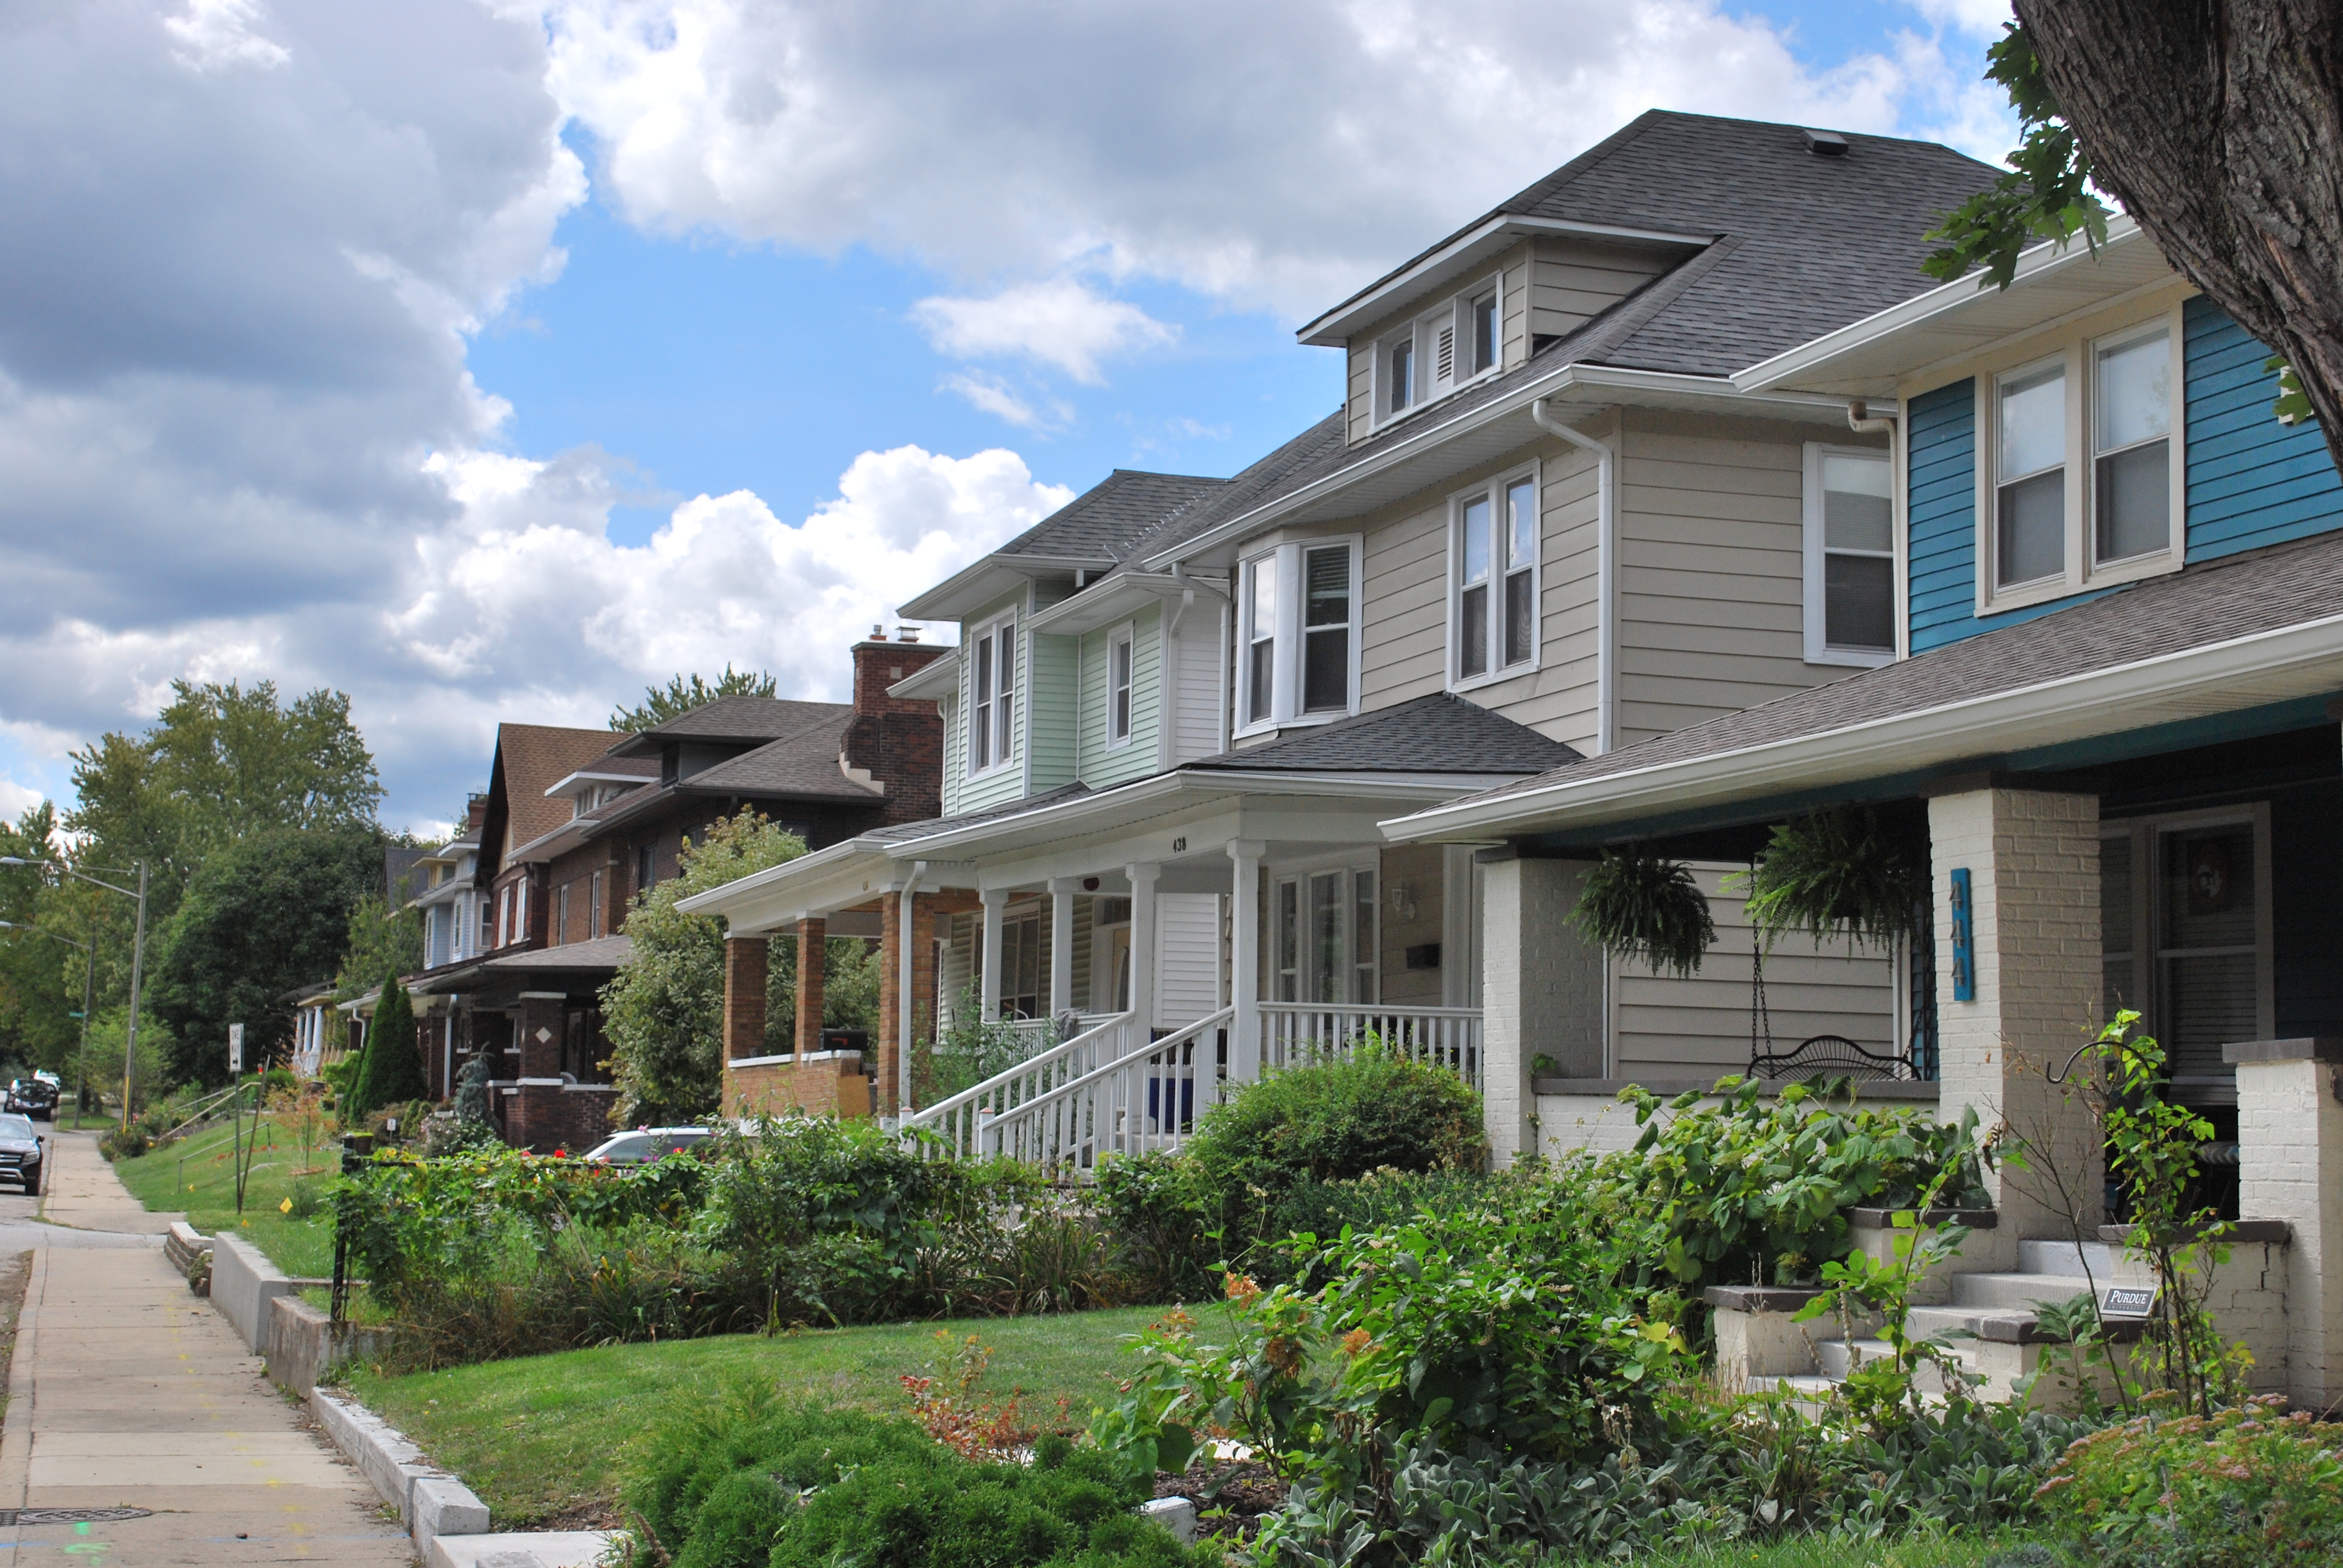
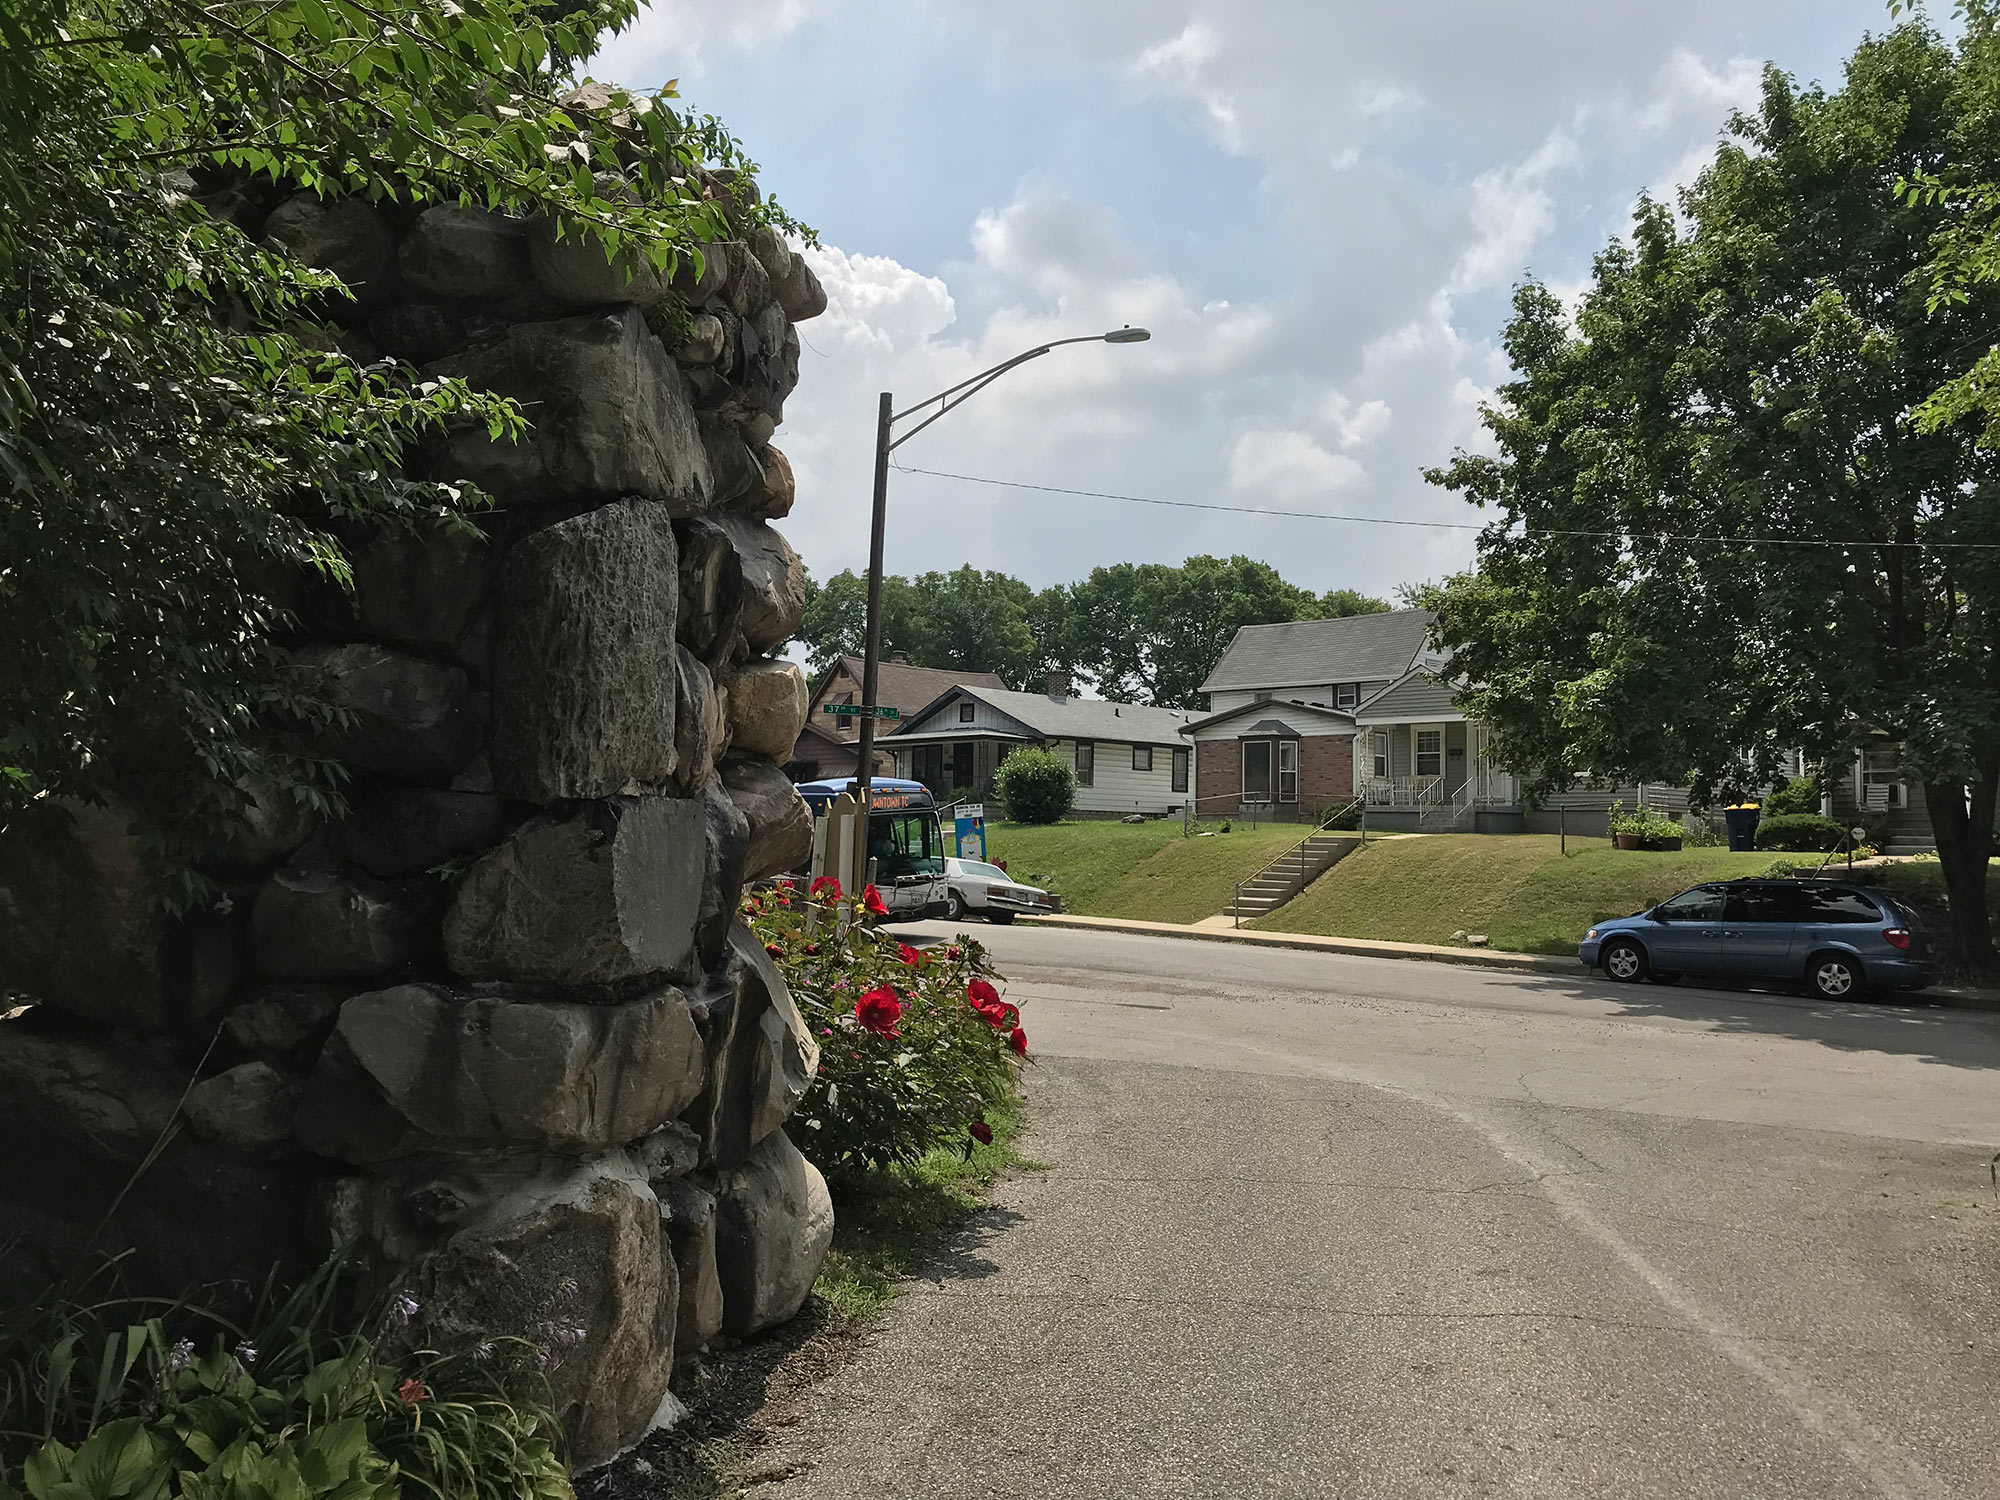
The tracts with the highest percent increase in mortgage activity are located in central Indianapolis, including in the Fountain Square area, the near southeast side, and areas along 38th street. Many of these areas increased mortgage activity by 300-900 percent. For example, the tract border by I-65, Prospect Street, and State Avenue grew from five home purchase mortgages in 2012 to 37 in 2016, and increase of 640 percent.
Outside of Marion County, the largest percentage change was seen in the outskirts of Anderson (near Edgewood and Chesterfield), the area south of Moorseville, and in Westfield.
Low-Income Borrowers
Borrowers earning less than half the median family income made up nine percent of new purchase loans in 2016. In Madison County, 19 percent of new loans were by low-income borrowers, while Hamilton County had the lowest rate, at only three percent.
Overall, the number of new loans by low-income borrowers in the region fell by 10 percent from 2012 to 2016. However, there were pockets of high growth in this segment. The map shows a lot of growth in mortgages from low-income borrowers around Anderson, Greenfield, and Mooresville, as well as some neighborhoods in Indianapolis.
Moderate-Income Borrowers
Moderate-income borrowers accounted for a quarter of new home purchase loans in 2016. This rate was highest in Madison County (35 percent) and lowest in Hamilton County (13 percent). Some of the fastest growing tracts are located in northern Madison County, Shelbyville, and across Indianapolis. Northwest Indianapolis, the area south along US-31, areas on the Eastside, and areas near Lawrence saw particular growth in new loans from moderate-income borrowers. In the region overall, growth in loans from moderate-income borrowers was 39 percent, slower than overall mortgage growth.
Middle-Income Borrowers
Middle-income borrowers made up a quarter of new purchase mortgages in 2016. This segment grew faster than mortgages overall, increasing by 60 percent from 2012 to 2016. The counties do not vary much in the share of mortgages by middle-income borrowers, ranging from 20-29 percent.
In Indianapolis, Decatur Township, the Southside, Fountain Square, and King Park are some areas experiencing rapid growth of mortgages by middle-income borrowers. Little Flower has seen an eight-fold increase in new loans by middle-income borrowers. Outside Indianapolis, there is rapid growth near Alexandria, Arcadia, Shelbyville, and Brooklyn.
Upper-Income Borrowers
Upper-income borrowers made up 43 percent of new purchase loans in 2016. However, 63 percent of new loans in Hamilton County were made to upper-income borrowers. The number of new loans to these borrowers increased 78 percent across the region since 2012.
Decatur Township, Southport, Speedway, and Lawrence contained some areas of rapid growth. There was also rapid upper-income growth in some urban core neighborhoods, such as Fountain Square, the area around Tarkington Park, Holy Cross, Cottage Home, and Spades Park.
In outlying counties, Westfield, Southwest Hendricks County, Brownsburg, and portions of Shelby and Hancock Counties saw rapid growth.
VAVADA – официальное казино для онлайн-игр, предлагающее широкий выбор азартных игр, бонусы и привлекательные выигрыши. Захватывающие слоты, блэкджек, покер и рулетка с щедрыми бонусами и акциями ждут вас!
Next Up
 Income Inequality High Where Golden Hill and Northwest Indianapolis Converge
In the area where wealthy Golden Hills converges with the working-class neighborhoods of Northwest Indianapolis, income inequality is high and increasing. The area is also experiencing a growth of white households above the median income.
 What We’re Reading: January 14, 2018
This week, Chicago Policy Review looks at a paper that finds Atlanta’s low-income households moved to where transit is available, NPR highlights the work of an Indianapolis CDC, and Brookings provides an economic development dashboard.
 Fall 2016 Financial Stability Edition
This magazine’s feature story, “A Better Foundation: Building Economic Prosperity with Truly Affordable Housing,” highlights a central theme of the report, The Affordable Housing Market and Why It Matters: that affordable housing encompasses a broader range of economic issues than the price of a home. In addition, we share stories from area nonprofits that used SAVI data to help obtain funding for job training programs, and feature a new web tool, the community assessment and planning tool which allows users to develop custom and updatable research reports.
 SAVI Planning Powers Northside Mission Ministry’s Impact