This is where SAVI analysts regularly share the stories and studies that have caught our eye. These are the latest ideas in socioeconomic, policy, and data viz trends.
Chicago Policy Review: How Public Bus Routes Can Deconcentrate Poverty and Promote Equity
Read it here.
Author: Andrew Miller
“In a paper titled “Public transit access and the changing spatial distribution of poverty,” Pathak, Wyczalkowski and Huang analyze the link between public bus routes and the geography of poverty in the Atlanta metropolitan area. Using tract-level U.S. census data from 1970 to 2010, the authors found that the presence of a public bus route in Atlanta’s suburban census tracts is associated with a 2.32 percent increase in the poverty rate on average, compared to census tracts without bus routes. Public bus routes attract low-income residents because they offer an affordable means of transportation.”
NPR: Subsidized Housing May Help School Districts Retain Teachers
Read it here.
Author: Jenie Lindsay
This NPR story highlights the work of Near Eastside Area Renewal and the development of their Teacher’s Village. Lindsay says, “Indianapolis Public Schools lose about 400 teachers each year. In an attempt to stem that, a new housing project in the city is targeting teachers.”
Brookings: Metro Monitor 2017 Dashboard
Use the dashboard here.
Read the report here.
Authors: Richard Shearer, Alec Friedhoff, Isha Shah, Alan Berube
The dashboard “tracks the economic performance of the nation’s 100 largest metropolitan areas along three dimensions: growth, prosperity, and inclusion. These represent the pillars of successful economic development which should encourage robust long-run growth (growth) by improving the productivity of individuals and firms in order to raise local standards of living (prosperity) for all people (inclusion).”
Here’s a glimpse at the 2010-2015 numbers. Out of the top 100 metro areas, Indy ranks 45th in growth, 79th in prosperity, and 79th in inclusion. We’re above average in job growth, but a lagging median wage and climbing relative poverty is what puts us near the bottom in the inclusion measure.
Compare this to nearby metros Columbus, Ohio (16th in growth, 18th in prosperity, and 31st in inclusion) and Louisville (34th in growth, 23rd in prosperity, and 78th in inclusion).
Next Up
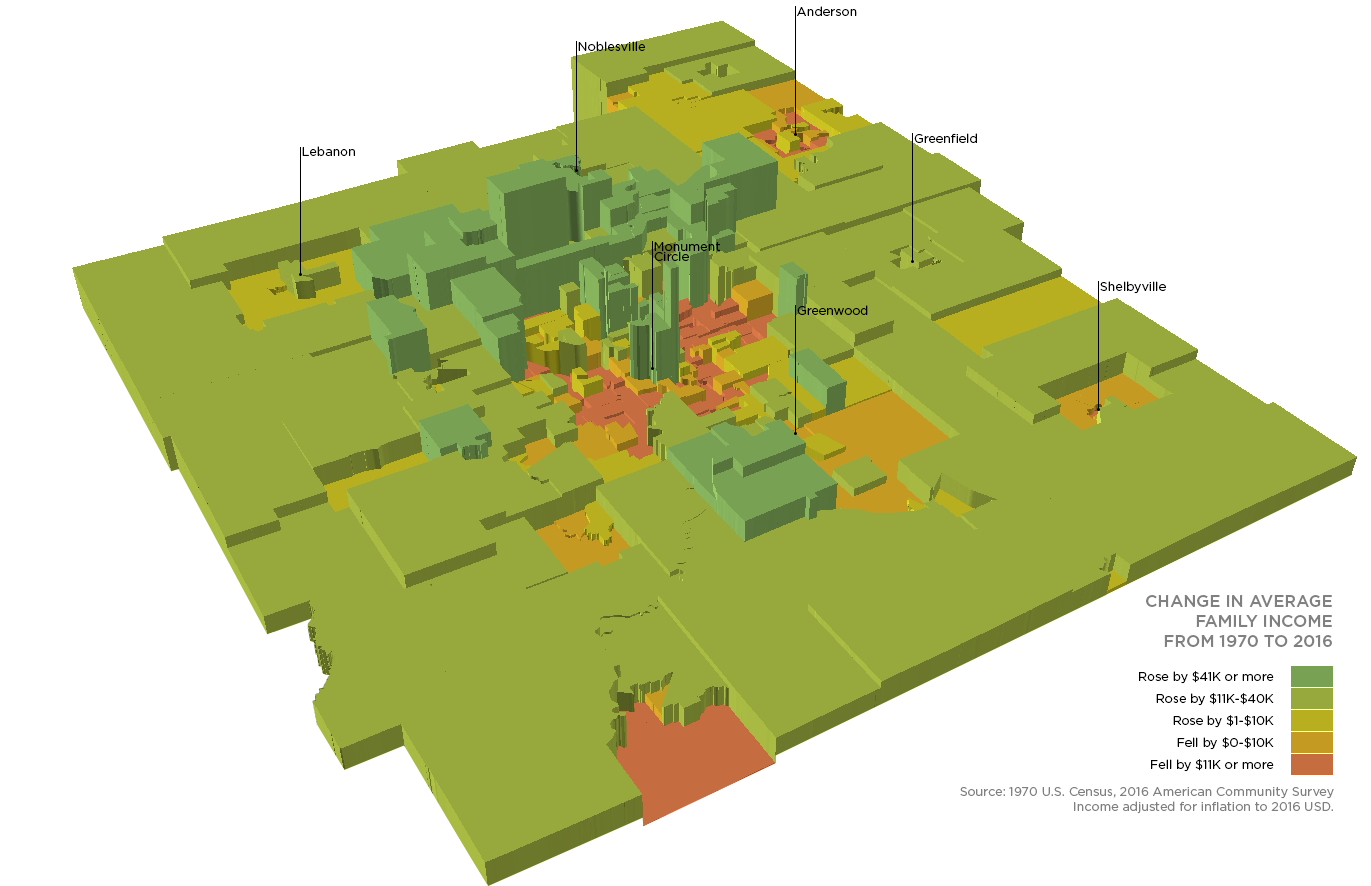 The Growing Divide Between Rich and Poor Neighborhoods
In 1970, there was a $22.6k gap between average family income in high- and low-income (80th and 20th percentile) neighborhoods. By 2016, the gap had doubled to $53.5k. Incomes grew for wealthy and middle-income neighborhoods, but fell for low-income neighborhoods.
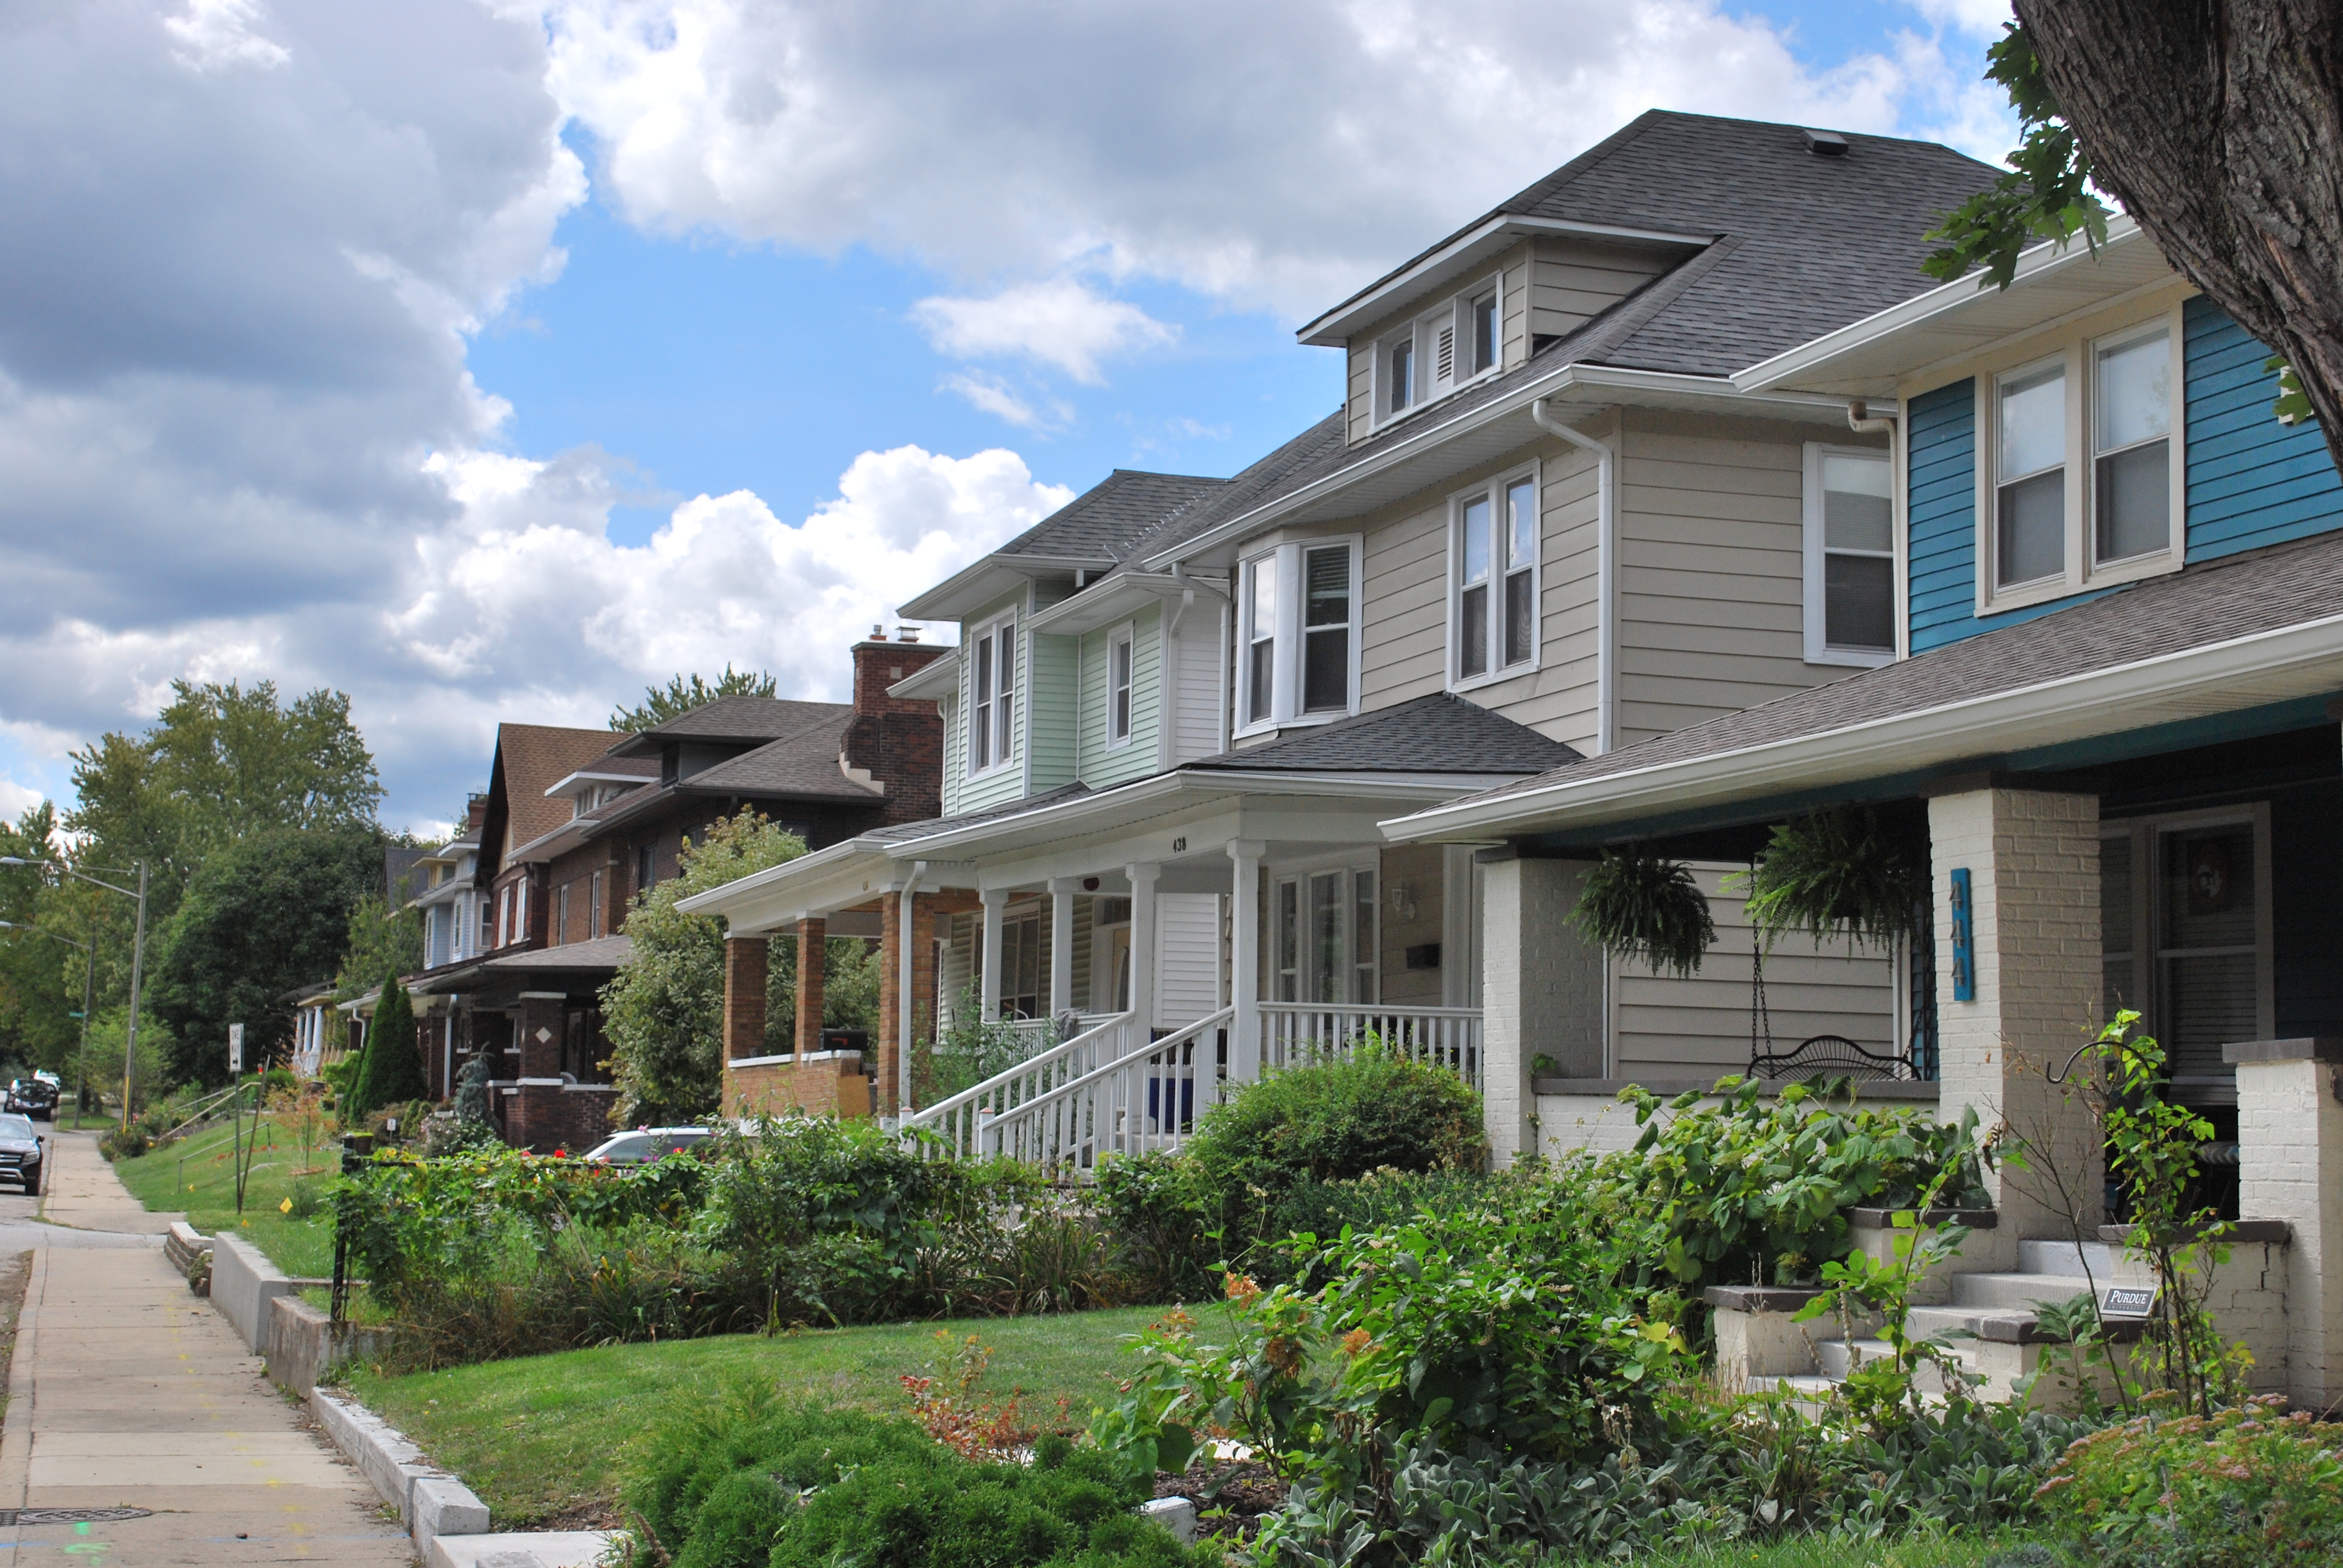
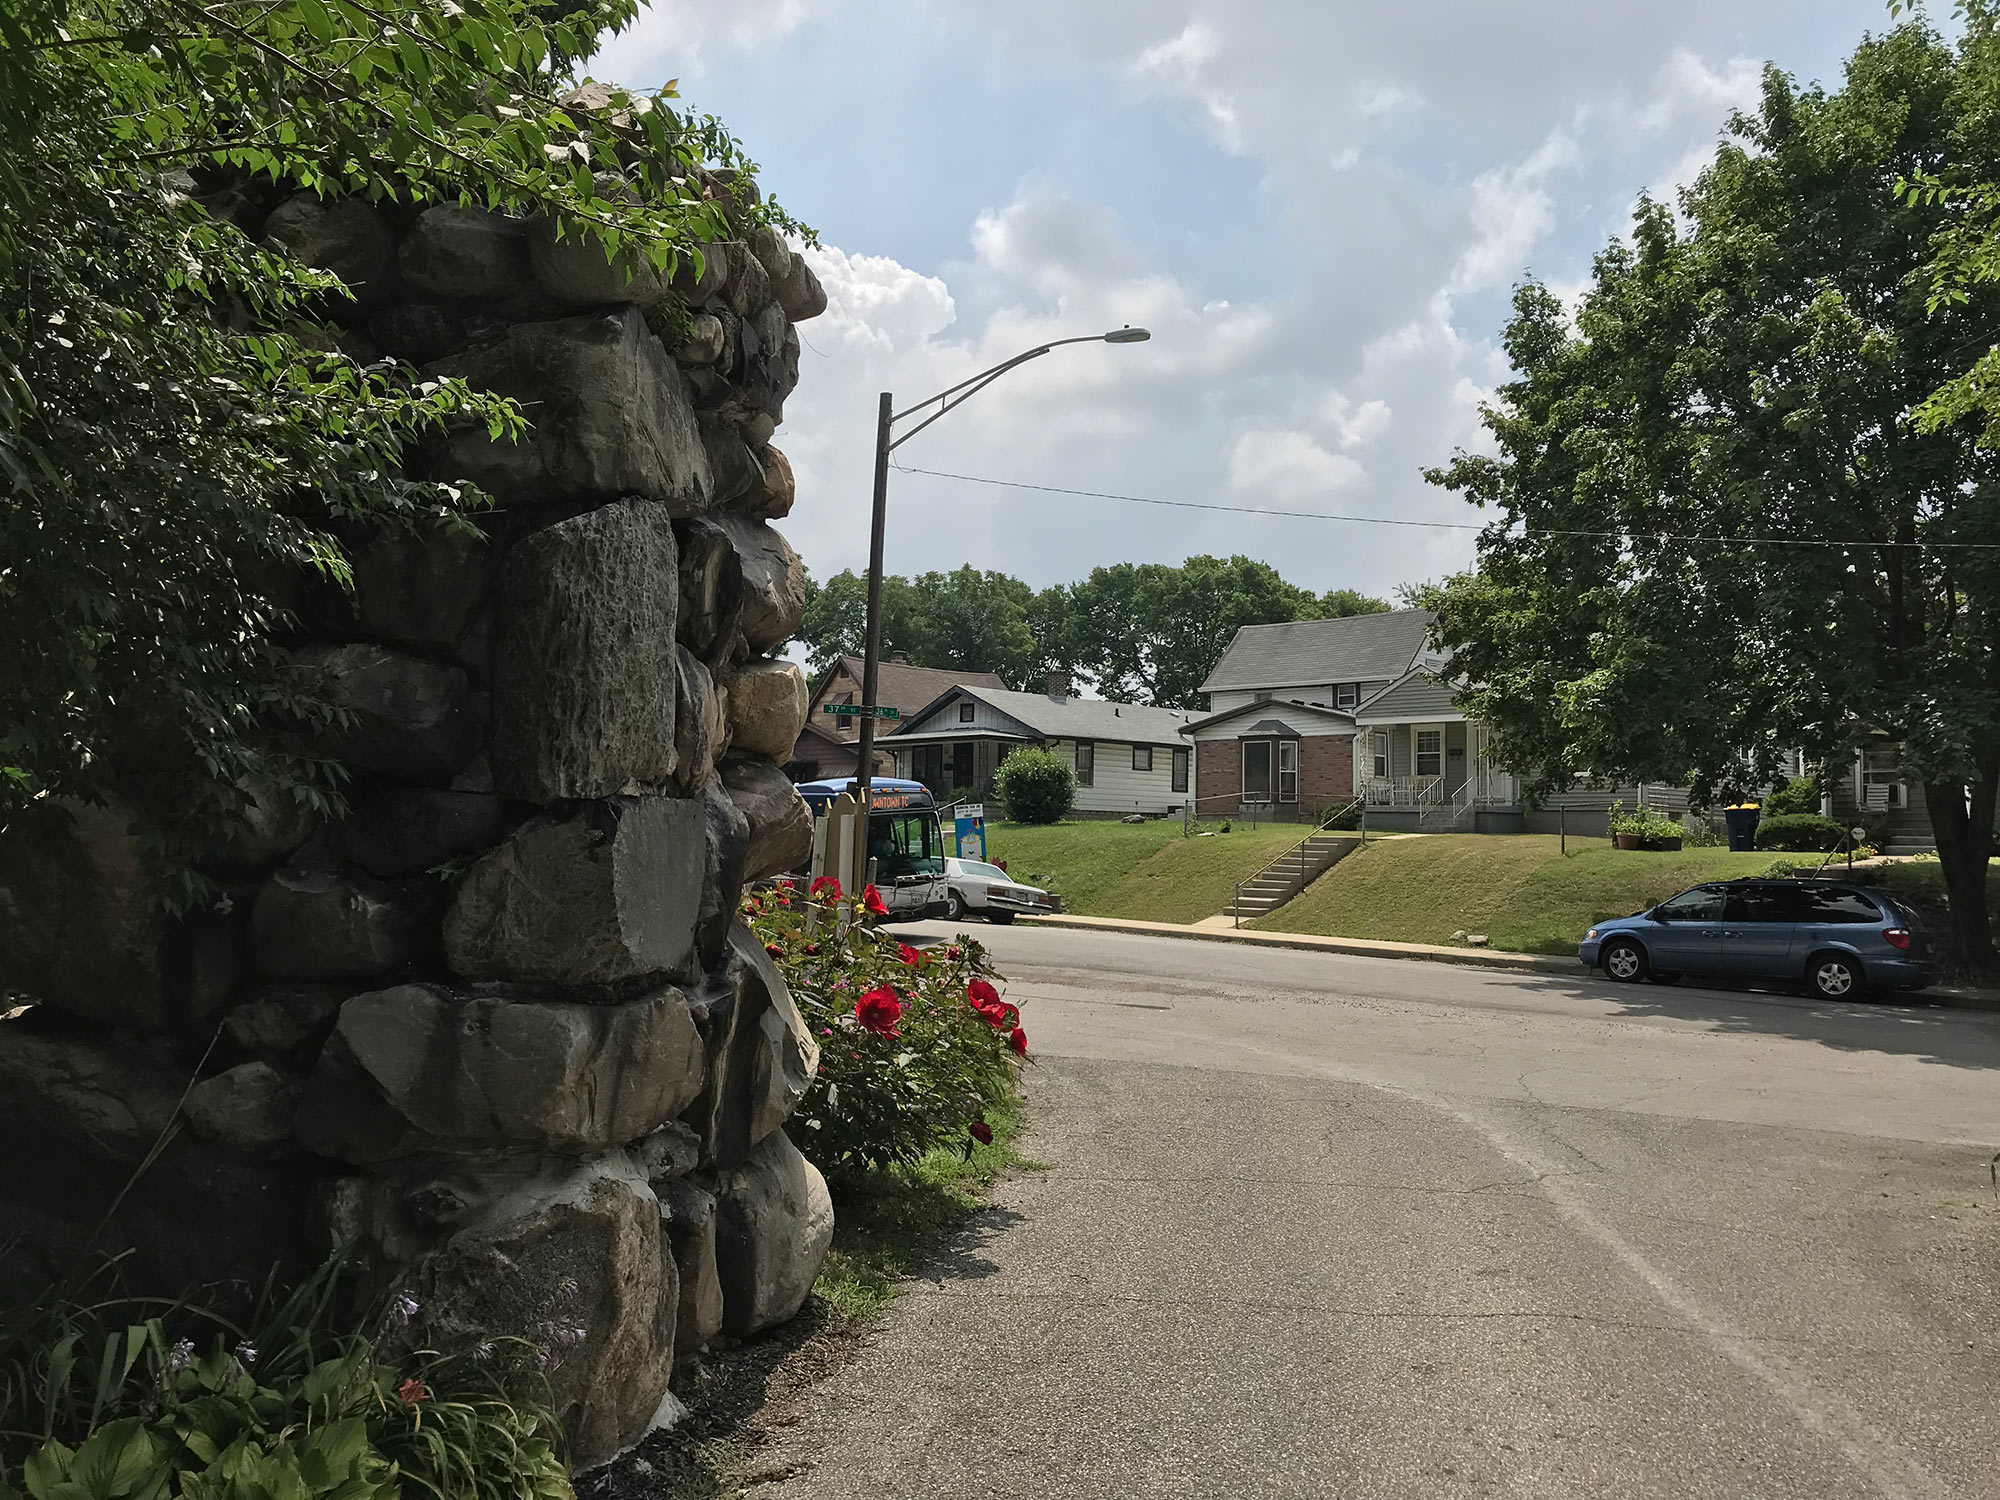 Income Inequality High Where Golden Hill and Northwest Indianapolis Converge
In the area where wealthy Golden Hills converges with the working-class neighborhoods of Northwest Indianapolis, income inequality is high and increasing. The area is also experiencing a growth of white households above the median income.
 What We’re Reading: February 21, 2018
This week, Health Affairs reports on high child mortality in the US, NPR dives into the contract workforce, and NASA offers a very cool population estimator.
 Mortgage Activity Growing Fastest Among Middle- and Upper-Income Borrowers
There were 50 percent more Central Indiana home purchase loans in 2016 compared to 2012. Among upper-income borrowers, the number of new loans went up 80 percent.