Indianapolis adopted a new zoning ordinance called Indy Rezone, effective May 2016. A zoning ordinance generally consists of list of regulations defining what property owners are permitted to build in each zone, accompanied of a map defining where particular zones are located. For example, the ordinance may stipulate how tall buildings can be, what uses are allowed, or minimum or maximum number of parking spaces.
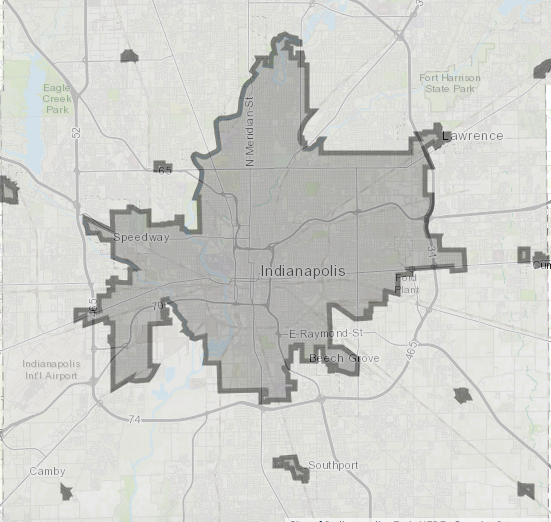
One of the new features of this ordinance was the establishment of “Context Areas” (see Article V of the ordinance). The portion of Marion County generally developed before 1945 is called the Compact Context area, and the area developed after 1945 is the Metro Context area. This designation allows the ordinance to define different development standards based on the context of the property. The zoning ordinance lays out the goal of the context areas.
“In order to tailor development standards to promote compatible development and redevelopment in these two types of areas, the Zoning Ordinance sometimes includes different development standards for the following two types of context areas.”
While the zoning ordinance influences future development in these context areas, we wanted to use SAVI data to study current development patterns. Below, we examine assessed value, population and housing density, and building and demolition permits, comparing the Compact Context area to the Metro Context area. (Any time “Metro” is mentioned in this article, it refers to the Metro Context area in Marion County, not to the larger Indianapolis metropolitan area.)
The boundaries of the context areas do not exactly align with census boundaries (which are used to collect and aggregate data), so we used census block groups that approximate the context areas. The following data is based on those block groups.
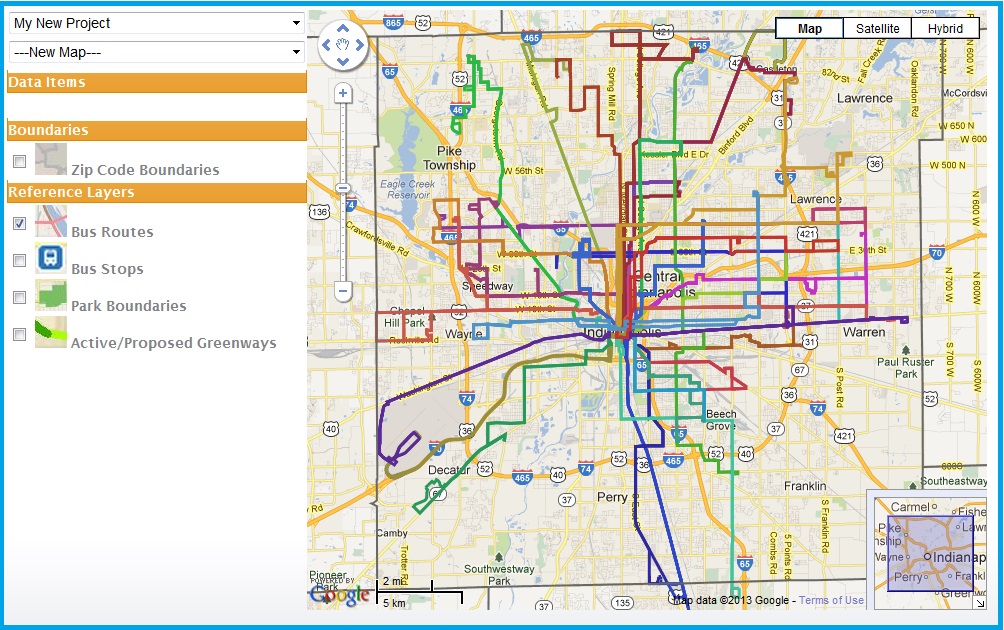
Explore all the data used in this analysis in the map below. Open the legend to see more map layers.
Assessed Value, Population, and Housing Units
The Metro Context area accounts for most of the population, housing and assessed value, but the Compact area has an outsize share of all three, due to its density.
The Compact Context area consists of 86 square miles, or 21 percent of Marion County’s total land area. However, it accounts for an outsize portion of Marion County’s assessed value, population, and housing units. The total assessed value of all parcels in Marion County (in 2016) was $52.9 billion. Of that, 27 percent ($14.1 billion) of this value is located in the Compact Context area. On average, the assessed value of property (including buildings) in the Compact area is $255,000 per acre, compared to $192,000 per acre in the Metro Context area. This is called land value density, and higher land value density can allow local governments to collect more tax revenue per acre. This makes it more efficient for local governments to fund and provide services to the public.
On average, the assessed value of property in the Compact area is $255,000 per acre, compared to $192,000 per acre in the Metro Context area.
The Compact Area is higher density than then Metro Area, as expected. Of the 926,000 residents of Marion County, about 289,000 (31 percent) live in the Compact Context area. This is 3,350 people per square mile, compared to about 2,000 people per square mile in the Metro Context area. There are 1,680 housing units per square mile in the Compact area and 865 per square mile in the Metro Context area.
Building and Demolition Permits
The Compact and Metro areas each account for about half of the 6,000 permits issued in 2015. Permits for multi-family developments tended to be issued in the Metro area.
The Compact and Metro areas each had about the same number of new building permits in 2015, but the Compact area had a much higher density of building permits. In 2015, there were about 6,000 commercial and residential building permits issued. The location of these permits reveals how growth differs between the Metro and Compact Context areas. The Compact area accounts for almost half of building permits issued (about 2,740 permits), even though it is only 21 percent of Marion County’s area.
Interestingly, multi-family construction accounted for a higher share of building permits in the Metro Context area than in the Compact Context area. In the Metro Context area, eight percent of building permits are for multi-family buildings (with at least three units). Multi-family permits account for only four percent of Compact area building permits. The map reveals that many multi-family permits are built near I-465 and Binford Boulevard on the north side and near I-465 and I-65 on the south side. The number of permits does not necessarily indicate the number of units, however. A single multi-family permit could represent a small building with three dwelling units or a large tower with 200 units.
Seventy percent of the nearly 550 demolition permits issued in 2015 were within the Compact area. In fact, the density of demolition permits is more than eight times higher in the Compact area than in the Metro area. This is expected, since the Compact area is older and fully developed. Development in this area will often involve the demolition of existing buildings.
Next Up
 As Gentrification Bill Considered, Values Increasing Quickly in These Neighborhoods
 IndyVitals!
IndyVitals, a new digital neighborhood monitoring tool for Marion County that is powered by SAVI, debuted June 7 to mark the City of Indianapolis’ official community-wide unveiling of its Bicentennial Plan. The […]
 Indy’s Mass Transit Bill: Debated with Data
Last week, the Tax and Fiscal Policy Committee voted to delay House Bill 1011, which would allow voters in Hamilton and Marion counties to determine whether or not they want to increase taxes […]
 Community Development Corporations
Community Development Corporations are nonprofit organizations that promote community development such as creation of affordable housing, workforce training, and community organizing and planning. This map shows the service areas of […]