Police have used force on 13 out of every 1,000 black residents since 2015, compared to only 5 out of every 1,000 white residents. Police use force on black residents at over 2.5 times the rate of white residents. Police use force more often in neighborhoods with high crime rates. However, use of force is also associated with neighborhoods that have higher poverty rates, lower educational attainment, and more young black men, even when controlling for the crime rate.
Reported incidents where IMPD used force have nearly doubled in recent years. The department reported 1,687 incidents in 2019 and 873 in 2015. This trend may be the result of increased use of force by IMPD officers, or it may be signal that the reporting of use of force incidents has become more routine.
Reported use of force doubled since 2015
Number of IMPD incidents involving use of force
Police use force on black residents at a higher rate than white residents
Even though black residents make up 28 percent of the population, 51 percent of the people on whom officers used force were black. The police have used force on over 3,400 black residents since 2015. That means that police have used force on one out of every one hundred black residents in Indianapolis. For white residents, police have used force on one in two hundred.
Police mostly used force on black residents even while most residents are white
Race of people on whom police used force compared to race of Marion County population.
The police have used force on 13 out of every 1,000 black residents since 2015
People on whom police used force per 1,000 residents
Police force is less diverse than population, but officers of all races use force at the same rate
Forty-seven percent of sworn officers used force in 2018, and the racial breakdown of those officers roughly matched that of the police force overall. As of 2018, 81 percent of sworn officers were white, and 79 percent of officers who used force were white. Black officers made up 15 percent of sworn officers and 14 percent of officers who used force, while Latino officers made 3 percent of sworn officers and 4 percent of those who used force.
Sworn officers are less diverse than the overall population. Only 56 percent of Marion County residents are white. Twenty-eight percent are black, and 10 percent are Latino.
Officers using force have same demographics as IMPD, but are much less diverse than overall population
Race of sworn officers, officers involved in use of force incident between 2015 and 2020, and Marion County population
Does the degree of force used vary by race?
The “continuum of force” concept is a useful way to understand the relative severity of different types of force. Continuum of force principles are a part of many police departments’ policies, and IMPD is adding this component to their own use of force policy. We used Charlotte’s use of force policy as a basis for classifying incidents into different categories, because IMPD’s own continuum of force guideline is not public yet.
This table shows the continuum of force model used in our analysis. IMPD’s data only reports when an officer uses a level of force of empty hand control or greater. Police presence and verbal commands are not reported.
When officers use force on a person, they tend to use a similar level of force regardless of race. However, police officers use force more frequently on black individuals. Therefore, officers use more total force on black individuals.
The chart below shows the maximum level of for used in each incident. For example, handcuffing (empty hand control) is very common. It is used in over a quarter of incidents. However, most of these incidents also involve a higher level of force and are therefore categorized as something other than empty hand control.
When using force, police usually use hard empty hand control, like kicks and strikes, in an incident. More than half of incidents involved this level of force. Officers also use intermediate weapons frequently. About one third of incidents involved tasers, dog bites, or batons and other weapons
Though police use force more frequently on black residents, they use similar levels of force across race and ethnicity
Percent of people by maximum level of force police used
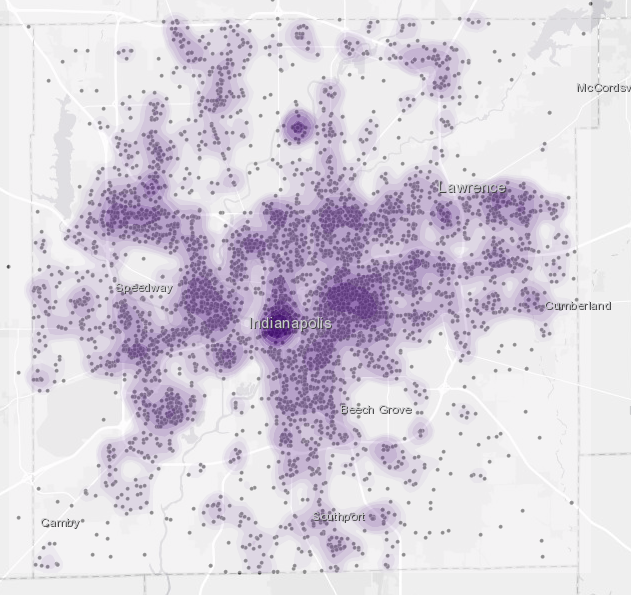
Where do police use force most often?
The map below shows every location where a police officer used force since 2015. The densest clusters are located downtown and on the Near Eastside, where police have used force at a rate of over 150 times per square mile in many areas. Other clusters exist in Near West, Lafayette Square, Broad Ripple, and south of Lawrence, where police used force at rates of 80-100 times per square mile.
This data only includes IMPD incidents, not incidents from excluded cities like Southport, Lawrence, and Beech Grove. The lack of incidents in these areas are because they are not reported in this data set.
To see patterns in individual neighborhood, we map these incidents by census tract. Click on a tract in the map below to see the rate at which police have used force since 2015.
The rate at which police use force in a neighborhood is largely driven by the crime rate, but demographics also play a role. Lower educational attainment, a higher poverty rate, and more young black men in a neighborhood all relate to increases in the rate at which police use force.
The chart below shows the estimated effect that each of these variables has on use of force. This shows the effect of a neighborhood changing from average to above average in each measure while controlling for the other measures. (Tap or click the chart to enlarge it.)

Police use force more often in areas with higher reported crime rates, lower educational attainment, high poverty rates, and more young black men
Police use of force incidents by census tract
On average, IMPD officers use force on black residents at 2.6 times the rate for white residents (1.3 percent of black residents compared to 0.5 percent of white residents). However, this difference is higher in some neighborhoods than in others. The map below shows this discrepancy.
We have calculated, in each census tract, the number of black and white individuals on which police used force per 1,000 black or white residents. We then compared these two rates as a ratio. A ratio of 1.0 means police use force on black and white individuals at an equal rate compared to the population in the neighborhood. This calculation is only reliable when there are enough use of force incidents. Therefore, we have mapped tract with at least 15 use of force incidents since 2015.
Data sources and notes
The data set we used is publicly available from the City of Indy’s data portal. This data is current through June 30, 2020. (Note that they list the wrong update date on the data portal.)
Demographic data is from the 2014-2018 American Community Survey five year average via SAVI Community Information System.
Our analysis of the relationship between reported crime, demographics, and use of force incidents is based on a linear regression model.
Dependent variable: Log of use of force incidents per capita
Independent variables:
Log of reported crimes per 1,000 residents ***
Poverty rate *
Share of adults age 25+ without a high school diploma ***
Black men age 15-24 as a share of the population **
Coefficients are statistically significant at the following confidence levels:
* = 95%, ** = 99%, *** = 99.9%
These independent variables explained 88 percent of the variance in the use of force incidents (adjusted R-squared = 0.878).
Next Up
 Follow the Money: Indianapolis Evictions in 2022
Eviction filings are on the rise compared to last year, but still lower than before the pandemic. Most evictions are from large owners of big apartment complexes.
 The State of Tenants in Central Indiana
Indiana Senate Bill 230 would have required landlords to make necessary repairs to their properties. We examine the renters impacted by the bill’s failure.
 Modern Redlining in Indianapolis?
Our analysis of one million loan applications since 2007 shows that, even when income and debt are the same, having a Black applicant on the loan increases the odds of being denied by 2-3X, and applying for a loan in a historically redlined neighborhood increases the odds of denial by 50 percent.
 A Deep Dive into Affordable Rental Housing
New data shows the number of subsidized rental homes in Marion County is stagnant, while the need for units affordable to extremely low-income households is large.