Using individual records from census data and IRS data, the Opportunity Atlas maps outcomes of adults by the neighborhood in which they grew up and the race, gender, and income of their parents. This research was led by Harvard’s Raj Chetty and the U.S. Census Bureau. (See the full methodology here.) The outcomes studied include household income, incarceration rate, and resident retention (the percent of children who stay in the metro in which they grew up), among many more.
We will look at local patterns in Indianapolis to learn how our region compares to the country and how our neighborhoods compare to each other. While there are 24 outcomes mapped in the atlas, we will focus on household income and resident retention.
The dataset is describing economic mobility as it existed in a neighborhood in the late 1970s and early 1980s, not necessarily how it exists now.
This is a longitudinal study, meaning data is collected about the same people over a long period of time (in this case collected by the IRS and the U.S. Census Bureau). The “children” in this study were born between 1978 and 1983. Their outcomes were measured in 2014 and 2015, when they were in their 30s. For this reason, the dataset is describing economic mobility as it existed in a neighborhood in the late 1970s and early 1980s, not necessarily how it exists now. In the 1970s and 1980s, the regional distribution of economic disparities was similar to today. Urban areas were largely worse-off after suburbanization drained population from the urban core. The north side of the region was the most affluent. But some specific neighborhoods are very different now than they were thirty years ago, and the outcomes of children born there could be very different as well.
We will compare the findings in the Opportunity Atlas in the context of our neighborhood change study to consider if particular neighborhoods may be likely to have different outcomes today. Of course, we cannot know the outcomes of children born in our neighborhoods today until they reach adulthood.
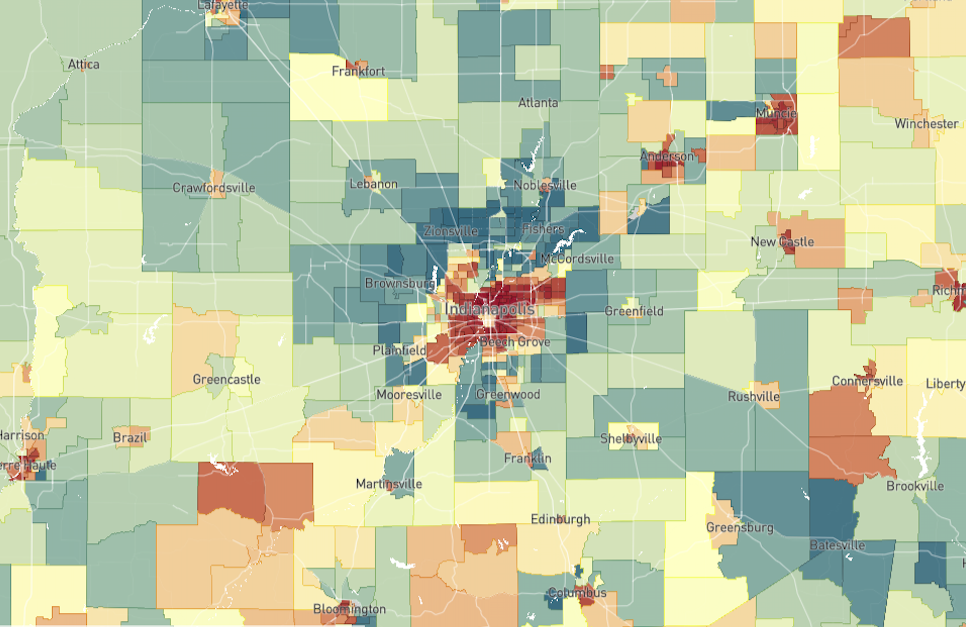
Household Income
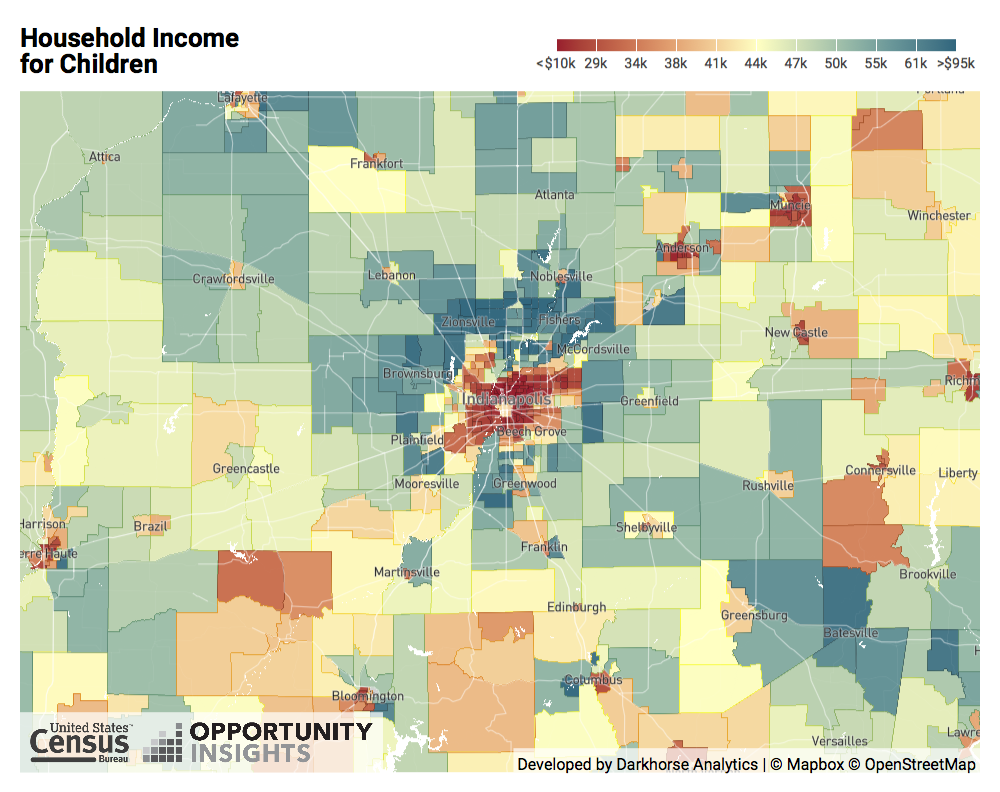
Children who were born in Indianapolis’ urban core tend to have lower household incomes when they are grown than children in other parts of the region. Nationally, the median child born in 1978-1983 grew up to earn about $44,000 in household income. The Indianapolis metro is similar, at $43,000.
Children who grew up in the Old Northside, however, have an average household income of $28,000-$29,000. Household income for children born in Fountain Square is $22,000. In contrast, children who grew up in William’s Creek or Meridian Hills have an average household income of $70,000. Downtown is an exception to this trend. Children who grew up downtown tend to earn just below the median, with average household income of $39,000-$41,000.
This pattern plays out in every city and town center across the region. Children from core neighborhoods in Noblesville, Shelbyville, Franklin, and Lebanon on average have lower household incomes than children from surrounding areas.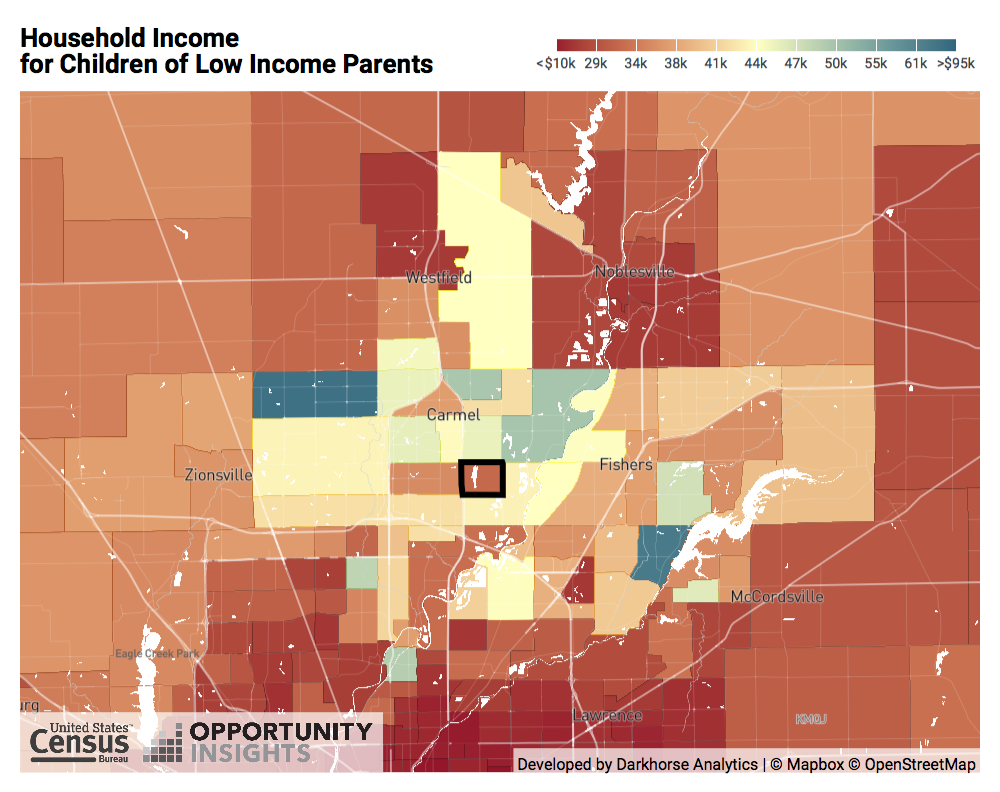
On the north side of the region, in parts of northern Marion County, Zionsville, Carmel, and Fishers, children of low-income parents (25th percentile in terms of income) tended to approach the middle class in adulthood. In many tracts, children of low-income parents grew to have average household incomes of $40,000-$45,000.
The opposite is also true. In some places, even children born to high income parents are likely to become low-income. For example, the average household income for children born to high-income parents in St. Clair Place is $25,000. In Fall Creek Place, it is $35,000.
The picture may be very different in these neighborhoods now, especially Fall Creek Place. In 1980, Fall Creek Place had just shed 47 percent of its population in ten years. The neighborhood was low-income, 88 percent people of color, and had low rates of educational attainment. (Four percent had a bachelor’s degree.)
In some places, even children born to high income parents are likely to become low-income. For example, the average household income for children born to high-income parents in St. Clair Place is $25,000.
Now the average family earns $115,000 per year, six in ten residents are white, and half the neighborhood has a bachelor’s degree. Children born now in this neighborhood may experience different outcomes than earlier generations, because they are likely to be born into a very different socio-economic class.
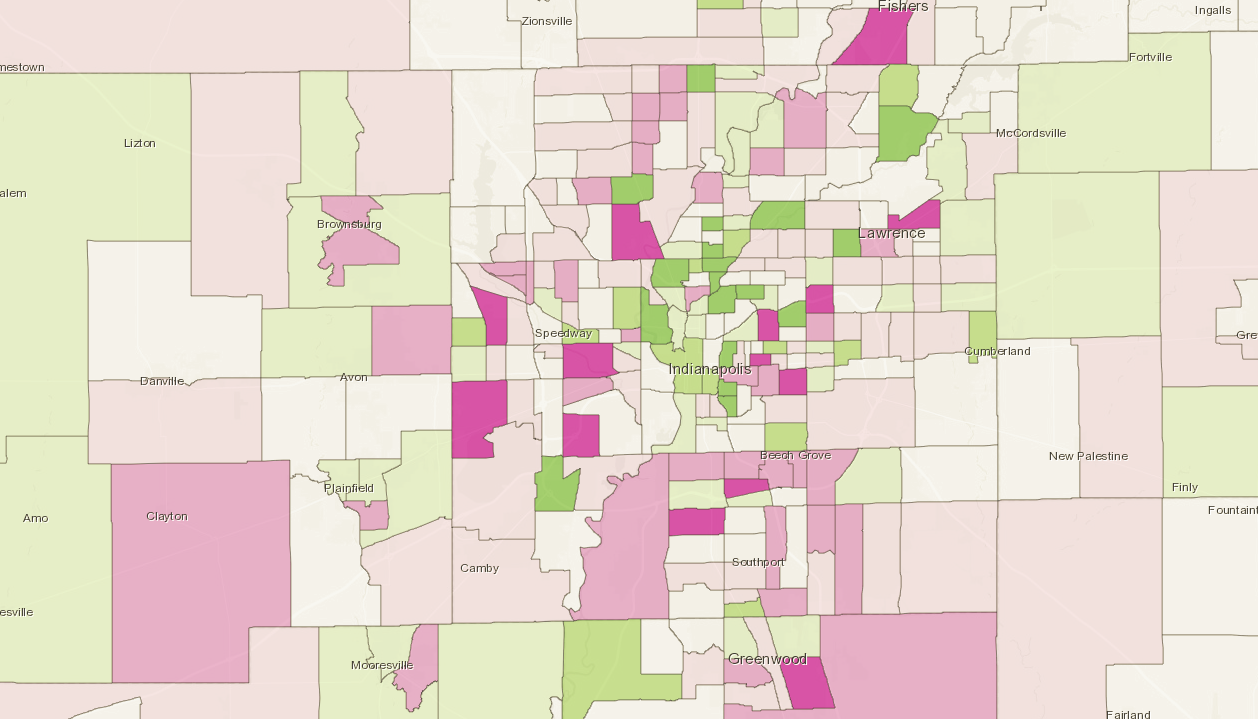
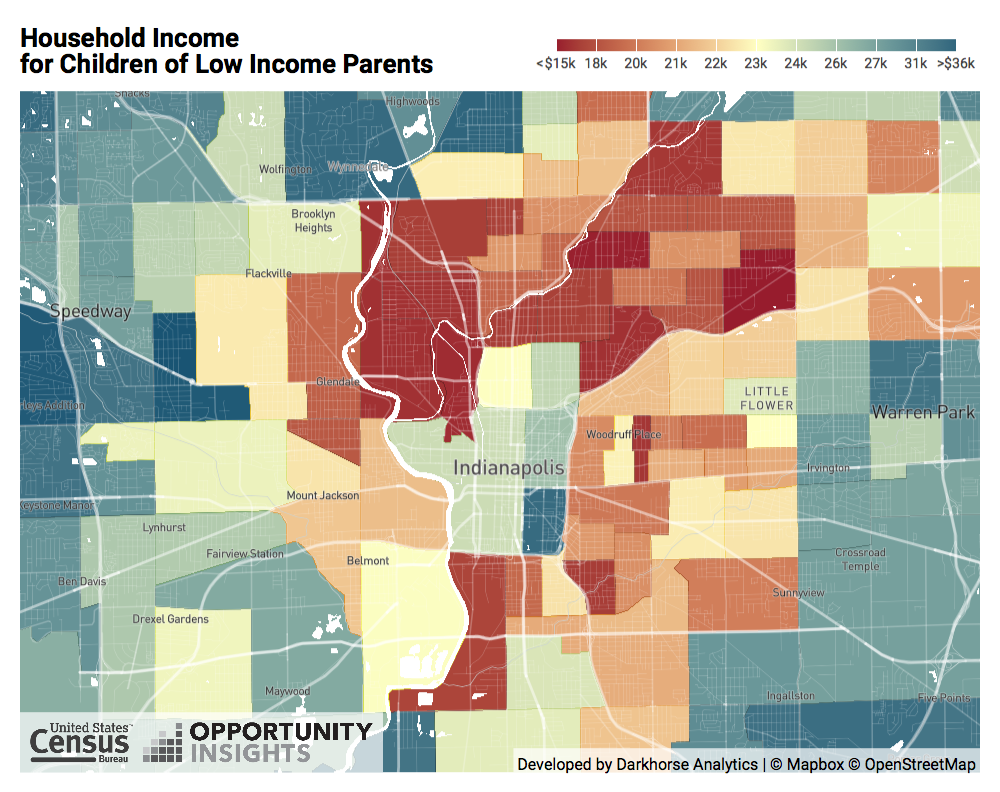 There are some neighborhoods in the core of Indianapolis that are outliers: Children born to low-income parents there grew up to have higher incomes than most low-income children. The map above is based on the typical income of someone born to low-income parents. In the median neighborhood, the average low-income child earns $23,000 as an adult household. For many core neighborhoods, especially north of Interstate 70, low-income children grow up to earn $16,000-$18,000. But in Fletcher Place, the average child born 1978-183 grew up to have a household income of $32,000.
For many core neighborhoods in Indianapolis, low-income children grew up to have household incomes of $16K-$18K. But for neighborhoods like the Old Northside, Kennedy King, West Indianapolis, Hawthorne, Little Flower, Woodruff Place, Christian Park, and Twin-Aire, low-income children grew up to earn $23,000-$26,000 on average. And in Fletcher Place, low-income children grew up to earn $32,000.
In Mass Ave, children grew up to $26,000, and in the Old Northside and Kennedy King children grew up to earn $23,000-$24,000. Other neighborhoods that approach the median of $23,000 include West Indianapolis, Hawthorne, Little Flower, Woodruff Place, Christian Park, and Twin-Aire.
While these household incomes are still lower than the median in Indianapolis, the outlying neighborhoods may provide some interesting insight into what enables economic mobility for low-income children.
Resident Retention
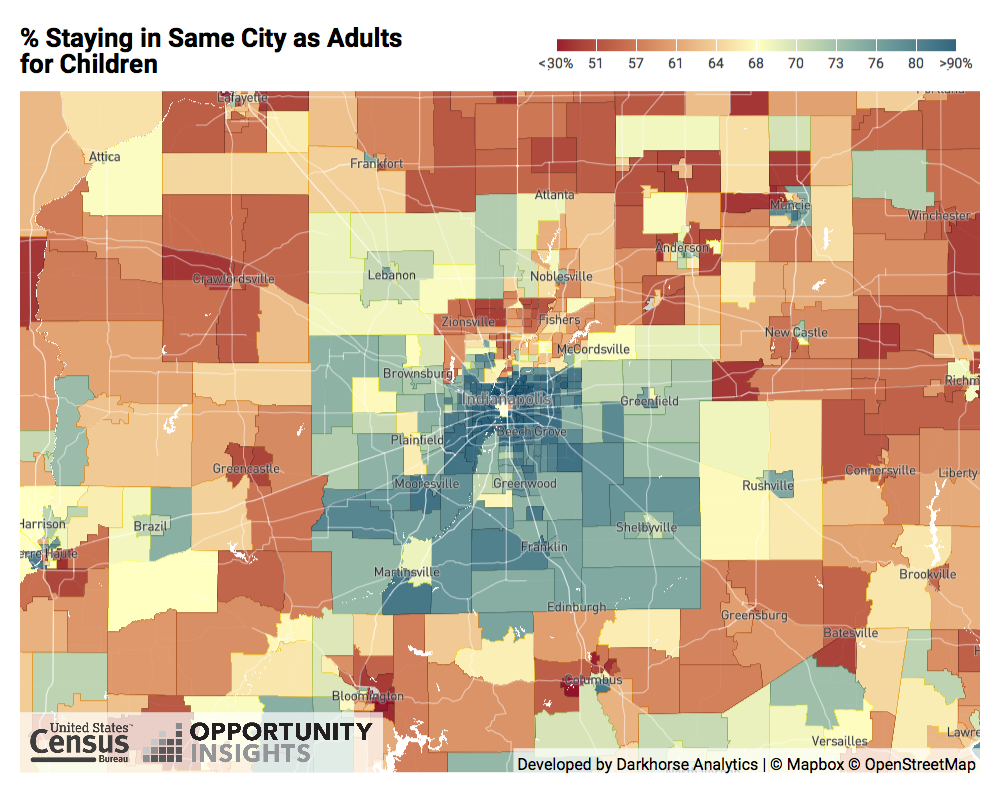 Nationally, in the median city, 55 percent of residents stay in the same city in which they were born. The Indianapolis region does a better job of retaining residents (at least those born between 1978 and 1983). Three out of four residents born in the Indy metro in 1978-1983 still lived there in 2015.
As seen in the map, resident retention is relatively low in many rural parts outside the Indianapolis region. But in Indianapolis and most of the suburban counties, resident retention is relatively high. In the affluent areas of northern Marion County and southern Hamilton County, sometimes as many as half the children who grew up there have left for other cities.
Marion County is above average in resident retention at all income levels, retaining 75 percent of high-income children and 84 percent of low-income children.
Children born to high-income parents are more likely to move to another city in adulthood. Nationally, the median county retains 54 percent of its high-income children, but 65 percent of its low-income children. The maps suggest that in rural areas, a lack of economic opportunity may encourage people to leave the region when they become adults. But in urban areas, having more resources may enable residents to move out of the city to pursue economic opportunity. Marion County is above average in resident retention at all income levels, retaining 75 percent of high-income children and 84 percent of low-income children.
Next Up
 Neighborhood Change Study in a Front Page IBJ Article
Matt Nowlin, Research Analyst, was interviewed for an article by Hayleigh Colombo in the Indianapolis Business Journal. This article showcases the change in neighborhoods like Martindale-Brightwood in Indianapolis since the […]
 Explore Changes in your Neighborhood with this SAVI App
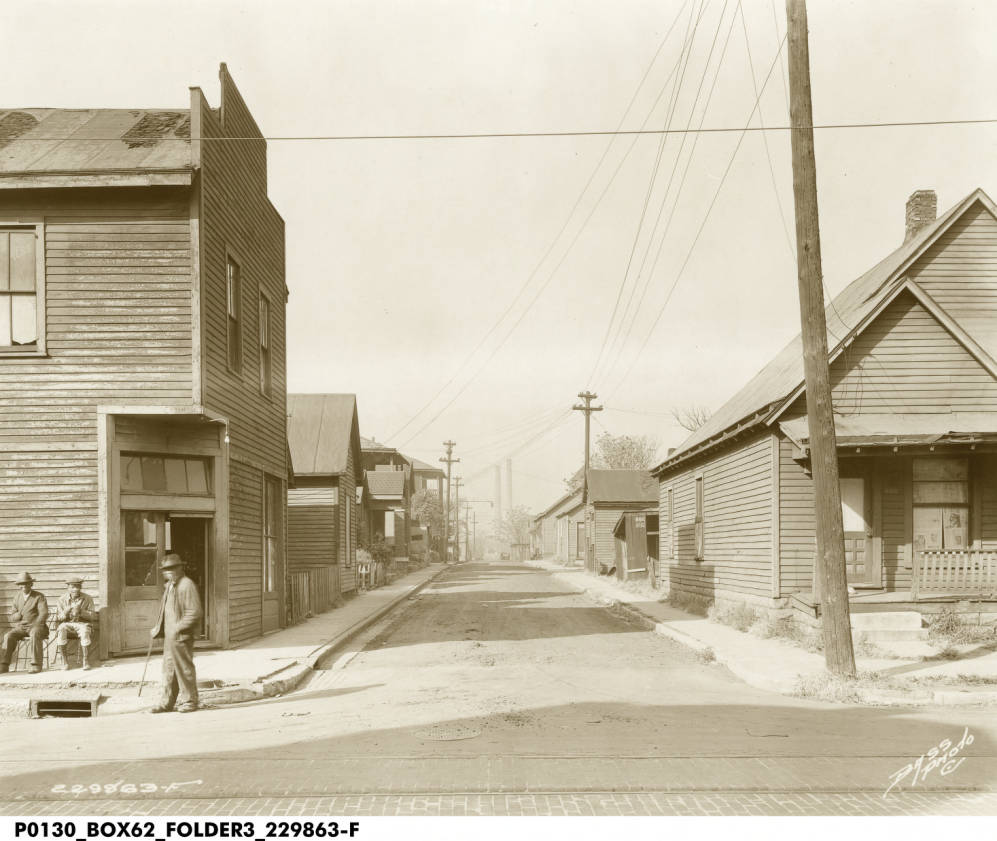 Changes in Indy’s Historic Black Neighborhoods
In the 1970s, 4,000 residents left this nearly all-black neighborhood. Why? An increasingly desegregated housing market and closure of one of the country’s first public housing projects.
 Story Map: Race and Migration Since 1970
In 1970, half of the region’s Black population lived in 12 square miles north of downtown Indianapolis. As Black residents moved into ’60s suburban communities, 120,000 White residents left the city’s core for newer suburbs.