Where You Live Matters | June 2025
Exploring Criminal Justice Trends in Central Indiana
Matt Nowlin, Ally Scott, and Bonnie VanDeventer
What you’ll find in this report
Data about:
- Criminal justice outcomes such as:
- Areas with the highest risk of criminal justice involvement
- School discipline rates
- Discipline rate by demographics and school district
- Juvenile charges
- Use of force by police officers
- Incarceration and re-entry into the world
- Jail and detention
- Life after prison
Key findings
- Neighborhoods on the near northeast side of Indianapolis have the highest risk factors for criminal justice involvement.
- Increased suspensions and expulsions increase the likelihood of later justice involvement by youth, even when controlling for other factors.
- In 2024, 17% of Black students in Marion County were suspended or expelled, compared to 8% of white students. That gap has persisted since 2011.
- Multiracial students are also consistently suspended or expelled at higher rates than white students.
- In 127 of Marion County’s 253 census tracts, the Black juvenile charge rate is at least five times the white rate. In many of these tracts, white youth were not charged at all.
- Since 2010, juvenile charges for white, Black, and Hispanic youth have declined. Charges have fallen by 86% for white youth, 90% for Black youth, and 80% for Hispanic youth.
- From 2014 to 2024, the Indianapolis Metropolitan Police Department (IMPD) recorded thousands of use-of-force incidents. The majority of these involved non-lethal tactics: weight leverage, handcuffing, takedowns, and other physical restraints were most common.
- From 2018 to 2021, Black residents made up 48% of jail bookings despite representing just 27% of the county’s population.
Glossary
- Composite risk score: A number that adds up different risk factors in a neighborhood to show how likely people there might be affected by issues such as crime or justice.
- Detention: When someone is kept in a facility and not allowed to leave while they wait for a court decision.
- Diversion program: A program that helps someone avoid going to jail or court by offering help or services instead, like counseling or community service.
- Exclusionary discipline: School punishments that remove students from class, like suspension or expulsion, which can hurt their learning and future chances.
- Incarceration: Being legally held in a jail or prison after being found guilty of a crime.
- Jail bed-day: One day that one person spends in jail. If one person is in jail for three days, that counts as three jail bed-days.
- Legal workshop: An event where people can learn about their legal rights or get help with legal problems from experts or lawyers.
- Recidivism: When someone who has been in jail or prison breaks the law again and ends up back in the justice system.
- Redlining: A past practice where banks and the government refused to give loans or insurance to people in certain neighborhoods, usually where people of color lived.
- Reentry: The process of someone coming back to the community after being in jail or prison, and trying to find housing, work, or support.
- Racial segregation: When people of different races end up living in separate neighborhoods, often because of unfair systems like housing policies, lending practices, or income inequality. Over time, this leads to some areas having very little racial diversity.
- School-to-prison pipeline: The idea that certain school rules and punishments push students out of school and into the justice system.
- Structural disadvantage: When a neighborhood lacks things like good schools, safe housing, job opportunities, or health care because of long-term unfair treatment or neglect.
- Use of force: When police or other authorities physically act to control a person, such as grabbing, pushing, or using weapons.
Background
The path into the criminal justice system does not start with an arrest. It often begins much earlier, shaped by the environments where children grow up. Communities play a powerful role in shaping opportunities and outcomes. Structural factors such as poverty, unequal access to education, racial segregation, and high rates of neighborhood-level incarceration can create conditions that increase the risk of future justice system involvement.1 These challenges are not randomly distributed; they are rooted in place. Understanding how place shapes risk is essential to creating more equitable and supportive environments for all people.
To help visualize how this plays out in Indianapolis and surrounding communities, we developed a composite risk score for each census tract. This score draws from four indicators known to correlate with higher odds of justice system contact later in life: child poverty, educational attainment, racial diversity, and incarceration rates. These indicators were selected as a condensed version of an earlier violent crime index created by the Polis Center to support funding allocations by Indianapolis-Marion County City County Council. (Polis 2020) Researchers have found these neighborhood factors—income, education, segregation, and incarceration levels—are linked to incarceration outcomes for children.2,3 Each tract received one point for each of the following high-risk factors it exhibited: being in the top 20 percent in the Indianapolis Metropolitan Area for child poverty, adults without a high school diploma, or incarceration rates; or having low racial/ethnic diversity (defined here as a diversity index of 0.3 or lower). Tracts could score between 0 and 4 depending on how many high-risk thresholds they cross.
Objectives
- Examine risk factors in neighborhoods in Central Indiana such as poverty, unequal access to education, racial segregation, and high rates of neighborhood-level incarceration – Which can all create conditions that increase the risk of future justice system involvement.
- Identify criminal justice trends in Central Indiana, the communities most impacted, and how unequal policies contribute to a pipeline to incarceration.
Geography
This report defines Central Indiana as comprising eleven counties: Boone, Brown, Hamilton, Hancock, Hendricks, Johnson, Marion, Madison, Morgan, Putnam, and Shelby. These counties exhibit varying levels of urbanization. Marion County (Indianapolis), along with Hamilton and Johnson counties, are highly urbanized, featuring substantial suburban and metropolitan development. Boone, Hancock, Hendricks, Madison, and Morgan counties present a mix of urban centers and rural landscapes. In contrast, Brown and Putnam counties are largely rural, with only small, urbanized areas.

Community Conditions and Early Risk Factors
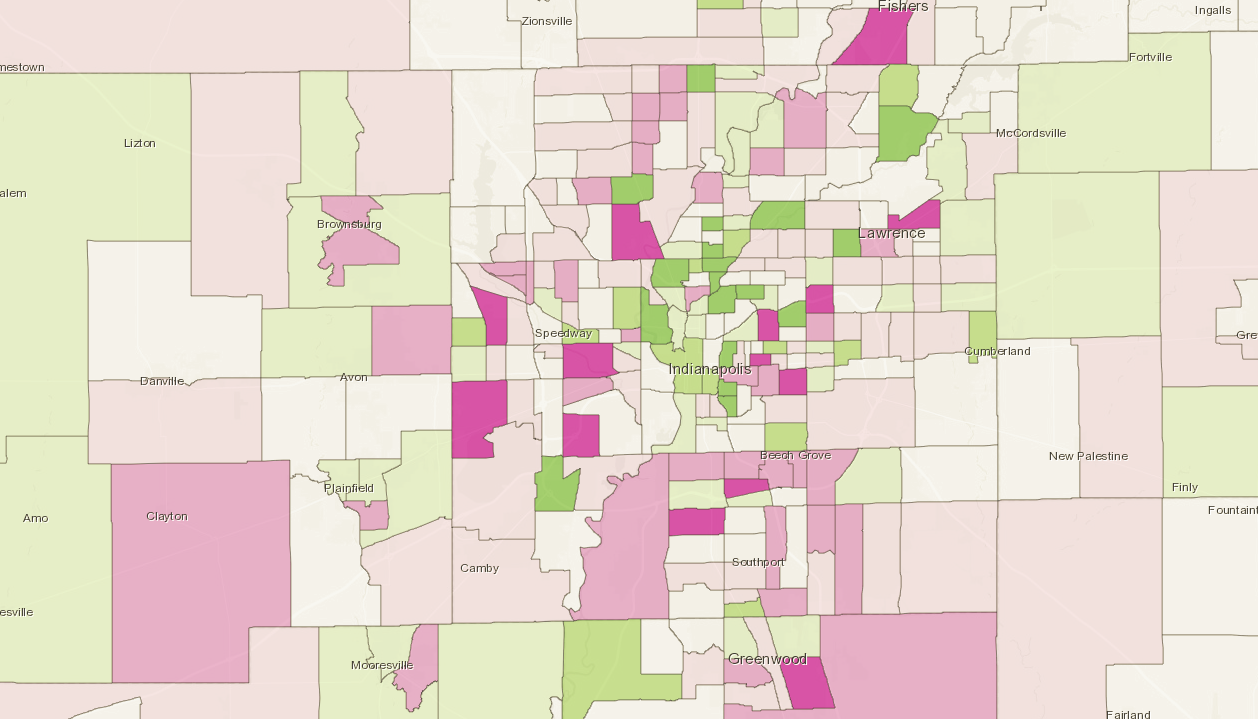
Marion County census tracts by total risk score
Source: Analysis and visualization by the Polis Center; Incarceration rates: Chetty 2018; Other data: 2023 American Community Survey via SAVI; Incarceration rates: 2010; others: 2023
Neighborhoods on the northeast side of Indianapolis have the highest risk factors for criminal justice involvement
Most of the neighborhoods south of 38th Street from Fall Creek east to I-465 have at least three of the risk factors. In Windsor Village Park, tract 3603.02, diversity is high, but nearly 7-in-10 children live in poverty and more than one third of adults have no high school diploma. In 2010, one out of every 14 adults was incarcerated.
Conditions are similar in Near Eastside neighborhoods between Rural Street and Sherman Drive, south of I-70. In Brookside Park, one quarter of adults are without a high school diploma, and one third of children live in poverty. In tract 3549, near the Sherman Park industrial site (former RCA plant), 43% of children live in poverty.
On the southeast side, from Fountain Square to Emerson Avenue, most neighborhoods have three risk factors present. Fountain Square, despite more than a decade of redevelopment, still has a child poverty rate of 35%, and 17% of adults have no high school diploma, which places it in the worst 20 percent of all census tracts in the metropolitan area.
Tracts with moderate risk—scoring two out of four—are more widely distributed but still show clustering on the West Side, Far Eastside, and Lawrence Township areas. Tract 3307.02, just east of Post Road, has a 29% child poverty rate and 25% of adults don’t have a high school diploma. On the West Side, tract 3426, west of George Washington High School, reported 25% of children live in poverty and 41% of adults are without a diploma, though it has relatively low incarceration and moderate diversity. These moderate-risk areas may not show crisis-level indicators across the board, but the layering of two significant risk factors is still cause for concern.
National research supports the importance of neighborhood conditions. According to the Opportunity Atlas from economist Raj Chetty and colleagues, children raised in low-income, racially-isolated neighborhoods are significantly more likely to be incarcerated later in life—even when their parents’ incomes are the same as peers from more advantaged neighborhoods.3 In fact, research shows that simply moving to a neighborhood with better socioeconomic conditions can reduce a child’s odds of future incarceration and increase lifetime earnings.4 In other words, place matters.
In Indianapolis, the geography of risk echoes past patterns of disinvestment and exclusion. Neighborhoods that were redlined in the 1930s and 1940s, excluded from mortgage lending and targeted for segregationist policies, are still among those with the highest poverty, lowest educational attainment, and highest incarceration rates today.5 These are the same communities where youth face systemic barriers that increase their odds of future justice system contact. For a deeper dive into redlining and its relationship to current conditions, see “Residential Segregation in Indianapolis” in the Encyclopedia of Indianapolis.6
By mapping these indicators and identifying where multiple risk factors converge, we begin to see how place-based inequities shape life trajectories. Solutions must focus first on these communities. The structural disadvantages facing children in these communities are not incidental—they are systemic, layered, and measurable. And unless we intervene early—through education, housing, public safety, and youth supports—those disadvantages will keep producing the same results.
Central Indiana census tracts by total risk score
Source: Analysis and visualization by the Polis Center; Incarceration rates: Chetty 2018; Other data: 2023 American Community Survey via SAVI; Incarceration rates: 2010; others: 2023
Central Indiana census tracts with three or more risk factors
Tracts that fell in the worst 20% regionally for three or more measures
| Tract | Diversity Index in 2023 (0-1) |
Child Poverty in 2023 (%) | Adults w/o Diploma in 2023 (%) | Incarceration Rate in 2010 | Total Risk Score | Neighborhood |
| Marion Co Tract 3523 | 0.27 | 56.3 | 27.6 | 9.9 | 4 | Martindale – Brightwood |
| Marion Co Tract 3580 | 0.26 | 44.6 | 24.4 | 6.1 | 4 | Garfield Park |
| Madison Co Tract 3 | 0.36 | 29.9 | 24.5 | 4.8 | 3 | Anderson (North Central) |
| Madison Co Tract 4 | 0.69 | 36.5 | 16.9 | 8.5 | 3 | Anderson (Westside) |
| Madison Co Tract 12 | 0.70 | 33.7 | 21.5 | 6.9 | 3 | Anderson (South Central) |
| Marion Co Tract 3553 | 0.56 | 66.9 | 16.7 | 5.6 | 3 | Near Eastside |
| Marion Co Tract 3550 | 0.68 | 42.3 | 17.3 | 6.2 | 3 | Near Eastside |
| Marion Co Tract 3549 | 0.72 | 43.1 | 24.1 | 6.2 | 3 | Near Eastside |
| Marion Co Tract 3571 | 0.42 | 35.2 | 17.4 | 4.8 | 3 | Fountain Square |
| Marion Co Tract 3545 | 0.49 | 30.9 | 21.6 | 3.9 | 3 | Near Eastside |
| Marion Tract 3308.03 | 0.43 | 58.5 | 38.7 | 6.2 | 3 | Far Eastside |
| Marion Co Tract 3508 | 0.33 | 59.3 | 34.0 | 6.1 | 3 | Martindale – Brightwood |
| Marion Co Tract 3308.06 | 0.67 | 60.2 | 23.5 | 5.1 | 3 | Far Eastside |
| Marion Co Tract 3507 | 0.42 | 53.6 | 31.2 | 8.5 | 3 | Martindale – Brightwood |
| Marion Co Tract 3521 | 0.51 | 59.3 | 19.7 | 9.5 | 3 | Martindale – Brightwood |
| Marion Co Tract 3526 | 0.68 | 35.4 | 25.4 | 5.5 | 3 | Near Eastside |
| Marion Co Tract 3601.01 | 0.61 | 27.7 | 27.2 | 4.3 | 3 | Eastside |
| Marion Co Tract 3604.02 | 0.60 | 66.4 | 19.4 | 6.9 | 3 | Far Eastside |
| Marion Co Tract 3310 | 0.32 | 59.0 | 23.2 | 5.7 | 3 | Devington |
| Marion Co Tract 3601.02 | 0.51 | 57.1 | 19.8 | 5.4 | 3 | Arlington Woods |
| Marion Co Tract 3805.02 | 0.60 | 55.1 | 20.0 | 3.8 | 3 | University Heights |
| Marion Co Tract 3573 | 0.60 | 35.0 | 53.4 | 10.7 | 3 | Near Southeast |
| Marion Co Tract 3574 | 0.66 | 46.1 | 31.5 | 6.1 | 3 | Near Southeast |
| Marion Co Tract 3603.02 | 0.62 | 68.9 | 36.6 | 6.7 | 3 | Arlington Woods |
| Marion Co Tract 3564 | 0.69 | 53.0 | 17.0 | 4.8 | 3 | Near Westside |
| Marion Co Tract 3103.06 | 0.48 | 32.8 | 20.5 | 4.3 | 3 | International Marketplace |
| Marion Co Tract 3506 | 0.24 | 61.1 | 13.2 | 6.7 | 3 | Forest Manor |
| Marion Co Tract 3226.01 | 0.21 | 32.7 | 17.4 | – | 3 | Meadows |
Bold values represent high risk for that indicator (low diversity under 0.3 or top 20% in other measures).
Source: Analysis and visualization by the Polis Center; Incarceration rates: Chetty 2018; Other data: 2023 American Community Survey via SAVI; Incarceration rates: 2010; others: 2023
Early system contact and the school-to-prison pipeline
School discipline as a first point of contact
In Marion County, school discipline rates for suspensions and expulsions have declined since 2011. Although they spiked in 2023, rates in 2024 returned to a more typical level, suggesting discipline issues after the COVID-19 pandemic were resolving back to normal levels. Yet racial disparities remain significant.
For many students, school is the first system that removes them from the mainstream. Suspensions and expulsions increase the likelihood of later justice involvement, even when controlling for other factors (Fabelo et al., 2011). Black students in Marion County are far more likely to face exclusionary discipline than their white peers. (For simplicity, we refer to suspension and expulsion but note in the chart above that expulsion makes up a very small share of exclusionary discipline.)
In 2024, 17% of Black students in Marion County were suspended or expelled, compared to 8% of white students. That gap has persisted for the entire time that data is available (since 2011). Multiracial students are also consistently suspended or expelled at higher rates (12%) than white students. In 2024, American Indian students had an elevated rate of suspensions and expulsions (13%).
This trend extends beyond IPS. In nearly every district in the county—except Decatur Township and Speedway—Black students were disciplined at least twice as often as white students.
Repeated suspensions lower academic achievement and increase dropout and arrest risk. This dynamic, known as the “school-to-prison pipeline,” was popularized in the early 2000s by researchers like Wald and Losen .7 In Marion County, it begins early and disproportionately affects Black children. For a deeper dive into this issue, see the 2021 SAVI report, Equity and Criminal Justice.8 Schools are not the only entry point into the justice system, but they are a frequent one. For many students, school may be the first institution to treat them as a threat rather than a child in need of support.
Juvenile charges and geographic disparities
While school discipline often marks the first formal contact youth have with the justice system, criminal charges are another key turning point. In Marion County, data on juvenile offense charges reveal stark disparities across geography and race.
Juvenile charge rate by census tract in Marion County
Source: SAVI
Tract-level data show that Black youth are charged with crimes at far higher rates than their white peers. In 127 of Marion County’s 253 census tracts, the Black juvenile charge rate is at least five times the white rate. In many of these tracts, white youth were not charged at all, making the Black/white ratio effectively infinite. Due to data suppression and small population counts, tract-level juvenile charging data is only consistently available for Black and white youth. However, at the county level, Hispanic youth also face elevated charge rates. For example, the juvenile charge rate for Hispanic youth in Marion County was 8.9 per 1,000 in 2020—twice as high as the rate for white youth (4.4 per 1,000). These patterns underscore that racial disparities extend beyond any single group.
Consider tract 3544, which covers the Holy Cross and Cottage Home neighborhoods. In 2020, it had a Black juvenile charge rate of 118 per 1,000 youth. The white youth charge rate was zero, though 87% of the population is white. Similar patterns appear in tracts like 3904.09 (Stop 11 Road and Arlington Avenue on the far south side) and 3209.02 (Grandview Drive and Westlane Road), where Black youth charge rates were 30 or more per 1,000 and white youth charge rates were again zero, though 28% of the population is white. These cases are emblematic of a broader trend in areas with high policing activity and concentrated poverty.
It is important to clarify that these data reflect the location of the incident, not the youth’s place of residence. The denominator, however, is based on the number of Black and white youth living in the tract. This mismatch can produce especially high rates in tracts where many incidents occur but few youths reside, such as downtown or commercial corridors like Broad Ripple. Still, the consistent racial gap across the county suggests a systemic issue.
Since 2010, juvenile charges for white, Black, and Hispanic youth have declined. Charges have fallen by 86% for white youth, 90% for Black youth, and 80% for Hispanic youth. In recent years, as rates for white youth fell faster than rates for Hispanic youth, creating a growing disparity between white and Hispanic charge rates.
These racial disparities in juvenile charging echo the disparities seen in school discipline, but with even more severe consequences. A juvenile charge can initiate court oversight, probation, or even detention—escalating the risk of future justice involvement. In this way, the geography of juvenile charges mirrors the geography of risk: neighborhoods already struggling with high risk factors and discipline rates are the same places where youth of color face the highest rates of involvement with the criminal justice system.
Policing and initial system contact
Use of force overview
Police contact is another point at which people become entangled in the criminal justice system. In Marion County, use-of-force records, arrest data, and tract-level crime rates reflect both the commonality and complexity of these encounters.
Reported use of force incidents are about half of what they were in 2021. Use of force has fluctuated over the past decade, but it is difficult to discern trends from reporting changes. From 2014 to 2021, reporting may have become more common as the pressure for police transparency increased. Beginning in 2022, new reporting requirements excluded some minor actions from reporting and no longer required the location of each incident.
From 2014 to 2024, the Indianapolis Metropolitan Police Department (IMPD) recorded thousands of use-of-force incidents. The vast majority of these involved non-lethal tactics: weight leverage, handcuffing, takedowns, and other physical restraints were most common. Tasers were used in roughly 10% of cases, while firearm use was rare.
Most use-of-force incidents were tied to arrests. Nearly half of all cases list “Arrest” as the primary service type, followed by “Calls for Service”, “Investigations”, and “Traffic Stops”. The most frequently cited reasons for using force were “Resisting Arrest” and “Non-Compliant,” accounting for more than half of all incidents. These can be subjective categories, difficult to independently verify, and often point to perceived behavioral defiance rather than criminal acts.
In 6% of use-of-force incidents, the only charge filed was “Resisting Law Enforcement.” In these cases, there was no underlying criminal offense—only resistance itself. Most of these incidents were initiated under the service type “Arrest” with no additional context recorded, making it difficult to determine what triggered the police response. The existence of over 1,000 such incidents suggests that the act of resisting alone can justify force, even in the absence of any other alleged crime.
Traffic stops and escalation
Traffic stops account for about 4% of use-of-force cases. When force is used in these settings, the most common charge is also “Resisting Law Enforcement” (457 cases). Other frequent charges include “Possession of Marijuana” (123 cases), “Driving While Suspended” (99 cases), “Illegal Handgun Possession” (81 cases), and “Operating While Intoxicated” (70 cases).
Traffic stops include severe charges as well. Burglary, vehicle theft, or leaving the scene of a crash have all resulted in traffic stops—essentially stopping a moving vehicle for some enforcement activity. Severe use of force tends to be connected to more severe charges or reported reasons. For lethal handgun usage, 74 incidents had “Felony stop/apprehension” as the reason for using force.
The force used during traffic stops is generally physical: handcuffing, weight leverage, takedowns, and in some cases taser use. The racial breakdown of these encounters reveals stark disparities. Black drivers account for 64% of all resisting charges during traffic stops, while white drivers account for 26%, Hispanic drivers account for 6%, and bi-racial drivers account for 4%. Differences in rates are similar for possession of marijuana (76% of charges are against Black drivers) and handgun possession (77% of charges are against Black drivers).
Crime and risk in place
Justice system contact is shaped not only by behavior or identity, but by geography. Census tract-level data show that exposure to crime and enforcement risk varies dramatically across Indianapolis. (For detailed crime rate maps, visit SAVI’s Crime and Safety Topic Profile.) In 2021, property crime rates in some tracts exceeded 350 per 1,000 residents, while others reported rates close to zero. Violent crime followed a similar pattern.
Importantly, these differences are correlated with structural risk factors. The composite risk score from above—based on poverty, low education levels, racial isolation, and prior incarceration rates—shows a strong relationship with violent crime (r = 0.54). This suggests that systemic disadvantage increase the risk of both experiencing violence and police contact.
Among the ten tracts with the highest total crime rates, six have multiple risk flags, including neighborhoods like Martindale-Brightwood, the Far Eastside, and 38th & Meadows. Others, like Twin Aire and the South Side, also score high on both crime and risk factors. However, two high-crime tracts in Downtown Indianapolis have no structural risk flags. This highlights an important distinction: some crime is tied to neighborhood distress, but other crime—especially in urban commercial districts—reflects non-residential activity such as nightlife, tourism, or commuting.
Arrests and race across counties
At the county level, racial disparities persist. According to 2024 the FBI’s National Incident Based Reporting System, Black residents make up a disproportionate share of arrests in every Marion County suburb. In Hamilton County, for example, Black residents account for just over 4% of the population but nearly 32% of arrests. In Boone, Hancock, and Johnson counties, Black arrest rates are five to seven times higher than their population share. In Morgan and Shelby counties, the disparity exceeds tenfold.
These disparities persist across offense categories and are not explained by crime rates alone. Instead, they reflect longstanding patterns in how and where police operate—and whom they stop, search, and arrest.
Summary
Arrests and use of force reflect how disparate community risk play out in everyday police encounters. The use of force is frequently justified by subjective terms like noncompliance or resistance, and in many cases, resisting is the only charge filed. These outcomes are not random. High-crime tracts with layered disadvantage face more enforcement, more force, and more arrests. Meanwhile, black residents are disproportionately stopped and charged. In Indianapolis, geography and identity continue to shape who enters the system.
Jail and detention
Jail as a middle chapter in system contact
In Marion County, jail is not the end of the line in the justice system—it is often the next step in a chain of encounters that begins with school discipline, escalates through policing, and culminates in detention. Most people in jail have not been convicted of a crime. They are awaiting trial, often for low-level offenses, and often because they cannot afford to pay bond. This pattern continues and amplifies the racial and geographic inequalities seen throughout the system.
According to the 2022 SAVI report Who Is in the Marion County Jail, the average daily population of the Marion County Jail between 2013 and 2021 was 2,257 people.1 In 2021, it stood at 2,202, only slightly lower than before the pandemic. The latest available data is from the Vera Institute as of the beginning of 2024, when the Marion County jail population stood at 2,133.9 Most of these individuals were held pretrial—not because they had been found guilty, but because they were awaiting the outcome of their cases. The majority were booked for low-level felonies or high-level misdemeanors, not serious violent offenses.
Racial disparities in detention
Racial disparities in the jail population are striking. From 2018 to 2021, Black residents made up 48% of jail bookings despite representing just 27% of the county’s population. White residents made up 51% of jail bookings and 54% of the population. Other races and ethnicities were not reliably reported in this dataset. Black men alone accounted for 36% of all bookings—more than any other demographic group. These disparities are not isolated; they mirror the overrepresentation of Black students in school discipline, and Black drivers and suspects in use-of-force incidents. They show how the cumulative burden of enforcement falls hardest on Black communities
In 2022, across the 11 counties of the Indianapolis Metropolitan Area, Black residents are consistently overrepresented in both arrests and jail populations — often at rates far exceeding their share of the local population. In counties like Boone, Hamilton, and Hancock, the share of arrestees who are Black is more than six times higher than the Black share of the population. These disparities persist in jail data as well: in Boone County, Black individuals make up just 2.4% of the population but 16% of the jail population, a ratio of more than six to one. Even in counties with relatively small Black populations, such as Morgan and Brown, Black residents face higher-than-expected rates of incarceration.
Marion County, home to the region’s largest Black population, shows a different pattern: although disparities still exist (Black residents make up 27.6% of the population but 59% of the jail population), the gap is proportionally smaller than in surrounding counties. This pattern suggests that racial disparities are not limited to urban enforcement but are often amplified in suburban and rural jurisdictions, where the relative impact of each arrest or jail admission can be even more disproportionate.
Length of stay and systemic barriers
Although the median jail stay is just three days, the average stay stretches to three weeks, skewed by a smaller group of people with long stays. Pretrial holds have a median stay of five days for low-level felonies and 31 days for high-level felonies. In many cases, the length of stay reflects not the seriousness of the charge but the structural barriers to release: lack of money for bond, lack of access to legal counsel, or delays in the court system. These delays compound the harm of detention, especially for those with jobs, children, caregiving roles—including support for elders or people with disabilities—or health issues.
Half of people who are booked remain in jail for fewer than three days
Percentiles by length of stay in Marion County jails, 2018-2021

Health, substance use, and jail bed usage
One in five jail bookings between 2018 and 2021 included a mental health or substance-related alert. These alerts—such as suicide watch, mental health segregation, or substance-related flags—often indicate underlying behavioral health needs that jails are not designed to address. Bookings with alerts are associated with significantly longer stays. For example, the median length of stay for people with a suicide segregation alert was 12 days, compared to just two days for those without. Even when controlling for charge level, people with alerts remained in jail longer: among those booked for high-level felonies, people with an alert stayed a median of 46 days, compared to 27 days for those without.
These alerts also correlate with more serious charges. People with alerts were more likely to be booked on felonies—65% of the time, compared to 49% for those without alerts. But disparities in length of stay persist even when charges are similar, suggesting that behavioral health conditions may delay release or complicate legal processes. This adds to the burden on jails, which increasingly function as de facto providers of mental health care. Addressing this gap—through diversion strategies or community-based treatment—could reduce jail bed usage and improve outcomes for people with unmet health needs.
The role of jail in the system
Jail plays a transitional role in Marion County’s justice system, serving not as an endpoint but as a waypoint in a broader pattern of involvement. For most individuals, it is a temporary setting during the pretrial period, often tied to the severity of the charge and to barriers like unaffordable bail or court processing delays. As previous sections have shown, these burdens are not evenly distributed. The same communities disproportionately affected by school discipline and police contact are also overrepresented in jail bookings and longer stays.
Rather than reflecting the most dangerous offenders, the jail population reflects upstream disparities in enforcement, opportunity, and access to alternatives. Its composition underscores how place-based disadvantage and racially disparate decision-making accumulate across systems—ultimately shaping who ends up held, for how long, and under what conditions.
Prosecution and conviction outcomes
Persistent disparities — or reflections of earlier inequities?
At the prosecution stage, racial disparities remain evident — but the nature of those disparities becomes more complex. Rather than uniformly worsening, disparities in case outcomes often reflect cumulative disadvantages built earlier in the system. In the 2023 SAVI report Equity in Criminal Prosecutions, we outline the latest trends in prosecution and equity issues within the system.10
From 2017 to 2022, over 50% of all criminal cases filed in Marion County were against Black defendants, even though Black residents make up just 27% of the adult population. This mirrors overrepresentation in school discipline, arrests, and jail bookings, reinforcing how early contact with the justice system increases the likelihood of further involvement.
Interestingly, cases filed against Black and Hispanic defendants were more likely to be dismissed than those filed against white defendants. Nearly 40% of Black defendants’ cases ended with all charges dismissed, compared to 34% for white defendants. For Hispanic defendants, the dismissal rate was even higher, exceeding 65%. These differences raise questions: are the disparities in prosecution corrective, or are they further evidence of inconsistency in the justice process?
What’s being charged and who gets charged?
The most common lead charges during this period were offenses such as property crimes, vehicle-related crimes, and drug possession. However, the racial breakdown varies by offense type. For example, “Driving While Suspended” accounted for a disproportionate share of cases against Black and Hispanic defendants — 18% and 59%, respectively, compared to just 13% for white defendants. This aligns with systemic challenges like debt-based license suspensions and differential access to legal remedies.
The data also shows that younger Black and Hispanic men are significantly more likely to be prosecuted. More than a third of all prosecutions of Black and Hispanic individuals involved males under 29 — higher than for white defendants. This concentration in age and demographic profile suggests that prosecution outcomes are closely tied to the pipeline of early system involvement identified in previous sections.
Reforms in practice
Recent reform efforts by the Marion County Prosecutor’s Office show promise. The 2019 decision to stop prosecuting most low-level marijuana possession led to an 85–96% decline in those charges across all racial groups. Still, a small number of cases continue to be filed — mostly against Black residents — raising questions about the discretion and consistency of reform implementation.
Similarly, the dramatic decline in “Driving While Suspended” cases — from over 370 per month in 2017 to just 21 in 2022 — reflects the impact of diversion programs and legal workshops. One major contributor to this decline was the launch of Second Chance Workshops in 2019, which allowed individuals with suspended licenses to work with attorneys to waive unpaid fees and restore their driving privileges. According to the Vera Institute, more than 2,000 licenses have been reinstated through these workshops. The Marion County Prosecutor’s Office emphasized that these cases often involve no threat to public safety and that the workshops reduce unnecessary prosecution for poverty-related offenses.
Incarceration and reentry
Long-term incarceration in Central Indiana
Incarceration is one of the most visible and enduring consequences of contact with the criminal legal system. Although many individuals in the system experience pretrial detention, others are sentenced to serve time in state prisons. Prison incarceration marks a major inflection point in a person’s life, disrupting employment, housing, family stability, and health. In Central Indiana, particularly in Marion County, prison use has remained high and remarkably consistent over the past decade after declining from a peak in 2006.
County incarceration rates are made available by the Vera Institute, who combines data from multiple national data sources to produce county-level results. The latest available prison incarceration rates are from 2019. A county’s incarceration rate is the number of prisoners that were convicted in that county’s courts. It is likely but not always certain that the prisoner lived in and committed the crime in that county. This is not the rate of people actually incarcerated in the county. For example, Marion County does not have a state prison, so no one is incarcerated in Marion County.
At the end of 2019, Marion County had a prison incarceration rate of 1,249 per 100,000 residents, slightly higher than the Indiana state average of 1,072. This rate peaked at 1,664 in 2006 and declined significantly to 1,258 in 2016. Despite statewide reforms and a shift toward diverting some low-level offenders to local jail or community supervision, the prison incarceration did not fall meaningfully after 2009.
Marion is not the only county in the Indianapolis region with a high rate of imprisonment. As of the most recent data, Madison County’s rate was 1,947 per 100,000 — nearly twice the state average. Madison County’s high incarceration rate likely reflects similar structural risk factors found in many high-risk Marion County neighborhoods. Areas of Anderson, the county’s largest city, show elevated levels of poverty, low educational attainment, and prior incarceration—mirroring the same conditions that correlate with justice system involvement elsewhere in the region. These upstream disadvantages likely contribute to higher incarceration rates, even in a smaller county context.
Morgan (1,127), Hancock (946), and Shelby (1,671) Counties also exceeded 900 per 100,000. In contrast, Hamilton County’s rate was just 314 per 100,000, the lowest in the region. This local variation underscores broader patterns of geographic and racial inequality in criminal justice outcomes. The same counties with higher arrest and jail disparities often have elevated prison rates as well.
While many system contacts lead only to arrest, summons, or short jail stays, incarceration in state prison often reflects a deeper level of disconnection from alternatives — legal representation, diversion, mental health support, or access to pretrial release. In this way, prison trends are shaped by upstream disparities, not just case severity. The consistency of Marion County’s prison rate over two decades, despite efforts at reform, suggests that broader systemic changes are needed to meaningfully reduce incarceration.
In the second half of this section, we will turn to what happens next: the process of returning home. Even after release, the experience of incarceration continues to shape individuals’ lives, limiting opportunities and compounding disadvantage. We examine barriers to employment, housing, and health care for those returning from prison, as well as recent policy efforts aimed at improving reentry outcomes.
Returning home: barriers to reentry
Criminal records limit access to housing and employment. Many leave prison without IDs, job prospects, or a connection to healthcare—barriers that compound risk and undermine stability.
In 2025, Governor Mike Braun signed Executive Order 25-46,12 directing Indiana agencies to address these gaps head-on. The order cites that people released into homelessness are 50% more likely to reoffend, and those without employment face a 52% recidivism rate, compared to 16% for those stably employed. The Indiana Department of Correction was ordered to set measurable benchmarks, identify those at high risk of homelessness, expand job support through the Hoosier Initiative for Re-Entry (HIRE), and coordinate access to services and family reunification. A statewide report is due in June 2026.
The policy marks a shift toward a more intentional approach. But its long-term impact will depend not just on coordination—but on whether returning citizens are treated as neighbors with futures, not former offenders with records.
A systemic pipeline
The findings in this report make one thing clear: the criminal legal system is not a set of isolated decisions, but a layered structure that begins long before a person is incarcerated. School discipline, neighborhood-level disadvantage, police contact, jail bookings, and prison admissions are all connected—and disparities compound over time.
Relationship between risk score and crime rate
High crime rates are tracts in the top 25% regionally
High risk scores are tracts with a score of three or four
Source: Risk score developed by the Polis Center. Crime rates from Indianapolis Metropolitan Police Department
The final visuals underscore how these dynamics play out across Central Indiana. The above map of Marion County reveals where structural disadvantage (as measured by a composite risk score) and public safety concerns (crime rate quartile) converge. Neighborhoods shaded deep purple—such as parts of Martindale Brightwood, Twin Aire, and the Far Eastside—are facing both high risk and high crime. Meanwhile, tracts in pink stand out as high-risk communities with low recorded crime, places where systemic disadvantage is severe, but enforcement may be less concentrated. Blue tracts indicate high crime but relatively low structural risk—often downtown, where enforcement intensity is shaped more by commercial or public space activity than by residential conditions.
At the county level, a different kind of disparity emerges. In suburban counties like Hamilton, Boone, and Hancock, Black residents are overrepresented among those arrested and jailed. For example, in Hamilton County, Black residents make up just 4.2% of the population but 31.8% of arrests—an arrest disparity ratio of 7.6. In Shelby County, the jail population is 6% Black despite a county population that is only 1.2% Black. These disparities are even more extreme than those found in Marion County, where racial disproportionality is high but somewhat more aligned with population.
Black residents are overrepresented in every Central Indiana county’s jail and arrest numbers
Jail population: 2022, arrests: 2024, population: 2023
| County | Black pop % (2023) | Black arrestee % (2024) | Arrest Ratio | Black jail pop % (2022) | Jail ratio |
| BOONE | 2.4 | 17.7 | 7.3 | 16 | 6.55 |
| BROWN | 0.6 | – | 0.0 | 3 | 5.01 |
| HAMILTON | 4.2 | 31.8 | 7.6 | 26 | 6.19 |
| HANCOCK | 3.1 | 20.4 | 6.5 | 15 | 4.79 |
| HENDRICKS | 9.1 | 25.6 | 2.8 | 20 | 2.20 |
| JOHNSON | 3.1 | 17.4 | 5.7 | 13 | 4.25 |
| MADISON | 6.3 | 16.3 | 2.6 | 18 | 2.86 |
| MARION | 27.6 | 55.5 | 2.0 | 59 | 2.13 |
| MORGAN | 0.5 | 5.1 | 10.1 | 2 | 3.98 |
| PUTNAM | 3.4 | 12.1 | 3.5 | 4 | 1.17 |
| SHELBY | 1.2 | 16.6 | 13.7 | 6 | 4.95 |
Source: Vera Institute, National Incident Based Reporting System, American Community Survey 5-year estimates
Taken together, these maps and metrics paint a portrait of a justice system shaped by place, race, and policy. While incarceration is the most visible endpoint, the drivers of inequality are upstream: in neighborhoods, schools, housing policy, and enforcement patterns. Any lasting solutions must begin there, too.
Long-term incarceration in Central Indiana
Conclusion
This report provides a comparative analysis of criminal justice involvement outcomes alongside socioeconomic and environmental factors. Our findings reveal a clear pattern: neighborhoods with higher risks (less diversity, increased poverty, lower education attainment) tend to have higher chances of experiencing criminal justice involvement than neighborhoods with lower risks of those indicators. These challenges are not randomly distributed but rather they are rooted in place. Understanding how place and policy shapes risk is essential to creating more equitable and supportive environments for all people.
Data Sources
Table 1: List of all indicators by source, year, and geography
| Theme | Indicators | Description | Source and Year | Geography |
| Risk Index Score |
Criminal justice involvement | Number of measures where tract scores in worst 20% of tracts regionally, score of four is highest risk | Analysis and visualization by the Polis Center: Chetty 2018, Other data: 2023 American Community Survey via SAVI | Census Tracts |
| Central Indiana Census Tracts with Three or More Socioeconomic Risk Factors |
Number of measures where tract scores in worst 20% of tracts regionally, score of four is highest risk | Chetty 2018, Other data: 2023 American Community Survey via SAVI | ||
| Relationship between Risk Score and Crime Rate | Census tract relationship between Risk Score and Crime Rate | Risk score developed by the Polis Center. Crime rates from Indianapolis Metropolitan Police Department Year: Crime rates: 2022 |
||
|
School Suspensions and Discipline
|
School Discipline Rates | Aggregated students at all public schools in Marion County (including charter schools) |
Indiana Department of Education via Richard M. Fairbanks Foundation. Year: 2011-2024 |
Marion County |
| Discipline Rate by Race | County | |||
| Discipline by Race and District | County | |||
| Juveniles | Juvenile charge rate |
Juvenile charge rate by census tract in Marion County Charges per 1,000 residents under age 18 (2020 |
SAVI | Census tracts in Marion County |
| Juvenile charges by Race | Count of tracts by ratio of juvenile charges against Black vs. White children |
Marion County Superior Court via SAVI Year: 2020 |
||
| Juvenile charge rates by Race | Marion County juvenile charge rates by race | Marion County Superior Court via SAVI | ||
| Arrests | Arrests and Race Across Counties | Percent of arrests compared to percept of population in Central Indiana (2024) | National Incident-Based Reporting System Year: 2024 |
County |
| Police Use of Force | Use of force incidents by Year | Unique use-of-force incidents by Indianapolis Metropolitan Police Department over time | IMPD Years: 2014-2024 |
Indianapolis Metropolitan Area |
| 10 most common types of force | Ten most common types of force (% of incidents) by IMPD | |||
| 10 most common reasons for use of force | Ten most common reasons for use of force (% of incidents) by IMPD | |||
| 10 most common service types where force was used | Ten most common service types where force was used (% of incidents) by IMPD | |||
| 10 most common charges when force was used | Ten most common charges when force was used (% of incidents including charge) by IMPD | |||
| Charges for traffic stops where force was used | Use-of-force incidents involving a traffic stop by IMPD | |||
| Type of force for traffic stops where force was used | Use-of-force type involving a traffic stop by IMPD | |||
| Common charges in traffic stops (by race) | Use-of-force incidents by race involving a traffic stop by IMPD | |||
| Incarceration |
Black jail population compared to Black population | Comparing black population to percent of jail population that is Black by county | Vera Institute Year: 2022 |
County |
| Marion County prison incarceration rate | Rate of people in prison from a case heard in Marion County court (per 100,000) | Vera Institute Years: 2002-2019 |
Marion County | |
| Prison incarceration rate by County | Rate of people in prison from a case heard by County court (per 100,000) | County | ||
| Proportion of jail population | Proportion of jail population in each charge level by year (daily average). | Analysis by the Polis Center of data from Marion County Sheriff’s Office. | Marion County | |
| Length of stay in jail | Percentiles by length of stay in Marion County jails, 2018-2021. | |||
| Median days in Marion County jails | Median days in Marion County jails for bookings by presence of alerts, 2018-2021 | |||
| Prosecution and Eviction Outcomes | Racial Disparities in Prosecutorial Case Filings | Cases brought by Marion County Prosecutor’s office (2017-2022) and adult population by Race and Ethnicity | SAVI Analysis of Marion County Prosecutor’s Office data: The American Community Survey (ACS) 2021 5-YR via SAVI | Marion County |
| Distribution of Case Types by Race and Ethnicity | Share of cases filed against defendants in each racial and ethnic group by lead charge, among cases filed by MCPO between 2017-2022 | |||
| Gender Disparities in Prosecutorial Case Filings | Cases filed by Marion County Prosecutor’s office by sex of defendant compared to Marion County population estimates | |||
| Incarceration and reentry | Black Residents in Jail and Arrests | Overrepresentation of Black Residents in Jail and Arrests Across Central Indiana Counties | Vera Institute, National Incident Based Reporting System, American Community Survey 5-year estimates 2002-2019 | County |
Acknowledgments
Contributors: Jay Colbert, Asger Ali, Kayla Duncan, Alli Kraus, Katharine Brunette, Nigama Pervala, and Sharon Kandris
")
Endnotes
- The Polis Center. (n.d.). Who is in the Marion County Jail? Exploring Length of Stay through an Equity Lens. SAVI. Retrieved June 4, 2025, from https://www.savi.org/feature_report/who-is-in-the-marion-county-jail-exploring-length-of-stay-through-an-equity-lens/
- Goin, D. E., Rudolph, K. E., & Ahern, J. (2018). Predictors of firearm violence in urban communities: A machine-learning approach. Health & Place, 51, 61–67. https://doi.org/10.1016/j.healthplace.2018.02.013
- Chetty, R., Friedman, J. N., Hendren, N., Jones, & Porter, S. R. (2018). The Opportunity Atlas: Mapping the Childhood Roots of Social Mobility. Census.Gov. https://www.census.gov/library/working-papers/2018/adrm/CES-WP-18-42R.html
- Chetty, R., Hendren, N., & Katz, L. F. (2016). The Effects of Exposure to Better Neighborhoods on Children: New Evidence from the Moving to Opportunity Experiment. American Economic Review, 106(4), 855–902. https://doi.org/10.1257/aer.20150572
- The Polis Center. (2022, April 14). Modern Redlining in Indianapolis? SAVI. https://www.savi.org/modern-redlining-in-indianapolis/
- Ryan, J. (2023, February 7). Residential Segregation in Indianapolis. Encyclopedia of Indianapolis. https://storymaps.arcgis.com/stories/c239c88a2f8f4c4aae45f1b229f22748
- Wald, J., & Losen, D. F. (2003). Defining and Redirecting a School-to-Prison Pipeline. New Directions for Youth Development, 2003(99), 9–15.
- The Polis Center. (2021). Equity and Criminal Justice: The Cradle to Prison Pipeline in Indianapolis. SAVI. https://www.savi.org/feature_report/equity-and-criminal-justice-the-cradle-to-prison-pipeline-in-indianapolis/
- The Vera Institute of Justice. (n.d.). Marion County, Indiana | Incarceration Trends. Retrieved June 4, 2025, from https://trends.vera.org/state/IN/county/marion_county
- The Polis Center. (2023, March 23). Equity in Criminal Prosecutions: Analyzing Case Filings from the Marion County Prosecutor’s Office. SAVI. https://www.savi.org/equity-in-criminal-prosecutions-analyzing-case-filings-from-the-marion-county-prosecutors-office/
- Adams, D., & Reynolds, L. (2002). Bureau of Justice Statistics 2002: At a Glance | Bureau of Justice Statistics. https://bjs.ojp.gov/library/publications/bureau-justice-statistics-2002-glance
- Braun, M. (2025, February 3). Executive Orders. Indiana Governor Mike Braun. https://www.in.gov/gov/newsroom/executive-orders/
Next Up
 Children Transfer Often at Charter Schools, Low-Income Schools
When a student changes schools often, it can impact education outcomes. Charter schools tend to have the highest transfer rates, and a school’s share of students from low-income families has a strong relationship to transfer rates.
 Income Inequality High Where Golden Hill and Northwest Indianapolis Converge
In the area where wealthy Golden Hills converges with the working-class neighborhoods of Northwest Indianapolis, income inequality is high and increasing. The area is also experiencing a growth of white households above the median income.
 Explore Changes in your Neighborhood with this SAVI App
 Neighborhood Change 1970-2016