Here in Indiana, the discourse has centered on the state’s low levels of degree attainment compared to the nation as a whole and to neighboring Midwestern states. Most recently, a report released by the Indiana Commission for Higher Education (ICHE) showed a steep decline in the share of graduating high schoolers choosing college.
Media outlets and commentators have dug into the statewide trends. Subject-matter experts have provided context for what this means for the state’s economy. Public officials have also weighed in with proposals for rectifying the problem.
We hope to add to this important discussion by focusing on the trends in college-going rates in Central Indiana. We will rely primarily on data published by ICHE to show how rates of college-going have changed in Central Indiana counties, school corporations, and individual schools themselves.
When we say “college” we mean the “the full range of credentials beyond high school from a one-year certificate and up,” as defined by the ICHE. It is an inclusive definition, reflecting the state’s goal that 60% of working-age Hoosiers will have a quality college degree or credential by the year 2025. This goal was established in 2012 by then-governor Mitch Daniels. At some Indiana high schools, students can earn an associate degree or technical certificate. For example, in 2021, 1,900 students completed a certificate or credential through an Indiana Department of Education initiative called Crossing the Finish Line. Participation in programs like this during high school does not meet the ICHE’s definition of “going to college.” It’s possible programs like these have diminished the need for traditional college among some small group of students. However, the larger trend of college enrollment decline continues.
 Learn more about higher education with this IndyPL reading list.
View reading list
This research was presented at Data and Drafts in partnership with WFYI and Indianapolis Public Library. Download the presentation slides.
View this article’s interactive map as a standalone web-app.
The Statewide Decline in College-Going Rate
In 2010, 66 percent of graduating Indiana high schoolers chose to pursue some form of post-secondary education. This includes traditional four-year degrees, two-year associate’s programs, and one-year certificates. By 2020 that share had declined to just 53 percent–the lowest number on record in at least a generation.
The COVID-19 pandemic impacted college-going rates in 2020, but the decline precedes that crisis. The college-going rate has declined each year since 2015. If trends from 2016 to 2019 had continued without the pandemic, the state’s college-going rate would still be an estimated 56 percent.
The share of graduating high school students choosing college declined by 13 points in the last decade
Statewide College-Going Rates: 2010 – 2020
Male high school students are far behind female students in choosing to attend college
Statewide College-Going Rate by Gender: 2010 - 2020
Black students felt the largest decline in college-going rate compared to other racial and ethnic groups
Statewide College-Going Rate by Race & Ethnicity: 2010 – 2020
Students on the Federal Free or Reduced-Price Lunch Program had a steep decline in college enrollment
Statewide College-Going Rate by Socioeconomic Status: 2010 – 2020
Students in the 21st Century Scholars Program have a 30-point college-going advantage compared to students not in the program
Statewide College-Going Rate by 21st Century Scholars Status: 2010 – 2020
Declining College-Going Rate in Central Indiana
One positive trend for Central Indiana is that the region did not have as steep a decline in the college-going rate compared to the state as a whole. The Indianapolis metro area had a 12-point decline in college-going while the state experienced a 13-point decline. That difference may seem trivial, but a single percentage point in this measure represents over 250 high school students. Additionally, there were seven metro areas around the state with larger declines than Indianapolis. It should be noted here that no metro areas experienced an overall increase in the college-going rate, all declined by at least 7 points.
The Indianapolis Metro Area had a larger decline in college-going rate than six of the state’s fourteen metro areas
Change in College-Going rate by Metro Area: 2010 - 2020
Marion County was among the six Central Indiana counties with a larger decline in college-going rate than the state overall
Change in College-Going Rate Relative to Statewide Shift: 2010 - 2020
Trends in Central Indiana School Corporations
The story of college-going rates among school corporations in Central Indiana is one of income and affluence. A few exceptions exist, but the general trend is higher income and more educated communities produce a higher share of college-going students while lower income and less educated communities produce a lower share. Despite all the downward trends in overall college-going rate mentioned in previous sections, this relationship persisted between 2010 and 2020.
For this section of our article, we use the U.S. Census Bureau’s geographic school district units to combine income and education data with the Commission for Higher Education’s college-going numbers. School “corporations” and school “districts” are used interchangeably throughout as they have the same meaning in our data. Analysis of school corporation data only includes public school corporations with geographic-based student bodies. All other sections of this report include private and charter schools as well. Some corporations only have one high school (e.g. Anderson Community School Corporation), others have multiple (Indianapolis Public Schools, for example).
In 2010, school districts with the highest college-going rates were clustered in higher-income, highly educated suburban communities. In all but two of the top ten districts for college-going rates, the area median household income was higher than the metro area ($53,085 in 2010). Additionally, all but three districts also had a higher bachelor’s degree attainment rate than the metro area (31 percent in 2010). The only Marion County district to make the top ten—Washington Township—was significantly more educated and higher income than the county as a whole.
Higher income and more educated school districts have higher shares of high schoolers choosing college
School districts with the ten highest college-going rates in 2010
The relationships between income, education, and college-going rates persisted through 2020
School districts with the ten highest college-going rates in 2020
The positive movement in these three districts was rare. They were the only school districts in the region to have an increase in its college-going rate over the last decade.
While most districts declined, some had particularly steep drops. Below are the ten districts that had the largest declines in the college-going rate.
Four Marion County School Districts were among those with the largest declines in college-going rates
School districts with the ten largest college-going rate declines between 2010 and 2020
College-Going Rate at IPS Schools peaked at 58% in 2014 and has since sunk to 31% in 2020
College-Going Rate at IPS Schools: 2010 - 2020
All Indianapolis Metropolitan School Districts had College-Going Rate Declines since 2010
College-Going Rate at Indianapolis Metropolitan School Districts: 2010-2020
College-Going Rates in Central Indiana High Schools
While the relationships between area income, bachelor’s degree attainment, and college-going rates at school districts seems clear at first glance, it’s always important to look for relationships between variables at the lowest level of the data hierarchy if possible. Sometimes trends at a higher level of a data structure (school districts or counties) can be different when moving further down the hierarchy (schools, in this case).
The Commission for Higher Education publishes detailed statistics for many schools in the Indianapolis metro area on important variables that might be related to college-going rates. Our primary goal at this point in the analysis is to understand which factors influence a school’s college-going rate the most. In other words, what makes a school more likely to send students to college?
To answer this question, we looked at data on all high schools in the Indianapolis metro area that met several criteria:
- Schools that serve traditional high school-going populations. This means that organizations like career centers, juvenile correctional facilities, and schools for students with unique circumstances (e.g. Indiana School for the Deaf) were excluded from the data set.
- Schools with at least 10 students in their graduating class in 2020. Class sizes smaller than this produce college-going rates that can skew overall averages and trends and were excluded from the analysis.
- Schools that had valid data reported to the Commission on variables potentially related to college-going rates. Not all schools reported data on every variable collected by the Commission. Some did not because of privacy concerns, others because of very small subpopulation numbers.
The interactive map below shows all 96 schools in the resulting dataset along with data on relevant variables. You can scroll and click to find schools you might be interested in learning more about. Mobile users may find this external link to function better than the embedded map below.
- The percentage of graduating students on the Federal Free or Reduced-Price Lunch Program. This program is based on the student’s household income, which provides a good proxy for average economic resources of a graduating class.
- The percentage of graduating students receiving honors diplomas. Honors diplomas demonstrate the share of a graduating class that is either “high-achieving” or has access to resources allowing them to complete a higher-level diploma program.
- The percentage of graduating students who were white. Since not all schools in the dataset reported data for every racial or ethnic group, we used the white share of the graduating class, which was reported for every school. Some schools’ student bodies are so predominantly white that they keep race data protected for other groups as those populations are very small.
- The percentage of graduating students who participated in the 21st Century Scholars Program. This state-run program gives participating students full four-year tuition at public Indiana colleges if they meet certain income and academic standards. This measure gives us an estimate of the share of graduating students being provided financial help to attend college.
These four variables explain slightly more than half of the variation in college-going rate between schools. The share of students receiving an honors diploma has the most impact on college-going rates: For every 10-percentage point increase in the share of students receiving an honors diploma, the college-going rate increase by five points. When looking at schools with the highest share of students with honors diplomas, we can see that they also go to college at high rates. They are generally private schools, charter schools, or schools in very high-income areas.
Schools with high rates of honors diplomas are most likely to have high college-going rates
Schools with the ten highest shares of students receiving honors diplomas, 2020
Interestingly, the share of graduating students who were white did not have a significant effect on college attendance. It is no secret that in the United States white students are generally more well-off than non-white students and that school resources are often skewed towards wealthier, white areas. When we control for socioeconomic differences, the white share of a graduating class is not a significant predictor of college-going rate. There are many schools with overwhelmingly white student bodies in less economically fortunate areas—often rural areas. These schools often have lower college-going rates, suggesting that the relationship between race and college is not as simple as may have been guessed.
For example, below are 10 schools with at least a 65 percent white graduating class, but with college-going rates lower than the state average.
Not all overwhelmingly white graduating classes have high college-going rates
Ten Central Indiana Schools with 90% white graduating classes and below average college-going rates
Enrollment in the program has remained stagnant over the last decade: 9.6 percent of graduating students were enrolled in 2010, 9.7 percent were enrolled in 2020. The Commission for Higher Education suggests auto-enrolling all eligible students into the program as a part of their recommended actions in the 2022 College Readiness Report. As one of the few statewide programs aimed at financially supporting lower income students in their pursuit of a college degree, this is a strong recommendation. Students cannot change their household income or the academic and financial resources at their school, but the state can change how many of them receive assistance.
In conclusion, it’s important to remember that this is a model of school-level results, not individual student outcomes. Each student is unique and requires specific support along their educational journey to achieve the best outcome for themselves. It is not simply a function of providing the “right” inputs to achieve the “right” output. To reverse the trend of declining college-going rates, the Central Indiana community will need the support of school administrators, teachers, local elected officials, community leaders, nonprofit organizations, the state legislature, and students themselves.
View college-going rates for all Central Indiana high schools in our dataset
Full dataset can be downloaded by clicking "Get the Data" below
Next Up
 Children Transfer Often at Charter Schools, Low-Income Schools
When a student changes schools often, it can impact education outcomes. Charter schools tend to have the highest transfer rates, and a school’s share of students from low-income families has a strong relationship to transfer rates.
 Where Schools Are Changing
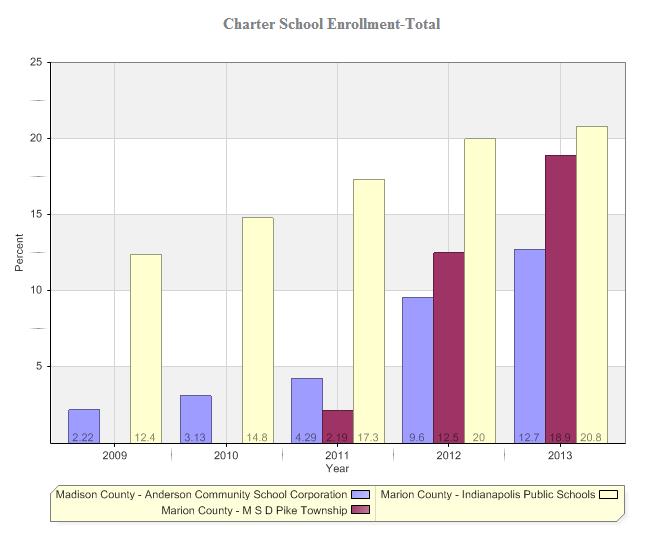 Love It or Hate It, Charter School Enrollment Is on the Rise
The topic of charter schools is often controversial. Consider this. The percent of students in the Indianapolis Public School Corporation enrolled in charter schools 5 years ago was 12.4%. In […]
 2012 Community Report: Early Childhood to College & Career