
Key points
- Voter turnout in Marion County is low relative to Indiana and the U.S.
- Within Marion County, there is great variation in voter turnout between precincts
- Lower voter turnout in Marion County tends to occur in areas that are less affluent, have lower educational attainment, and where there are greater proportions of minority populations
What is voter turnout, and why does it matter?
Voter turnout is an important way to measure civic engagement. The more people who vote, the better representation there is of the actual population by those elected to hold office. Voter turnout is typically measured by the number of ballots cast divided by the number of registered voters, or the number of ballots cast divided by the number of voting-eligible citizens.
Voter turnout is not equal across all geographic areas or groups of people. For example, voters who identify as white alone were overrepresented relative to the general adult population in the U.S. 2020 election, while the share of 2020 Hispanic or Latino voters were underrepresented relative to their share of the adult U.S. population. There also were slight differences between the percent adult populations and percent voter populations of Black and Asian-Americans in 2020, with slight voter underrepresentation for each group.
Causality behind differences in voter turnout between different racial and ethnic groups varies and can be complex. In the aforementioned example with Hispanic or Latino voters in 2020, they comprised a lower percentage of registered voters relative to their portion of the general population because they had a 26% lower citizenship rate relative to non-Hispanic white adults, while also being one of the youngest racial or ethnic groups in the U.S.
On average, voter turnout from 2022 in Marion County was the third lowest out of all counties in the state. Relative to an estimated average voter turnout rate based on the voting-eligible population across the nation in 2022 of about 47%,1 Marion County was 14% lower.2 Thus, voter turnout in general is very low in Marion County, particularly in several precincts within the greater Indianapolis area where it is less than 25%.
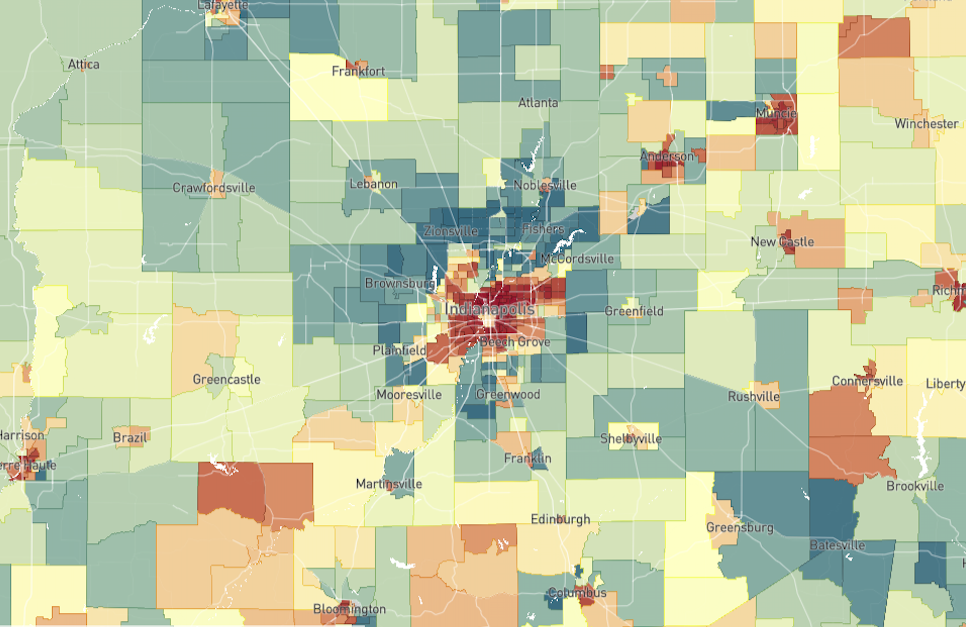
In Marion County, the 2022 midterm election had large variability in voter turnout between voting precincts. In other words, some voting precincts had much higher rates of turnout than others. For example, voter turnout was greatest in the northern and southern extent of Marion County, as well as several precincts directly downtown and around Irvington and portions of Speedway. To better understand these differences in voter turnout within Marion County, additional data and statistics can be used to assess what may be contributing to voter turnout variability.

Did you know?
On indy.gov, you can register to vote in Marion County, learn how to apply for an absentee ballot, view election results, and update your current mailing address or name.
This map shows the registered voter turnout by precinct in Marion County for the 2022 general election.
Zoom in and click on individual voting precincts to see precinct-level raw data. Click the arrows in the top left to see the legend, where darker colors represent greater voter turnout.
Using data and statistics to understand what may influence voter turnout
Although voter turnout is oftentimes related to race and income, the actual relationship with these variables at a more granular level can be complex. For example, well-cited work on Canadian voting showed that predictive modeling of whether an individual was likely to vote did not perform much better than random guessing, even when looking at a robust dataset of over three dozen potential predictive variables. They hypothesized this was largely because of small effects that are difficult to measure and may change over time (non-stationary factors), such as the weather, traffic, or one’s personal health. However, the same researchers did suggest that looking at aggregated voter turnout may help deal with some of the idiosyncrasies of individual circumstance when deciding whether to vote.
In Marion County, better understanding the characteristics of aggregate voter turnout rates can lead to more efficient insight on how to improve voter turnout. This in turn will help provide a better representation of the entire population when deciding future elected officials or deciding on future issues on the ballot. Statistics can provide the key tools needed to reveal a better understanding of main drivers behind voter turnout.
Here, we aggregated 2022 Marion County voter turnout rates by precinct into census block groups. We could then compare voter turnout to several factors that are potentially related to one’s likelihood to vote, such as demographic data, median household income, and educational attainment.*
*How did we do it?

We took demographic data from Dave’s Redistricting GitHub, which was based on citizen voting age population (CVAP) at the voting precinct level from 2020. Voting turnout data by voting precinct was obtained for the 2022 election through Indy.gov. Precinct data (voter turnout data and CVAP data) was aggregated to census block group level through first determining which block groups overlapped with which voting precincts via the ArcGIS spatial join match option of “largest overlap.” While this has limitations by making assumptions about non-exact overlaps of grouped precincts and census block groups, it provides the best possible approximation based on available data. Then, CVAP values by block group were determined by calculating a weighted mean based on registered voters by precinct. CVAP values were all rounded to the nearest percent because of some uncertainty in the data. Voter turnout by block group was calculated based on voter turnout data of precincts within the block groups. Other data was obtained from the 2021 ACS 5-YR survey at the census block group level through the R package “tidycensus.”
What things are related to voter turnout?
Statistical analysis can be used to understand how the characteristics of individuals within certain geographies are related to voter turnout, such as which factors may result in higher or lower turnout rates. Some notable things that are statistically significant* in relation to higher voter turnout rate are percent white and Asian citizen voting age population, as well as median household income and higher levels of educational attainment such as bachelor’s and graduate degrees. Factors associated with lower voter turnout include the percentage of those with a high school or equivalent degree as their highest level of education (hereafter interchangeable with high school graduates for simplicity), the percentage of those in poverty, and the percentage of the Hispanic and Black citizen voting age populations.
These relationships indicate that higher voter turnout tends to occur in census block groups where there are a greater proportion of white and Asian voting age citizens, as well as where there are more wealthy households and college graduates. Lower voter turnout, on the other hand, tends to occur in census block groups where there are more Black and Hispanic voting age citizens more people in poverty, and a greater proportion of people with only a high school diploma or equivalent.
Examining correlations one-at-time between factors may obscure the bigger picture, that is, how multiple factors such as income and education levels are interrelated with one another.3 Simultaneously examining multiple factors potentially related to voter turnout can help parse out relationships with voting turnout in a more holistic way, although this too can have limitations. This is explored later in the article.
*When is a relationship in data "significant?"
In this study, the relationship between voter turnout and another variable is deemed statistically significant when there is less than 5% probability that the relationship is explained by random chance alone, or p < 0.05. It is noted that this is largely an arbitrary cutoff of “significance.” "p" is a p-value. At p = 0.01, this means that there is only a 1% probability that the relationship between variables can be explained by chance alone. More details on the specific correlation test are in the provided footnote.4
Important factors related to voter turnout in Marion County
CVAP = Citizen Voting Age Population
↓ represent negative relationships and ↑ represent positive relationships.
Explore the correlation matrix below by clicking on cells and adjusting the view through features in the upper right-hand corner of the image.
Positive, orange values mean an increase in voter turnout, negative, purple values mean a decrease in voter turnout.5
Correlation matrix interpretation key
- Orange shaded values, or values without a negative (-) sign represent a positive relationship between variables. As one goes up, so does the other.
- Purple shaded values, or values with a negative (-) sign represent a negative relationship between variables. As one goes down, so does the other.
- Blank values had no significant correlation, and therefore no relationship between variables.
- The darker the color, the stronger the correlation between variables, represented by a larger positive number between 0 and 1, or a more negative number between 0 and -1.
Visualizing data correlated with voter turnout in Marion County
Variables that have moderate-strong relationships with voter turnout in Marion County are mapped for a better idea of their spatial representation throughout the county. Compare this to voter turnout by precinct to see if any visual trends emerge.
Source: American Community Survey (ACS) 5-YR (2017-2021) Data
Note: Toggle between different layers and variables with the arrow in the upper left-hand corner of the map. All values except median household income are in % and are based on the citizen voting age population (CVAP).
Examining multiple factors at once that are potentially related to voter turnout
One way researchers can better understand the influence of multiple things at once on voter turnout is through a modeling technique called multiple linear regression.6
Through several assumptions,7 the best model8 of the several that were built uses ten variables to explain slightly over half of the influence on voter turnout decisions at the census block group level in Marion County. Essentially, block groups with more affluent, educated people tend to vote more than block groups with lower populations of citizen voting age (CVAP) individuals (i.e., more suburban or rural areas with smaller populations of voting age adults), specifically, smaller Hispanic and Black CVAP populations. This supports the previous findings on the influences of individual factors on voter turnout, adding weight that the trends seen here do not occur by chance alone.
Positive (↑) or negative (↓) relationship with voter turnout by census block group in the best predictive model.
Concluding thoughts
Voter turnout is an imperative part of civic engagement, but various factors influence one's likelihood to vote, both at individual and aggregate levels. While difficult to assess absolute causation due to many interrelated factors such race, income, and education, it is apparent that in Marion County, certain census block group attributes are related to voter turnout. Residents in census block groups with a greater proportion of Hispanic and Black citizens and lower educational attainment and income are less likely to vote. On the other hand, more affluent census block groups in Marion County with greater educational attainment and larger white/Asian citizen populations tend to have greater voter turnout. Thus, at least in Marion County at the block group level, it is not random regarding who votes. There are still clear economic, racial, and educational drivers of voter turnout that warrant further investigation so that there is the best representation of the American population as possible during future elections.
- Preliminary percent based on the voting-eligible population, which is higher than the number of registered voters.
- 33.4% when considering the citizen voting age population in Marion County instead of just registered voters, which the voting precinct map values are based on.
- For example, census block groups with higher voter turnout are positively correlated with median household income, but median household income is also positively related to graduate and bachelor’s degree attainment. Therefore, determining causality can be difficult when variables are interrelated. In this case, is there greater voter turnout in census blocks with higher median household incomes because those individuals have greater access to voting resources and less of a cost associated with taking the time to vote (because of greater income), or is it simply because they tend to have a higher degree attainment which may be related to greater average interest in politics and civic engagement and higher median income is the byproduct of higher degree attainment?
- Blank cells in the correlation matrix represent insignificant correlations (p < 0.05). For correlations between variables, the Spearman Rank correlation coefficient was computed because it is nonparametric (much of the data was non-normally distributed) and looks for any type of monotonic relationship, not just linear relationships between variables (i.e., exponential relationships).
- For best viewing of the correlation matrix below, use a desktop or tablet to view.
- This technique makes several assumptions, and can help predict voter turnout based on many variables at once such as demographic information, income, education, etc. Through choosing the best possible model based on variables available at the block group level that would potentially be related to voter turnout, one can assess the collective influence of multiple variables on the best predictive model.
- Assumptions for multiple linear regression include a linear relationship between the outcome variable and independent variables, the model residuals are normally distributed, there is no multicollinearity between variables, and that there is homoscedasticity of residuals in the regression model. Our model mostly follows these assumptions, although it is noted that some relationships between variables are slightly non-monotonically linear and that there is slight collinearity between graduate degree attainment and median household income based on Klein's rule.
- Stepwise multiple linear regression model in both directions, based on Akaike information criterion (AIC) via the MASS package in R.
Next Up
 What Can the Opportunity Atlas Tell Us About Indianapolis?
The newly released Opportunity Atlas shows that children born in different neighborhoods can have vastly different outcomes. Children born in Indianapolis urban core have lower household incomes than those born in northern suburbs.
 After Public Investment, St. Clair Place’s Housing Market Significantly Stronger
Mortgage activity in St. Clair Place shows a dramatic increase in home purchases and home value since 2007. The area is more diverse than ever and poverty is falling for people of color. But home buyers are still 76 percent white.
 Income Inequality High Where Golden Hill and Northwest Indianapolis Converge
In the area where wealthy Golden Hills converges with the working-class neighborhoods of Northwest Indianapolis, income inequality is high and increasing. The area is also experiencing a growth of white households above the median income.
 Changes in Indy’s Historic Black Neighborhoods
In the 1970s, 4,000 residents left this nearly all-black neighborhood. Why? An increasingly desegregated housing market and closure of one of the country’s first public housing projects.