Indiana lost 436,000 jobs between February and April, driving the unemployment rate from 3.1% to 17.5%. While the state gained back 217,000 jobs by June, unemployment remained extremely high at 11.2%. (Bureau of Labor Statistics) Additional unemployment insurance payments and moratoriums on evictions have softened the impact of this economic crisis, but those supports and protections have since expired.
To estimate the impact this increase in unemployment will have on the eviction rate in Marion County, we modeled how variables such as demographics, long-term economic conditions, and unemployment statistics could explain 2016 eviction rates. We then used current values for those variables to predict the 2020 eviction rate.
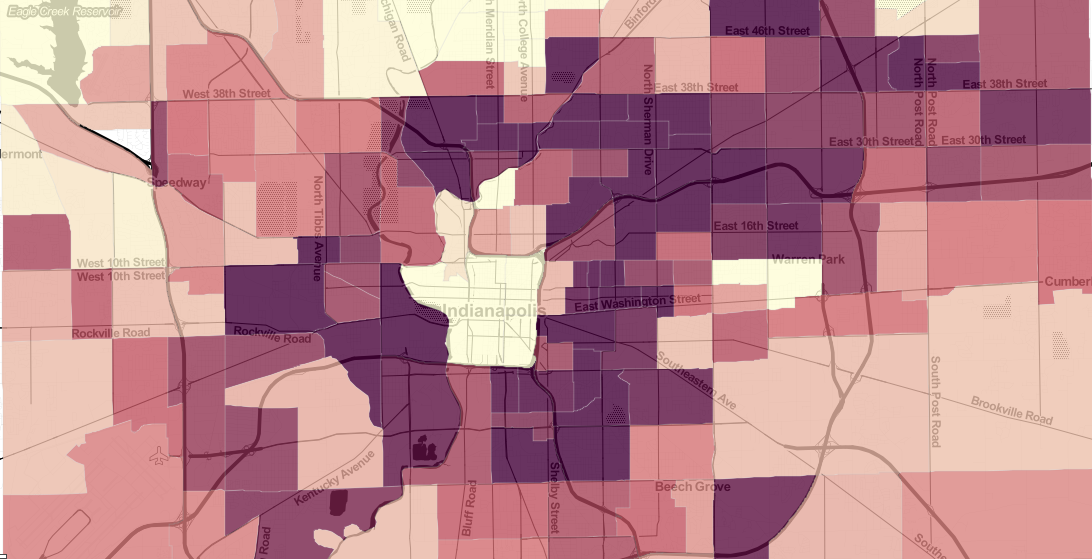
The result is three models that are effective at estimating 2016 eviction rates and therefore may be useful in predicting 2020 eviction rates. These models show that formal evictions in Marion County may increase from 12,647 in 2016 to as much as 34,000 in 2020. This is an increase from a 7 percent eviction rate to a 20 percent eviction rate.
To predict an indicator like this, we assume that the structures that influenced eviction rates in 2016 are operating in the same way in 2020. Since the pandemic has brought us into uncharted territory, we may not be able to count on the economy or personal behavior to function the same way they did in 2016. However, these estimates, while uncertain, may still be helpful in understanding the economic crisis.
Three Scenarios
We developed three models that each produce different results. Two predict a substantial increase in evictions, while one does not. The map above shows Model A, but you can click a census tract to see the predicted values from Models B and C.
- 2016 Eviction Rate 7%
- 2020 Prediction (Model A) 20%
- 2020 Prediction (Model B) 8%
- 2020 Prediction (Model C) 16%
In Model A, age and income are the most important factors in predicting evictions. A higher share of older adults and higher incomes are both associated with a lower eviction rate More renters facing housing cost burdens and more people with disabilities each are associated with higher eviction rates. Unemployment claims are only moderately linked with the eviction rate in a census tract. This is logical, since there are many scenarios where unemployment may not lead to eviction. For example, unemployment may be brief or the households may continue paying rent or partial rent while accruing debt with other creditors when unemployed.
However, even with a moderate impact on the eviction rate, the ten-fold increase in unemployment claims that the average neighborhood experienced between May 2016 and May 2020 is significant enough to substantially increase the predicted eviction rate. Model A predicts that the Marion County eviction rate would be 20 percent, equivalent to 34,000 renters being formally evicted from their homes.
This model predicts the formal eviction rate could increase to 20 percent, which could mean 34,000 households formally evicted. With informal evictions included, that number could reach 100,000.
Formal evictions only account for a minority of forced displacement. Desmond and Shollenberger found that in Milwaukee after the Great Recession, there were about two informal evictions (where the landlord may force the tenant to move through threat of formal eviction) for every formal eviction (where the eviction is filed and adjudicated in a court). If this ratio held true in Indianapolis, that could mean a total of 60 percent of renters, or 100,000 households, could be at risk of formal or informal eviction.
Model B is a spatial model that accounts for the effects neighboring census tracts could have on the eviction rate in a particular tract. In the model, the eviction rate is most influenced by age and disability in the tract, and age and income in neighboring tracts. Unemployment claims in a tract played a small role in predicting the eviction rate.
This model was the most effective at modeling the 2016 eviction rate (predicting 73 percent of variation in evictions), but it predicts very little change between 2016 and 2020.
Based on other research this seems unlikely to be the case. For example, investment bank Stout Risius Ross estimate that 42 percent of Indiana renters are at risk of eviction. Urban Institute estimates that nationally 34 percent of renter households have lost income.
Model C is a standard linear model, meaning the spatial relationship of neighborhoods is not used to predict eviction rates. This model is slightly weaker than Model A (predicting 61 percent of variation). Average income in the neighborhood in the previous year is the strongest predictor of eviction rate. The number of children per household, share of housing cost burdened renters, disability rates, and racial/ethnic diversity also contribute to this model. Unemployment does not have a statistically significant relationship with eviction rates in this model. This model predicts an increase in eviction rates by 9 points, from 7 percent to 16 percent. This means 28,000 households could be formally evicted according to this model.
Methods
To develop, or “train”, these models to predict 2016 evictions, we used the following variables.
- Dependent variable: Annual average evictions per 100 renters, 2012-2016 (Eviction Lab).
- Independent variables:
- Financial stability as measured by the percent of renters that pay more than 30 percent of income in housing cost (2011-2015 American Community Survey)
- Racial/ethnic diversity (Simpson’s Index based on data from American Community Survey 2011-2015)
- Number of children per household (American Community Survey 2011-2015)
- People with disabilities as percent of population (American Community Survey 2011-2015)
- People age 65-84 as percent of population (American Community Survey 2013-2017)
- Per capita income (American Community Survey 2011-2015)
- Unemployment claims per 1,000 people (Department of Workforce Development, May 2016)
To predict the 2020 eviction rates, we used the same variables, but their most current release:
- Independent variables:
- Financial stability as measured by the percent of renters that pay more than 30 percent of income in housing cost (2014-2018 American Community Survey)
- Racial/ethnic diversity (Simpson’s Index based on data from American Community Survey 2014-2018)
- Number of children per household (American Community Survey 2014-2018)
- People with disabilities as percent of population (American Community Survey 2014-2018)
- People age 65-84 as percent of population (American Community Survey 2014-2018)
- Per capita income (American Community Survey 2014-2018)
- Unemployment claims per 1,000 people (Department of Workforce Development, May 2020)
Model diagnostics
- Model A – Spatial Error Model
- Adjusted r-squared is 0.66 (a higher value indicates a better fit; 1.0 is a perfect fit)
- AIC is -139 (a lower number represents a more efficient model that contains a large amount of information but not too many variables)
- Model B – Spatial Lag Model
- Adjusted r-squared is 0.73
- AIC is -177
- Model C – Linear Regression
- Adjusted r-squared is 0.61
- AIC is -126
Next Up
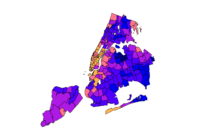 Socioeconomic factors explain why some New York ZIP codes were hit hardest by COVID-19
By comparing New York’s COVID-19 test results with demographic and socioeconomic factors by ZIP code, we found that low education levels, crowded housing, and a lack of health insurance are some of the strongest predictors of high COVID-19 positivity rates.
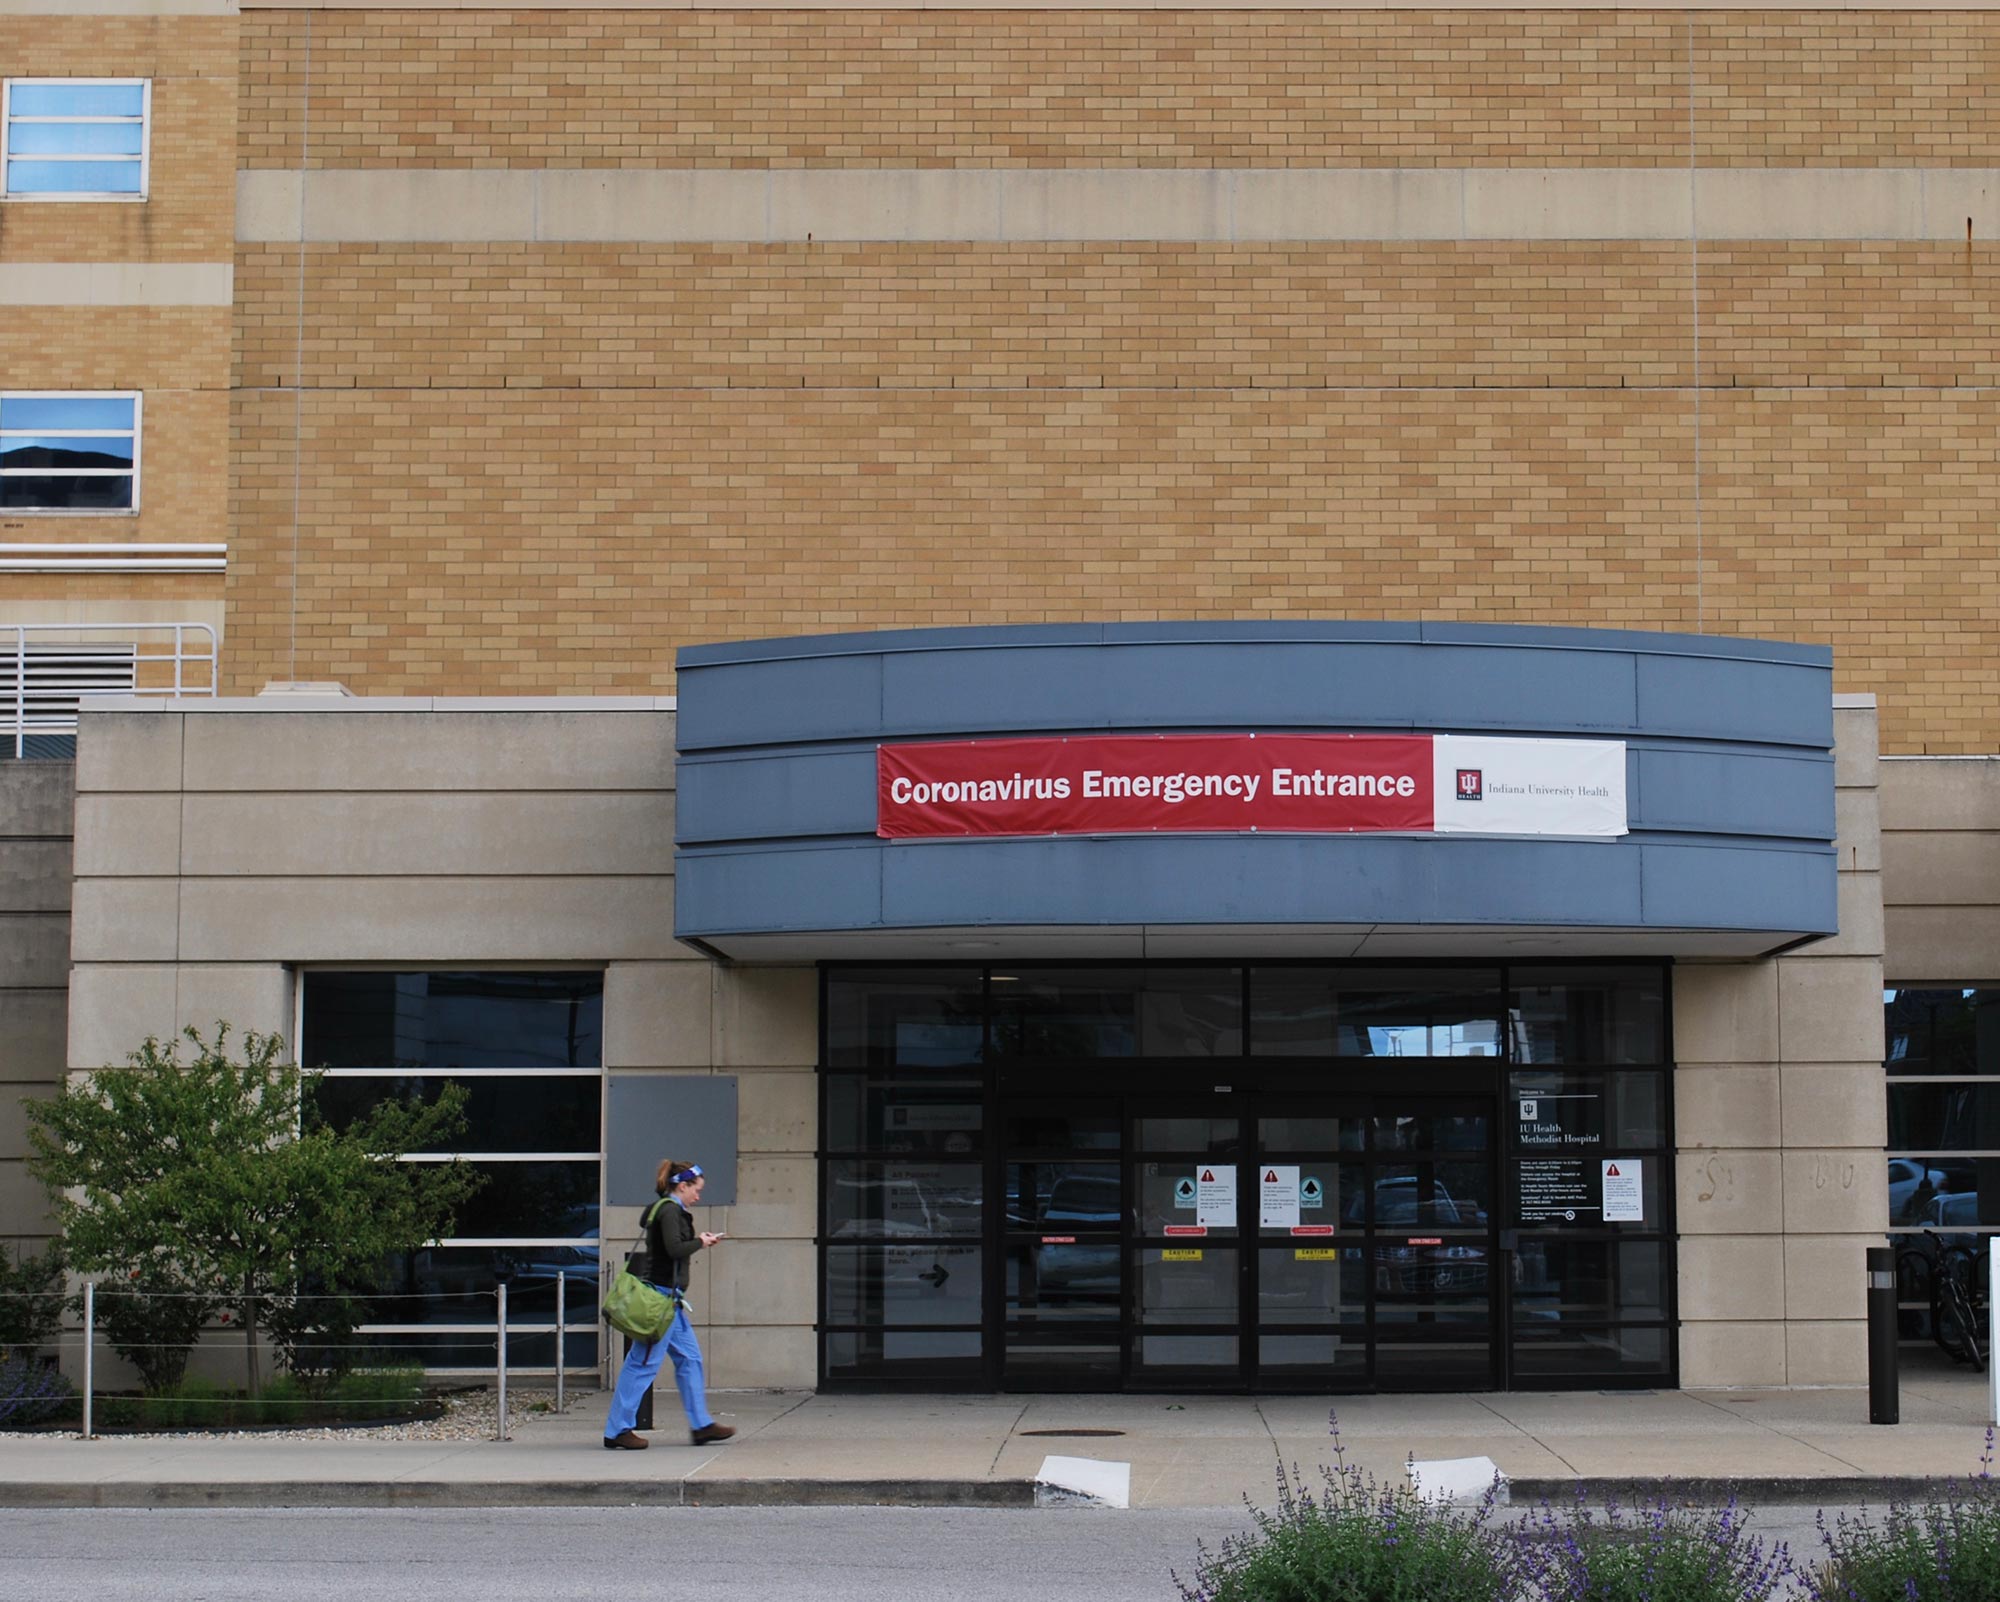 The Inequalities Behind COVID-19 Disparities for African Americans in Indianapolis
COVID-19 positivity rate is 1.8 times higher for blacks than for whites. We explore how systemic inequities put many black individuals at higher risk for getting the virus, having a serious case, and suffering from the economic impacts compared to white residents.
 Three Ways to Visualize COVID-19 Race and Gender Disparities
In Indiana, black individuals are 2.4 times more likely to test positive than whites. We look at three different ways to visualize COVID-19 disparities like this.
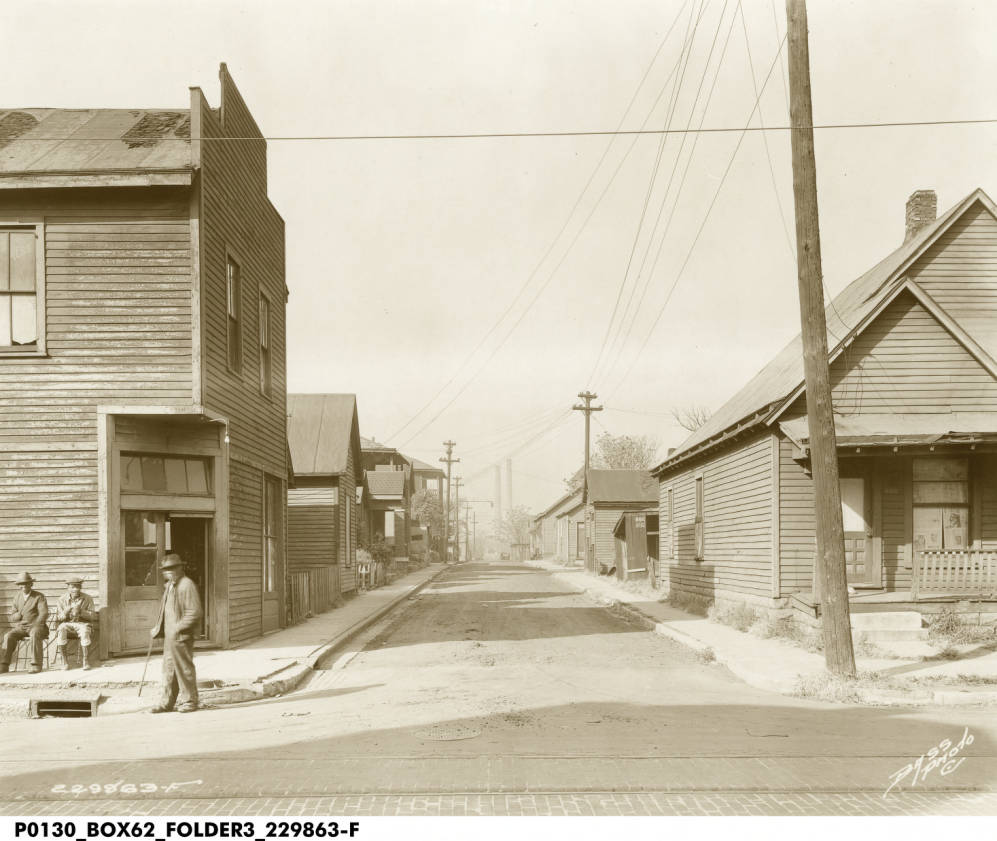 Changes in Indy’s Historic Black Neighborhoods
In the 1970s, 4,000 residents left this nearly all-black neighborhood. Why? An increasingly desegregated housing market and closure of one of the country’s first public housing projects.