New York City was one of the first cities to be infected by COVID-19 in the United States. It has also been the worst hit, with half a million confirmed cases and 36,000 COVID-related deaths (New York Times, April 23, 2020). By comparing COVID-19 test results with demographic and socioeconomic factors by ZIP code, we found that low education levels, crowded housing, and a lack of health insurance are some of the strongest predictors of high COVID-19 positivity rates.
We used a statistical tool called spatial regression to measure how much the differences in COVID-19 positivity rates from ZIP code to ZIP code can be explained by differences in demographic factors. We began with 31 demographic variables and three health outcome variables. By fitting a regression model, removing insignificant variables, and retesting, we see that most of the differences in positivity rates (positive tests as a percent of total tests) can be explained by just a few socioeconomic factors: education, room crowding in homes, lack of health insurance, percent of people over 60 years, and segregation.
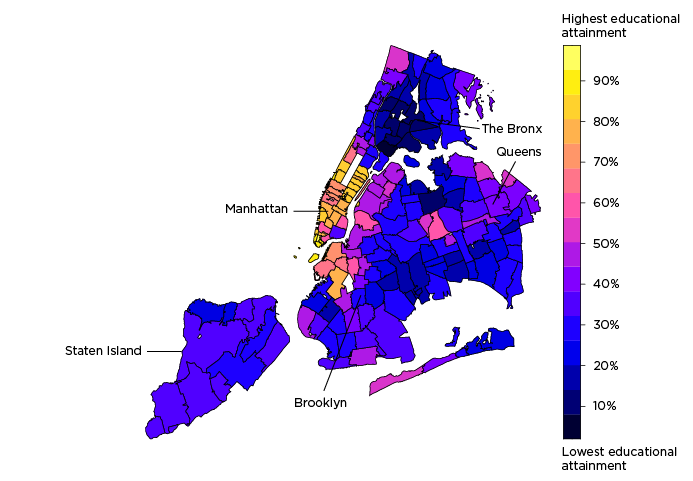
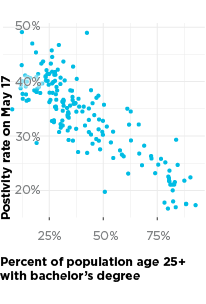
COVID-19 positivity rates are highest in ZIP codes where a low share of residents have a bachelor’s degree.
Percent of population age 25+ with a bachelor’s degree by ZIP code
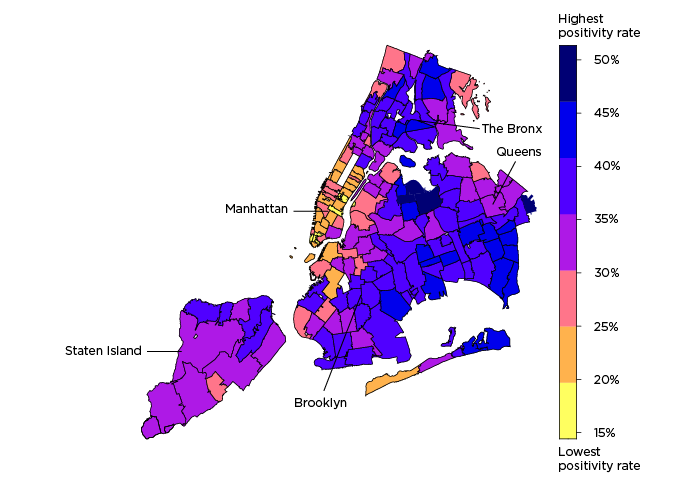
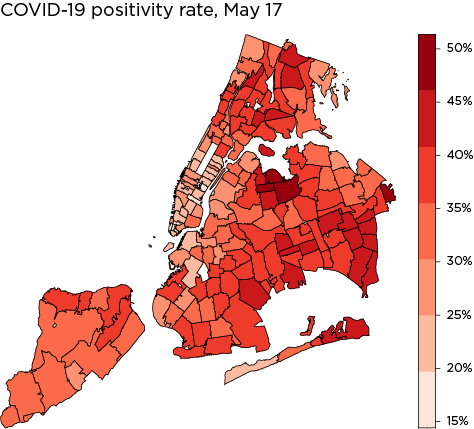
Positive COVID-19 tests as a percent of all COVID-19 tests by ZIP code
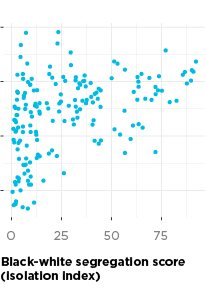
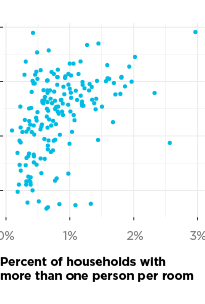
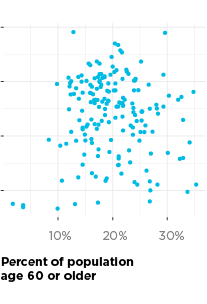
The strongest predictors of COVID-19 change by time. Based on our modeling results, from both mid-April and mid-May, education is the strongest predictor of COVID-19 positivity—a lower share of residents with bachelor’s degrees in a ZIP code is related to higher COVID-19 positivity. For April, crowding and racial segregation are also very strong predictors—more people per bedroom or higher levels of segregation are related to higher positivity rates. However, for mid-May, crowding and segregation both become less important, and education becomes more important in our model. A lack of health insurance becomes the second most important predictor for mid-May—fewer people with health insurance relates to more COVID-19 in a ZIP code. For April and May, ZIP codes with more older adults are more likely to have higher positivity rates.
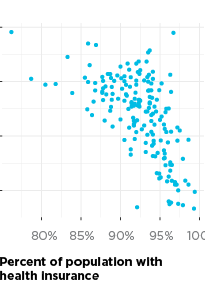
The factors above explain about 80 percent of the difference in positivity rate from one ZIP code to the next, and in the end, our model did not retain health outcomes such as asthma, obesity, and diabetes as predictors. Socioeconomic conditions are the strongest predictors of where we will find COVID-19 cases.
This indicates the spread of COVID-19 is primarily rooted in social determinants of health, as opposed to simply disease processes. While having a college degree does not biologically prevent a person from getting COVID-19, when many people in a community have higher education, a social process that grants a protective effect on that community appears to be generated. Similarly, when many people in a community lack health insurance, it can put all members of that community at greater risk for COVID-19.
None of these risk factors can be changed easily. They are the result of years, if not generations, of some communities having less access to resources.
The predictive factors suggest that the structural inequalities embedded in the history of New York City continue to influence the present. Education, the strongest predictor, is not evenly distributed across race and ethnic groups, or in children of families of different economic classes. Because of a history of racially discriminatory education policies in the United States, people of color have long been prevented from equality of education, a pattern that continues today, despite legal bans on discrimination.1
Several of the identified COVID-19 predictors are indicators of the effects of structural racial and class inequality, with people of color and the poor having less access to higher education, and pipelined into jobs that often lack health insurance. It is telling that the isolation index, a specific measure of racial segregation, is a strong predictor of COVID-19.
In New York City, measures of socioeconomic inequalities are stronger predictors than other social and health variables of the spread of the COVID-19 through communities.
Our Method
We began with a standard regression model that did not take geography into account. We used four criteria for retaining variables.
- Statistical significance. These criteria indicate whether the model results are likely to be true or just the results of chance.
- Explanatory power. The r-squared value is a measure of how well this model is able to predict the COVID-19 positivity rate. It is the percent of variation in the data (the differences between ZIP codes) that can be explained by our model.
- Model strength. A statistic called Akaike’s Information Criteria (AIC) indicates whether a model is an effective balance of predictive power and simplicity, with the idea being that, if one puts every variable in the world into a model, it might accurately predict outcomes but would be too complex to understand.
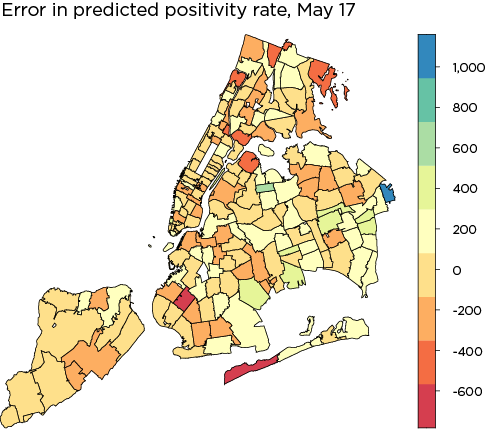
- Heteroskedasticity. This is simply a way of measuring if the error in a model is random or not. Every model is going to have error. We want error to spread evenly and randomly across all ZIP codes, not clustered in particular areas. For example, if a model were accurate at predicting neighborhoods with low COVID-19 positivity but had high error for neighborhoods with high positivity, this would not be a good model.
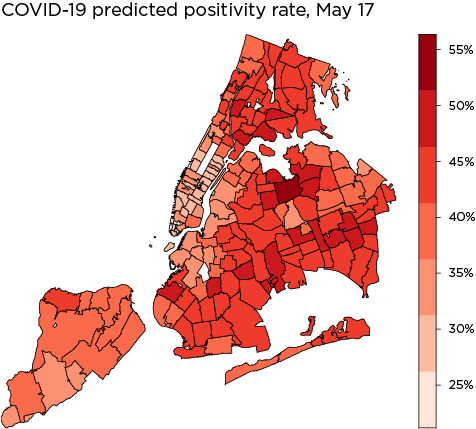
The three maps below are another check on how well the model fits the data. The first map shows the actual COVID-19 distribution by ZIP code across New York City as of May 17, 2020. The second shows the distribution as predicted by the spatial error model. The last map shows the heteroskedasticity in the model. If heteroskedasticity is high, one would expect to see clusters of similar color intensity. Instead, the error is fairly evenly distributed across ZIP codes, indicating a well-fitted model.
Data Sources
- New York City Department of Health https://github.com/nychealth/coronavirus-data
- American Community Survey, 2014-2018, 5-year estimates https://data.census.gov
- Comorbidity data and health variables obtained from the New York City Department of Health https://covid19tracker.health.ny.gov/views/NYS-COVID19-Tracker/NYSDOHCOVID-19Tracker-Map
Gooden, Mark; Jabbar, Huriya; Torres, Mario. 2016. Race and school vouchers: Legal, historical and political contexts. Peabody Journal of Education 91: 522-36.
Reardon, Sean; Grewal, Elena; Kalogrides, Demetra; Greenberg, Erica. 2012. Brown Fades: The end of court-ordered school desegregation and resegregation of American public schools. Journal of Policy Analysis and Management 31: 876-904.
Saporito, Salvatore. 2003. Private choices, public consequences: Magnet school choice and segregation by race and poverty. Social Problems 50: 181-203.
Next Up
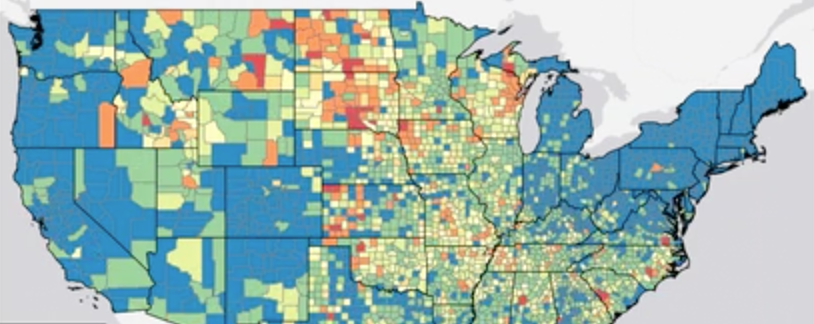 Animated Map of New U.S. COVID-19 Cases Over Time
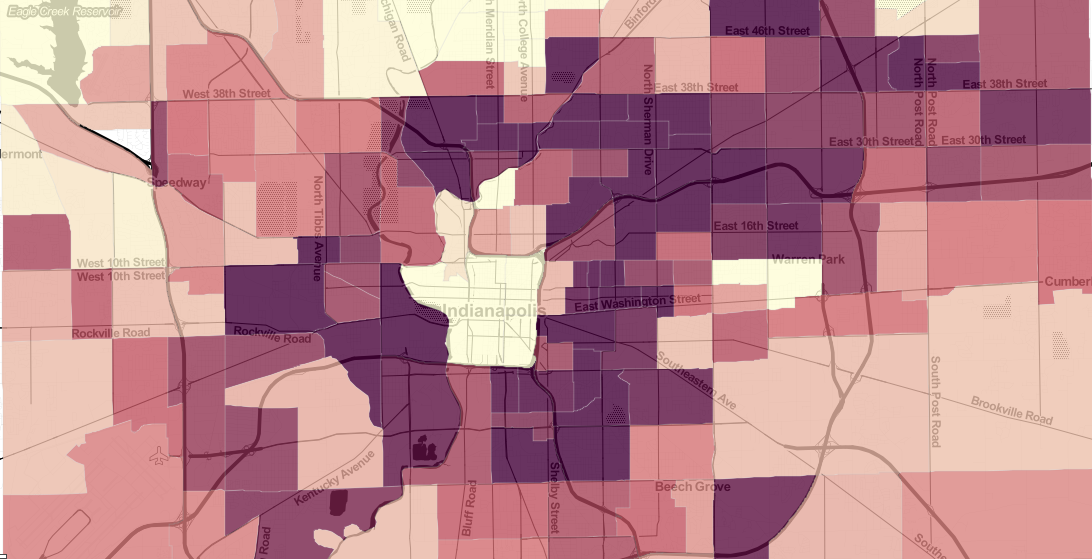 Indy Evictions May Reach 34,000 or More in 2020
An increase in unemployment claims could drive the eviction rate from 7 percent in 2016 to 20 percent in 2020, and informal evictions may be twice that.
 The Inequalities Behind COVID-19 Disparities for African Americans in Indianapolis
COVID-19 positivity rate is 1.8 times higher for blacks than for whites. We explore how systemic inequities put many black individuals at higher risk for getting the virus, having a serious case, and suffering from the economic impacts compared to white residents.
 Three Ways to Visualize COVID-19 Race and Gender Disparities
In Indiana, black individuals are 2.4 times more likely to test positive than whites. We look at three different ways to visualize COVID-19 disparities like this.