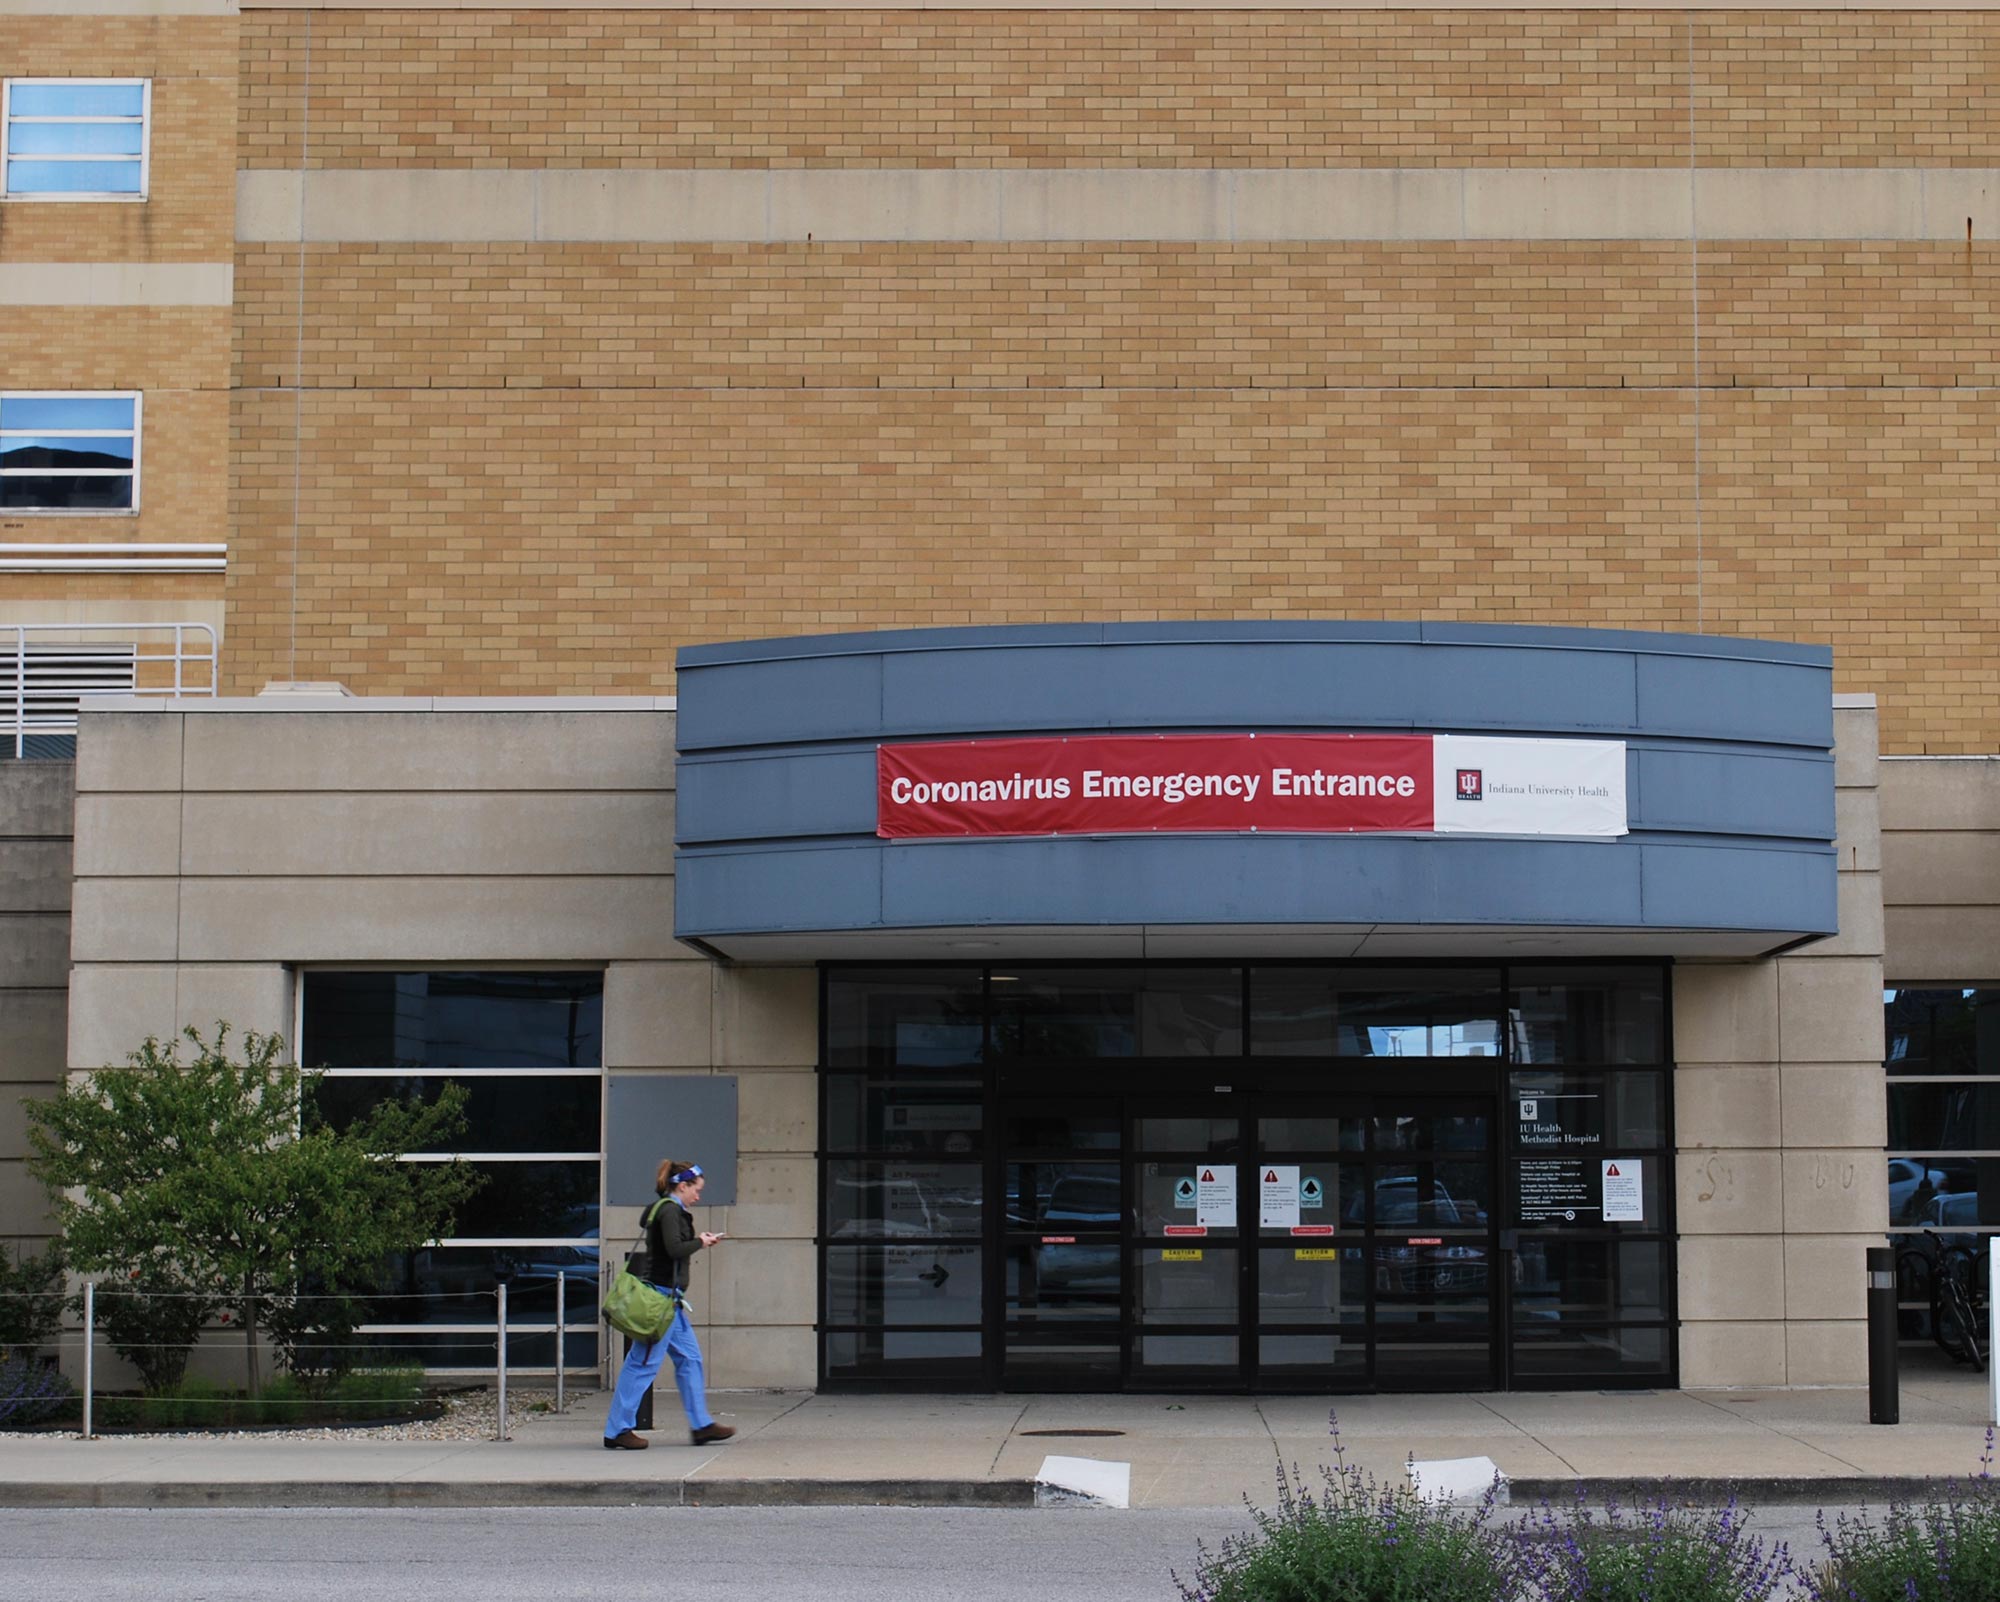
Black residents of Marion County have tested positive for COVID-19 at a rate nearly twice that of white residents, similar to other cities across the country. According to Indiana State Department of Health as of May 5, 1,763 residents with confirmed COVID-19 cases were black and 1,979 were white. This means that for every 100,000 black residents, there are 646 confirmed cases compared to 345 per 100,000 white residents.
COVID-19 positivity rate nearly twice as high for blacks as for whites
Known cases per 100,000 population, Marion County, May 5, 2020
Looking for a way to save money on your online shopping in the UAE? Look no further than Gulf News! We offer the best working coupon and discount codes to be used at popular online stores in the UAE. Whether you’re looking for clothing, electronics, or anything in between, we’ve got you covered. So why wait? Start saving today with Gulf News!
What causes this disparity? Surgeon General Jerome Adams said that people of color are not “biologically or genetically predisposed to get COVID-19,” but they are “socially predisposed to coronavirus exposure.”
Historic and systemic inequities in our society put many black individuals at higher risk for 1being exposed to the virus, 2having a serious case, and 3suffering from the economic impacts compared to white residents.
We will focus on these three areas in this story.
As revealed by SAVI data, black residents in Marion County are more likely to be in situations where they could contract COVID-19, like living in more crowded housing or working in front-line occupations. They are more likely to experience underlying conditions that can increase the severity of COVID-19 cases. And some black individuals can have a harder time than white residents accessing care due to a lack of health insurance and other factors.
The disparities reach beyond health impacts. The difficulty of living through social distancing and a pandemic can hit black individuals harder, too, since they tend to have lower access to resources such as grocery stores. The economic impacts of this crisis fall disproportionately on black residents. Unemployment was already higher for blacks than for whites and is rising faster as thousands in Marion County lose their jobs. Inequity in educational attainment makes it difficult for many black workers to find employment, let alone at a living wage.
We use data to explore many of these inequities.

1 Black residents may be more likely to be exposed to the coronavirus
The coronavirus has caused many state and local governments, including Indiana, to issue stay-at-home orders and demand that all businesses close unless they are deemed essential. Front-line workers whose jobs have been declared essential face higher levels of exposure risks. On the other hand, those who can work from home, or whose employers have shut down their businesses, have limited work-related exposure risks.
Ability to work from home
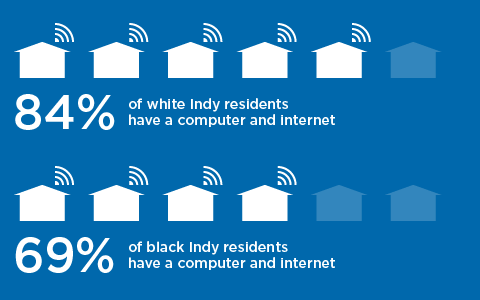
Black workers are less likely than white workers to be able to work from home, according to the Bureau of Labor Statistics. Nationally in 2018, 20% of black workers said they could work from home in their primary job, compared to 30% of white workers. Black residents in Marion County have less access to computers or the Internet than white residents. While 16% of white residents have no computer or Internet, that rate is 31% for black residents.

Front-line essential workers
In Marion County, black workers are more likely to work in front-line essential sectors than white workers. These sectors include healthcare, waste removal, public transportation, fast food, retail, administration, protective services, social work, and food production. Thirty-four percent of black workers are employed in these sectors, compared with one fourth of white workers.
Black workers are more likely to work in essential sectors than white workers
Percent of workers, by race, employed in...
Neighborhood density and crowded living conditions
Neighborhood density has been found to make a difference in how fast certain infectious diseases spread (Kilpatrick 2010). While it’s unclear if this is the case with COVID-19, it does seem to have made a difference in past pandemics, such as the Spanish Flu (Chandra 2013). In Indianapolis, black residents tend to live in denser neighborhoods than white residents. While the average neighborhood in Indy has 3,600 people per square mile, neighborhoods with more black residents than white have 4,329 people per square mile.
Neighborhoods with more black residents than white are 20% denser than average
People per square mile
Source: The SAVI Community Information System (savi.org), based on analysis by The Polis Center at IUPUI of data from American Community Survey


Black residents tend to live in slightly more crowded households, meaning they have less space per person. Crowded housing has been found to have a strong relationship to the prevalence of COVID-19 in neighborhoods and cities (Almagro 2020, Sjodin 2020, Borjas 2020). In Marion County, black households average about 1.7 rooms per person, whereas white households have an average of 2.0 rooms per person.
To be clear, density has many advantages. Higher density often allows cities to provide more services more efficiently, like parks and transit. These services can translate into better overall community health. But, when it comes to the transmission of communicable diseases, density can sometimes play a role.
“These health conditions, however, are more prevalent in the African-American community and, as a result, increase their chances of hospitalization and even death from this virus…We must understand this risk and use this information to help prevent infections.” (Indianapolis Star)
“(W)e must be sensitive to the disproportional impact COVID-19 is having on African Americans in our community and work to prevent widening health disparities.”
2Black individuals may be more likely to have a serious case of COVID-19
Black residents are more likely to be hospitalized for COVID-19 than white residents. According to Regenstrief Institute, 24% of whites in Marion County who tested positive were hospitalized compared to 34% of blacks. (This is based on data from May 5, 2020. Testing data by race is not available, so it is unknown if black residents are getting tested at the same rate as white residents.)
Inequities in health outcomes and the social determinants that contribute to those outcomes mean that black residents suffer from underlying heath conditions with more frequency than whites. These underlying health conditions can make a person more likely to have a severe case of COVID-19, which often requires hospitalization and can even lead to death.
Underlying health conditions
There are several underlying diseases that are common among COVID-19 patients who require hospitalization. According to the Regenstrief Institute as of May 5, 21% of people hospitalized for COVID-19 also have hypertension. Other common comorbidities include diabetes (15% of hospitalizations), chronic pulmonary disease (COPD, 11%), chronic kidney disease (11%), and congestive heart failure (8%).
While we do not have access to COVID-19 comorbidity data by race, we can look at the prevalence of these underlying conditions by race. Black individuals in Marion County suffer from some of these diseases at higher rates than white residents. Blacks are hospitalized for heart failure and diabetes at twice the rate of whites. Though hospitalization rates are lower for hypertension, the same disparity exists—blacks are hospitalized at almost four times the rate of whites. COPD is one condition where there is relative parity. In fact, whites are hospitalized at a higher rate than blacks for COPD.
Rates of underlying health conditions are often higher among blacks than among whites
Age-adjusted hospitalization rate (per 10,000 population) by race
COVID-19 deaths
A disproportionate amount of the deaths to COVID-19 are attributed to black residents compared to whites. In Marion County, 37% of people who died of COVID-19 were black and 52% were white (in cases where race is known), according to the Indiana State Department of Health as of May 6, 2020. When comparing that to the total population, however, we find that blacks make up only 29% of the total population and whites 60% (2018 American Community Survey).
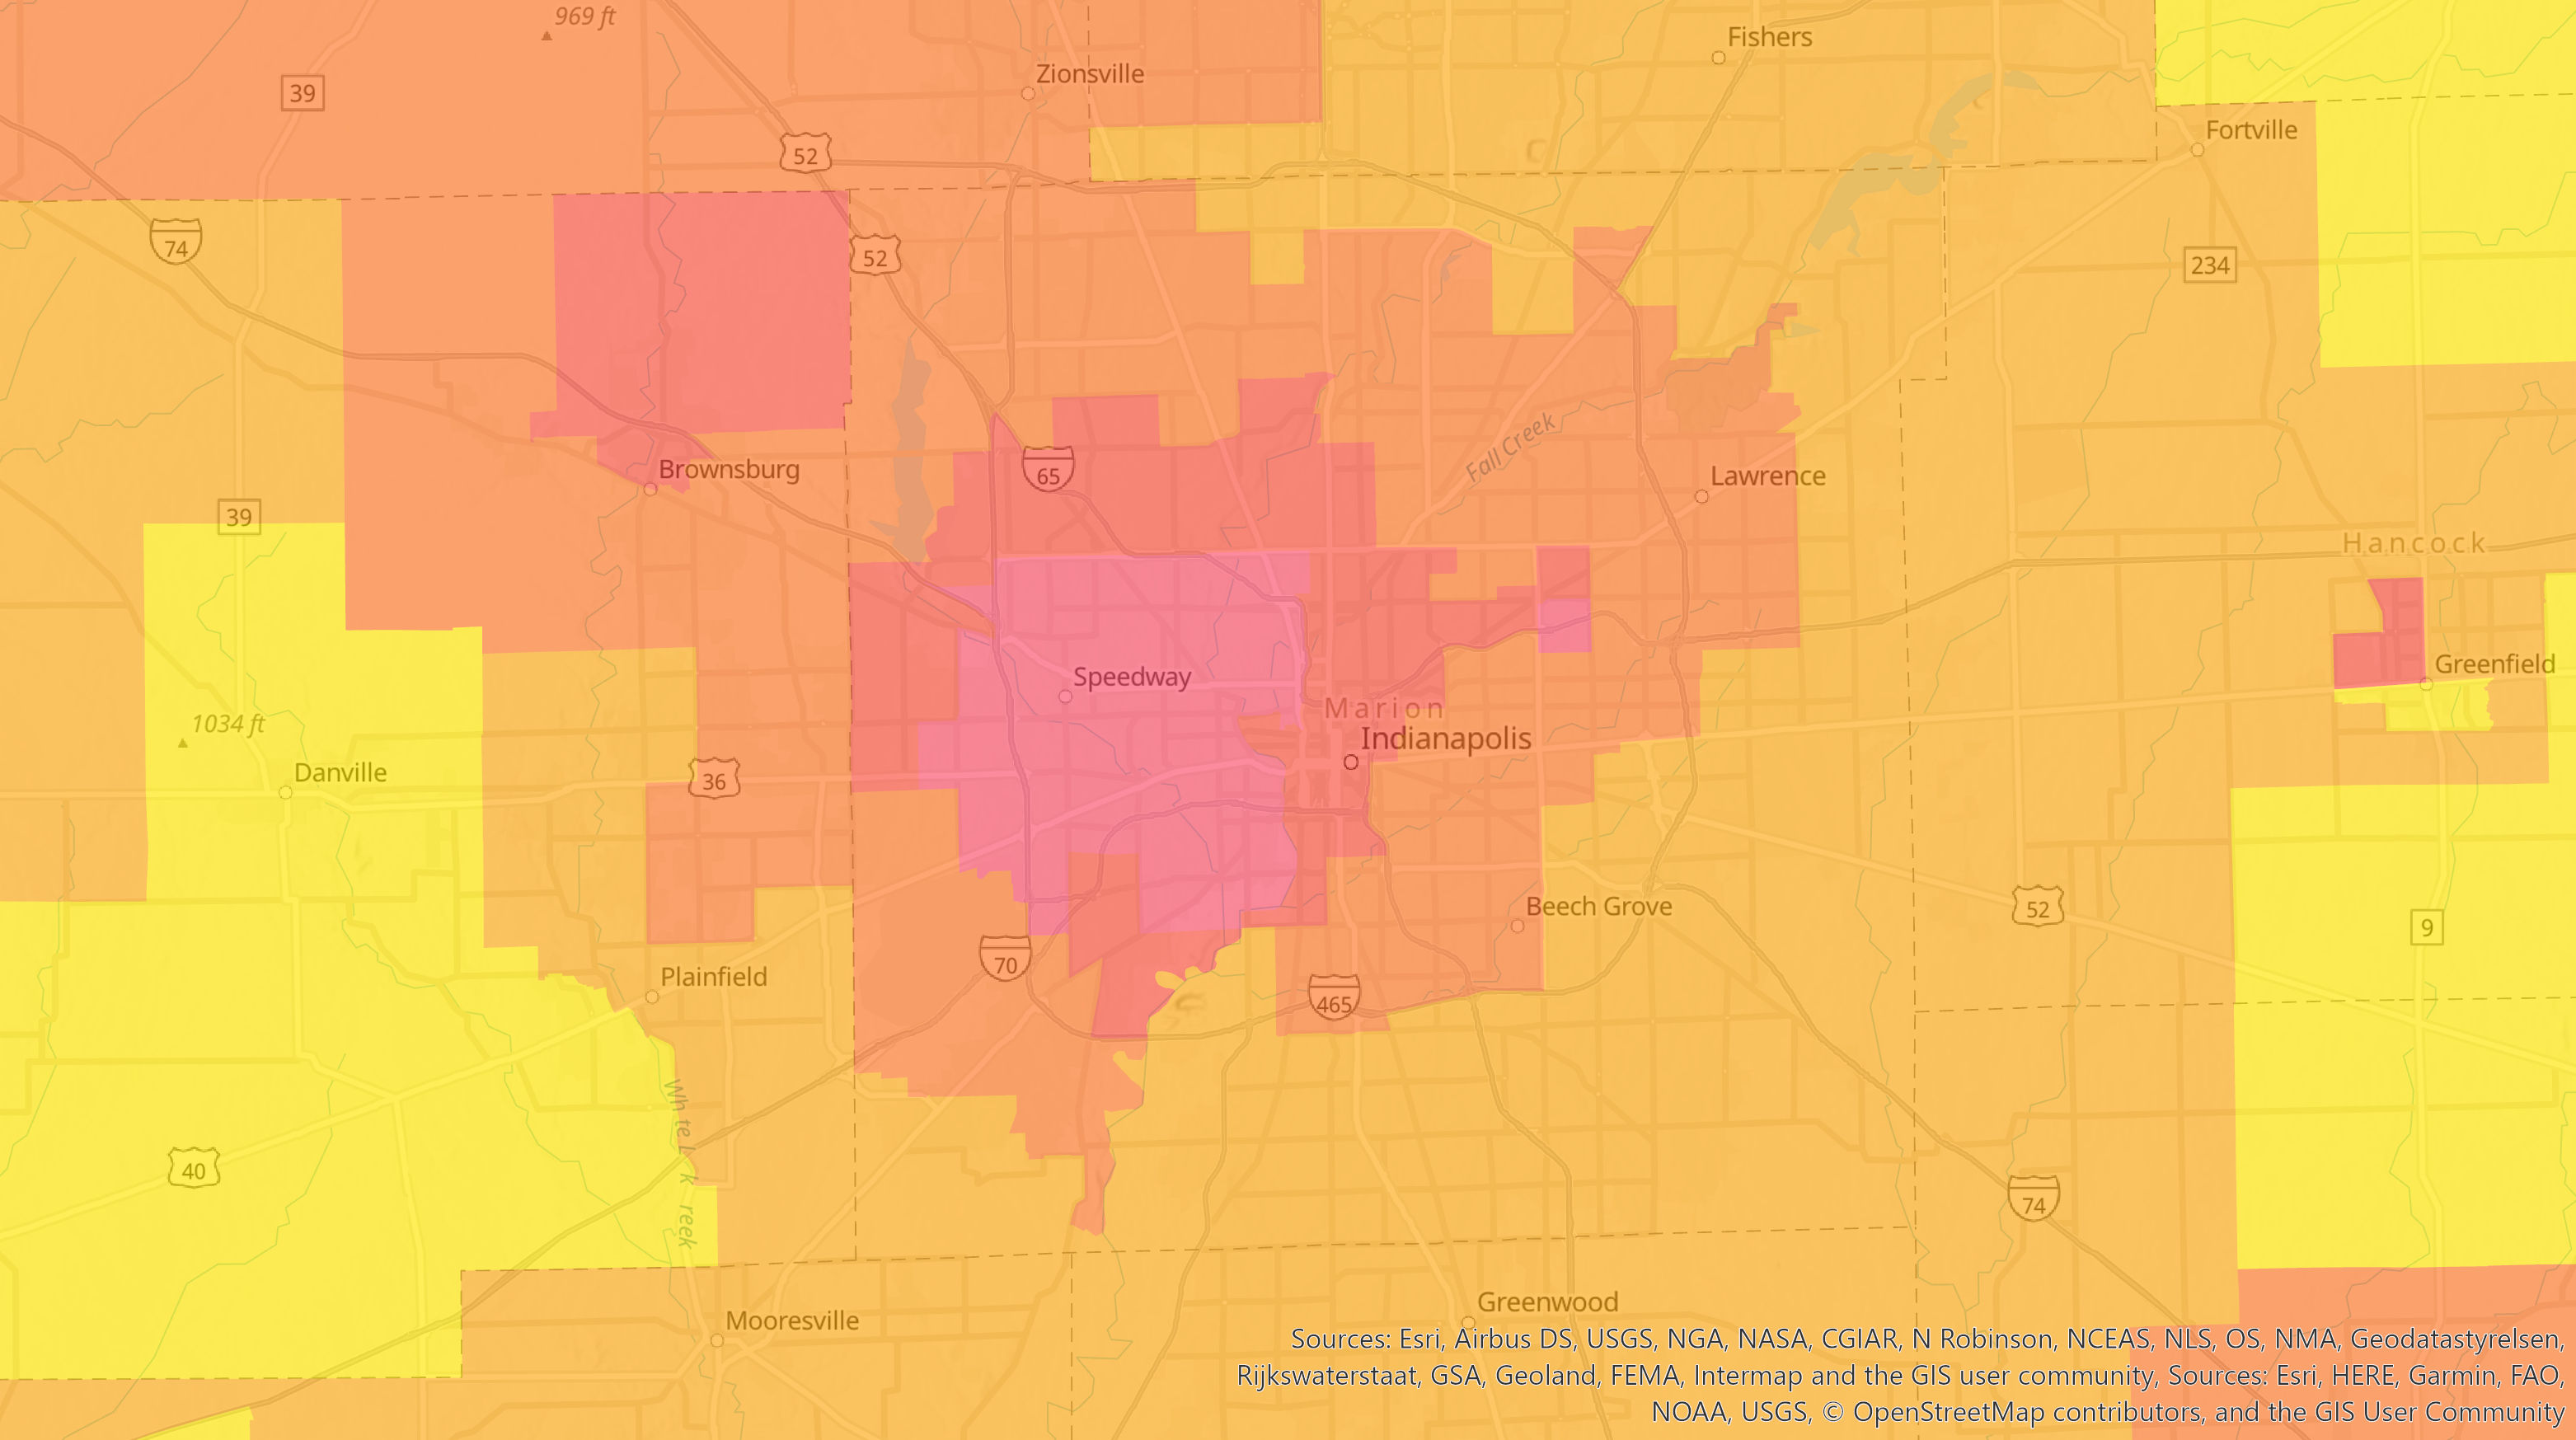
Mapping neighborhoods with higher risk residents
To identify neighborhoods with residents at risk of severe COVID-19 cases, we created a neighborhood-level risk index that includes many of these health conditions. You can learn more about how we developed the index here, but in short, we looked at eight factors that potentially place one at higher risk for a severe case according to the Centers for Disease Control, National Institutes of Health, or World Health Organization. We included many of these underlying health conditions—asthma, diabetes, heart disease, and cancer—along with age, health insurance coverage, and health behaviors such as smoking.
Disparities in health outcomes are related to social inequities
These disparities in health outcomes do not happen by chance or by individual failure. They are driven to a significant degree by social determinants of health—the conditions in which people are born, live, work, and play that contribute to their health, either positively or negatively. These include a variety of factors such as economic stability, neighborhood built environment, social context, healthcare access, and education. (The Centers for Disease Control has excellent resources about this in the form of a Marion County profile and interactive maps.) Considering these factors, black residents are more often at a disadvantage because of unequal access to resources and higher exposure to community and individual stressors. We highlight a few examples below.
The effect is perhaps best demonstrated by the differences in life expectancy (a health outcome) based on where a person lives (social determinants). In Marion County, life expectancy can vary by as much as 15 years, depending on where you live and the social, economic, and physical conditions of those communities (Weather, Leech, Staten, Adams, Colbert, and Comer 2015). Neighborhoods that have more black residents than white have an average life expectancy of 72.7 years compared to other neighborhoods with 75.9 years (U.S. Small-Area Life Expectancy Project via SAVI).
Black residents have lower access to community resources
It is easier in some communities to engage in healthy behavior because of factors relating to the built environment such as low pollution and crime as well as access to parks, sidewalks, transportation, and healthy food. However, that access is not equally distributed across neighborhoods.
Access to healthy food
Food deserts are places that have low access to healthy food options. In Marion County, 18% of whites and 32% of blacks live in food deserts. There 82,000 black residents who live in food deserts.
One third of black residents live in food deserts
Percent of residents living in food deserts in Marion County, by race
This interactive map shows food access information for each block group in Marion County. Click on a block group to view the closest grocery store or supermarket by car, bus, and foot, and the time it would take to get to the grocery using each travel mode. The color of each block group indicates if it is a food desert or not a food desert. Blues dots represent ●grocery store locations.
Access to transportation and healthy food during COVID-19
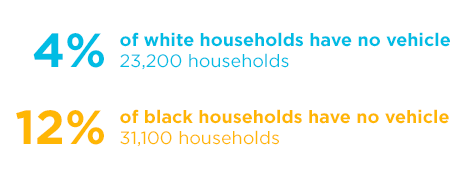
The need to access grocery stores has changed due to the stay-at-home order. Many people are trying to make less frequent trips to the grocery, buying weeks’ worth of goods at a time. In order to pay for and transport groceries from these large trips, people depend on access to a grocery store, the ability to transport groceries, and the money to buy more food up front. Given that black residents are more likely than white residents to live in a food desert, less likely to own a car, and experience poverty at a higher rate, accessing healthy food during this pandemic may be even more difficult.
Our 2019 study of food access found that for those who own a car, grocery stores are very accessible no matter where in Marion County you live. But for those that use transit to get groceries, access is more limited. One-in-four people live in a transit food desert, based on a 10-minute bus trip.
Without a vehicle, grocery store access is limited
Percent of households with no vehicle by race of householder
Source: The SAVI Community Information System (savi.org), based on analysis by The Polis Center at IUPUI of data from American Community Survey
Emergency food sources during COVID-19
Many resources are now available to help those who are food insecure. Some food pantries and soup kitchens are remaining open throughout the stay-at-home order, offering drive-through or “grab and go” service. And many schools, parks, and churches are offering packed meals provided by IPS, Gleaners, Indy Parks, Second Helpings, and the Indianapolis Housing Authority. SAVI developed an emergency food resource map to present the latest data on where these resources are available.
Access to parks
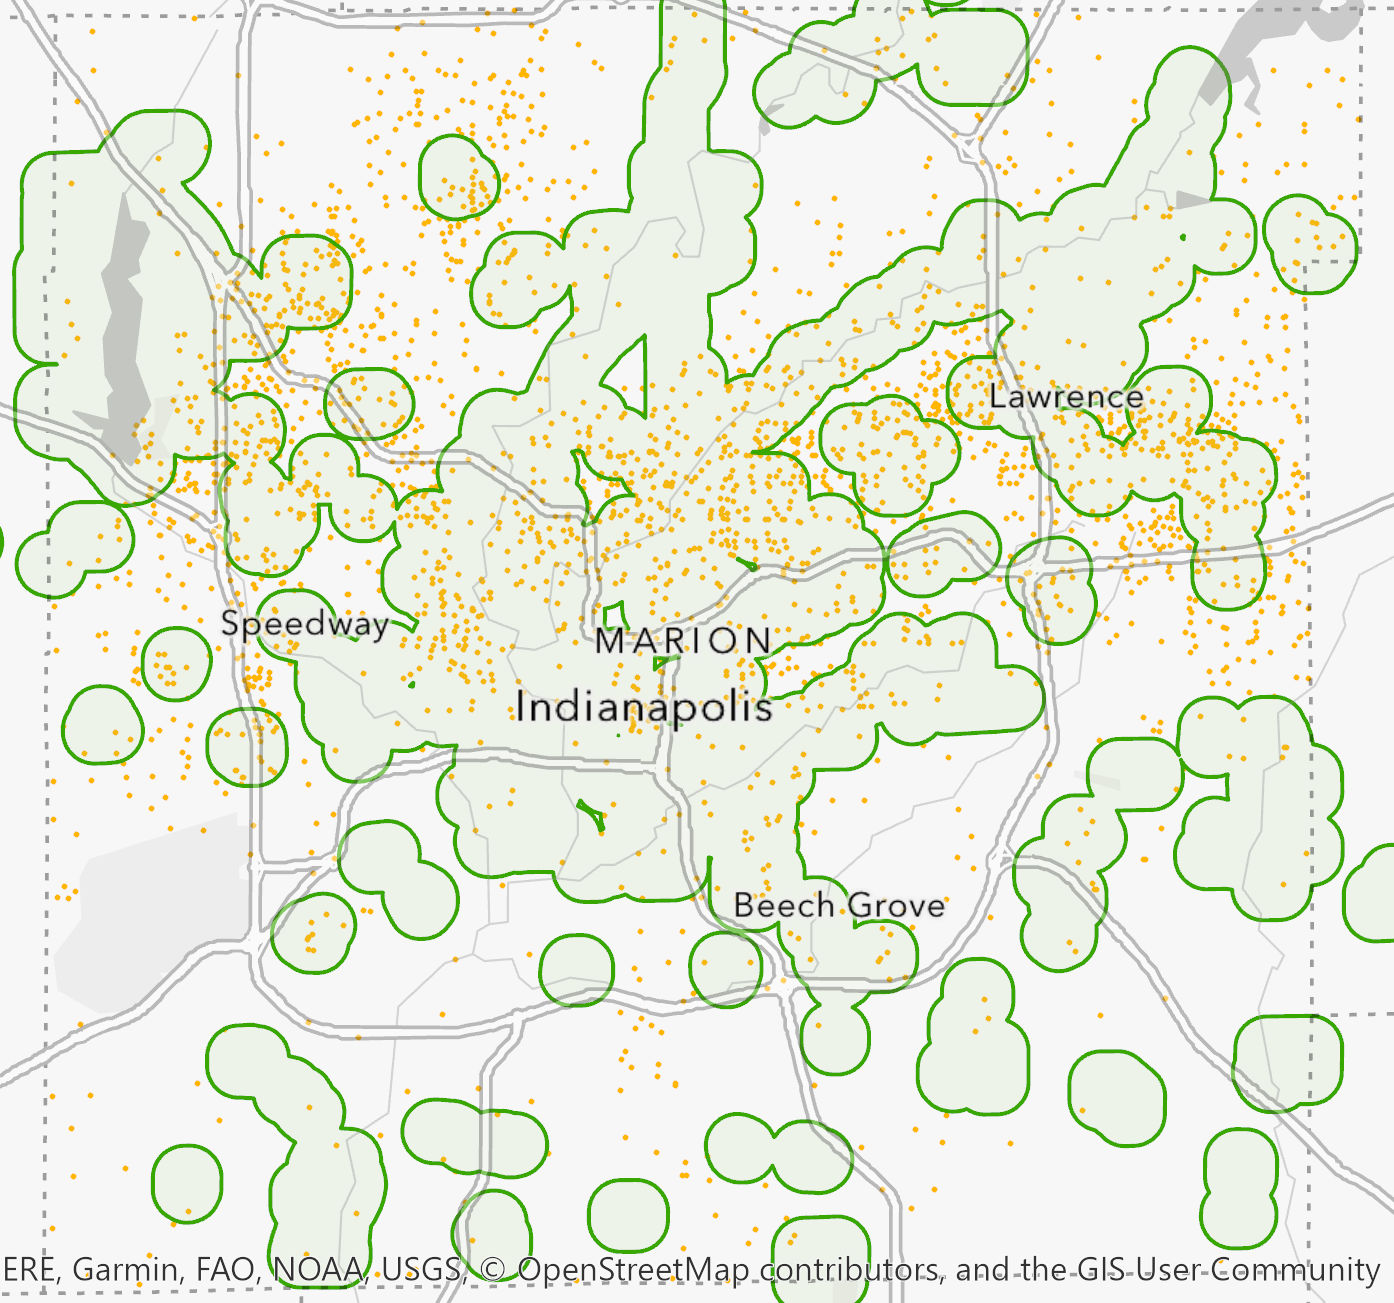
On a positive note, most black residents have close access to parks in Indianapolis. Evidence suggests that access to parks may contribute to physical activity (Schipperijin 2017, Jones 2015). An estimated 60% of black residents live within a half mile of a park, compared to 50% of white residents. Of Indianapolis’ 258,000 black residents, 155,000 live near a park. Living near a park could be particularly meaningful in a time when open spaces are one of our only opportunities to leave the house and get exercise.
Most black residents live within half a mile of a park
Green areas represent areas within half a mile of park. Orange dots represent ● 100 black residents.
Source:The SAVI Community Information System (savi.org), based on analysis by The Polis Center at IUPUI of data from Indiana Department of Natural Resources and American Community Survey
%
of black residents live within half a mile of park
Housing cost burden
When housing cost is a significant burden, households can be subjected to substandard housing, crowded conditions, and housing instability (Office of Disease Control and Prevention 2017). These conditions can impact mental and physical health. When a family’s housing costs add up to more than 30% of a household’s income, they are considered housing-cost burdened. One third of households in Marion County are housing cost burdened. This problem falls disproportionately on renters (50% are housing cost burdened) compared to owners (21%), and most black householders in Indianapolis (66%) are renters. This is due, in part, to systems that prevented black Americans from owning homes, like red-lining, blockbusting, and the FHA’s longtime refusal to subsidize mortgages in racially integrated housing developments.
Half of renters have a hard time affording the cost of housing
Percent of owner and renter households paying more than 30% of income in housing cost
A majority of black residents in Marion County are renters
Percent of households that rent their primary residence, by race of householder
Air pollution
According to our analysis of EPA models, black residents are more likely than white residents to live in neighborhoods with high risk from air pollutants. As factories and other point-source polluters report data to the federal government, the EPA produces models of how much risk different areas face from this pollution. These models are based on how toxic the pollutants are and how many people are going to be exposed to these toxins. In our analysis, a neighborhood faces high risk if it falls in the top 40% of all census tracts in Central Indiana. One quarter of white residents live in neighborhoods with high air pollutant risk, but over 40% of black residents live in these neighborhoods.
Black residents are more likely than whites to live in neighborhoods with high air pollution risk
Percent of residents who live in neighborhoods where air pollution risk, relative to Central Indiana, is high or very high
Source: Polis Center Analysis of EPA Data
Distribution of Indy's black population skews toward more polluted neighborhoods, compared to white residents
When you read this chart, the horizontal axis represents pollution levels in neighborhoods. The vertical axis represents the percent of population that lives in neighborhoods with a given pollution level. When the curve skews to the right, that population tends to live in neighborhoods with higher pollution.
4-in-10 black residents live in neighborhoods with high air pollution risk
Air pollution risk level by census tract, relative to Central Indiana
Source: The SAVI Community Information System (savi.org), based on analysis by The Polis Center at IUPUI of data from EPA

Black patients may have a harder time getting treatment
Health insurance
If someone does contract COVID-19, they will face steep financial hardship without health insurance to help with the cost of testing, doctor’s visits, or hospitalization. In Marion County, 11.6% of black residents have no health insurance. This is three percentage points higher than the uninsured rate for white residents.
Black individuals are 26% more likely to have no health insurance
Percent of Marion County population without health insurance by race
Source: The SAVI Community Information System (savi.org), based on analysis by The Polis Center at IUPUI of data from American Community Survey
%
Black Marion County residents without health insurance
%
White Marion County residents without health insurance
Bias in healthcare provision
When black patients do receive care, some of them may experience implicit bias from health care providers (Chapman 2013). Studies have found implicit bias causing white health care workers to view black patients as less cooperative (Green 2007) and to offer black patients less treatment for pain (Sabin 2012). This bias can lead to reduced quality of care (Fitzgerald 2017).
Access to healthcare
When people can regularly access primary care, they tend to have improved health outcomes. Quality primary care acts as a first contact for preventing illness, addressing health needs, and coordinating specialized care. In a review of literature, “studies consistently show a relationship between more or better primary care and most of the health outcomes studied.” (Starfield 2005)
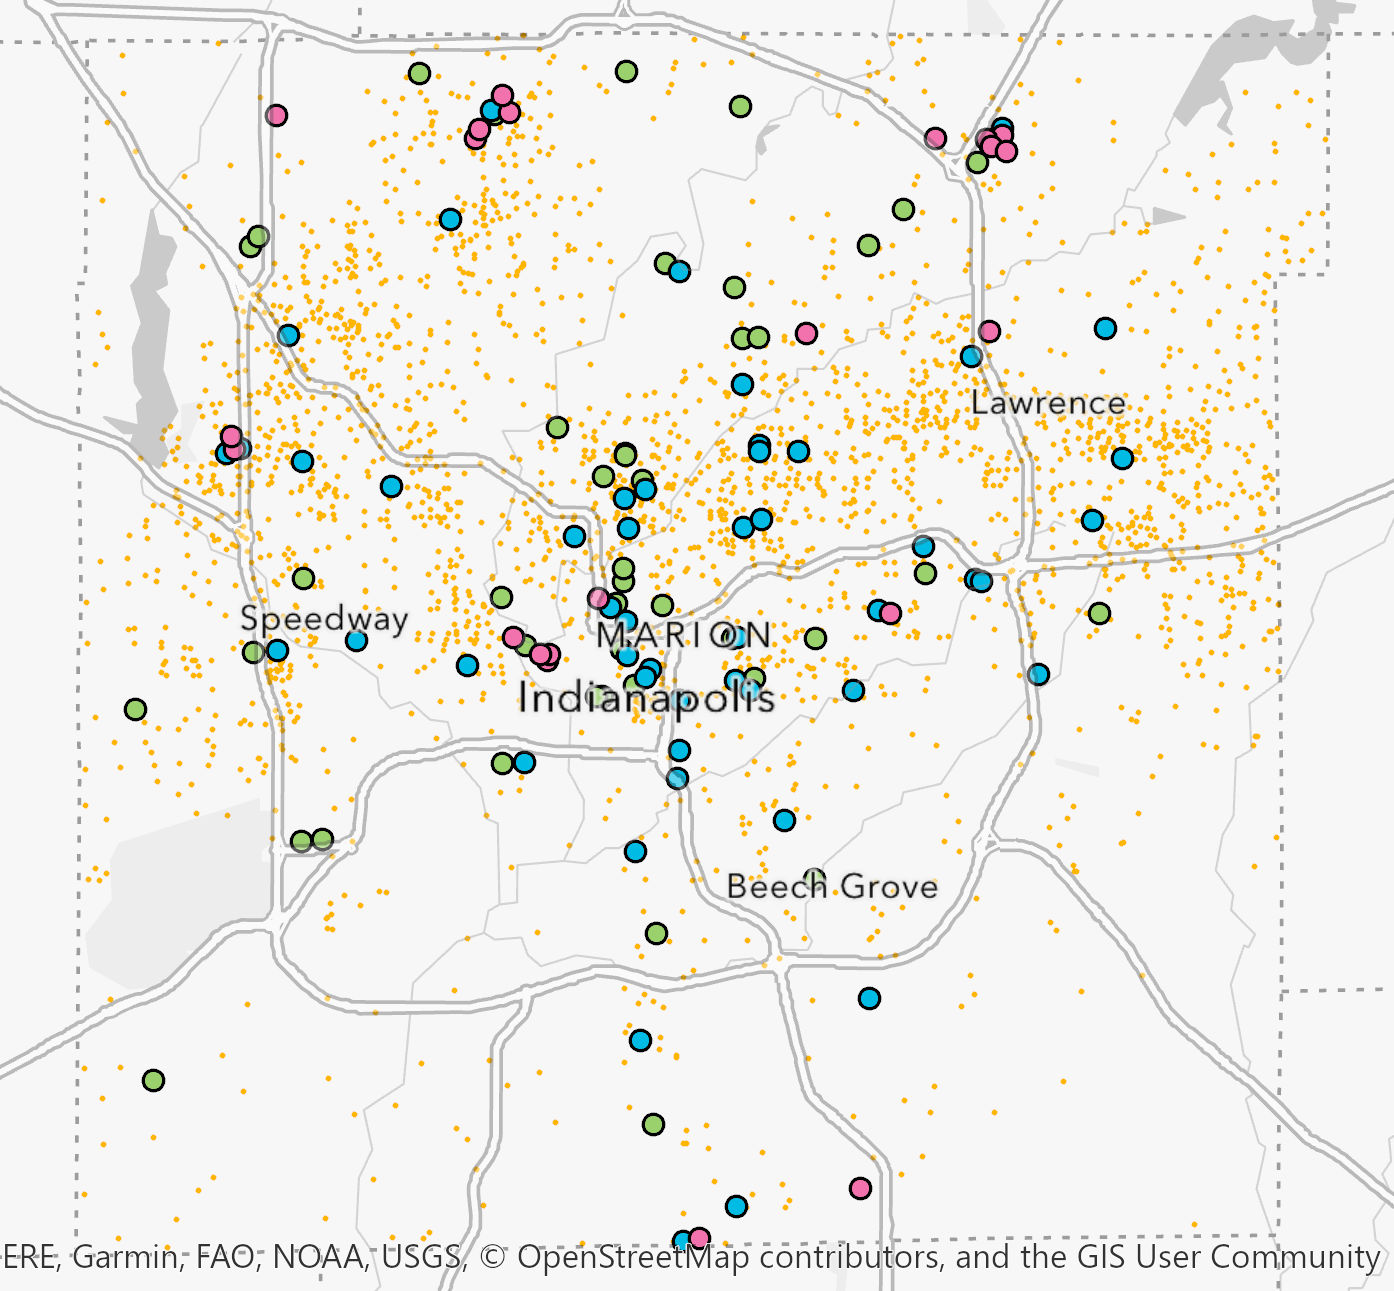
This map shows the location of health care facilities in relation to Marion County’s black residents.
Access to health care facilities is important to health outcomes
● Hospitals, ● clinics, and ● mental health clinics compared to black population. Each orange dot represents ● 100 black residents.
Source: The SAVI Community Information System (savi.org), based on analysis by The Polis Center at IUPUI of data from Indiana State Department of Health, American Community Survey, and Indiana 211

3Black residents are more likely to suffer from economic impacts
Many black households began this crisis at an economic disadvantage – more likely to experience financial instability, job loss, housing instability, and lower education levels. One-in-four black Indianapolis residents live in poverty, and many more are teetering on the financial edge. Another one-in-four black residents have incomes that are above the poverty line but less than twice the poverty limit. These individuals may already struggle to save money while affording the costs of living, and job loss will be a significant financial crisis.
53% of black residents live with incomes either below poverty or below 2x poverty
Source: The SAVI Community Information System (savi.org), based on analysis by The Polis Center at IUPUI of data from American Community Survey

Unemployment
Even before the economic crisis that began in March, black workers were more likely to be unemployed than white workers. In February 2020, 5.8% of black workers were unemployed nationally, compared to 3.1% of white workers (Bureau of Labor Statistics). County level estimates of unemployment by race are not as recent, but the American Community Survey estimates that, between 2014 and 2018, the average unemployment rate for black workers was 2.4 times the rate for white workers.
According to the Economic Policy Institute (EPI), when unemployment increases nationally, it rises faster for black workers. When the unemployment rate increases, it lowers wages for workers, but wages fall more for black workers than for white workers. In a 2015 report, EPI’s Valerie Wilson writes:
“Between 1979 and 2014, the average annual black unemployment rate changed by 1.7 percentage points for every 1 percentage-point change in the national unemployment rate, compared to a change of 0.91 percentage points for whites…Wages of black workers are more responsive to aggregate labor market changes. Doubling the national unemployment rate is estimated to reduce real hourly wages by at least 8 percent for the median black worker compared to 3 percent for the median white worker.”
Unemployment during COVID-19
This specific crisis has already hit black workers hard. The pandemic has caused a tremendous loss of jobs in the United States. 20.5 million workers lost their jobs in April, on top of 870,000 in March, and one fourth of job losses were in the food services sector. While any job loss of this scale is traumatic, those losses are not evenly distributed across race. A national survey in early April indicated that 45% of blacks and 31% of whites had either lost their job, lost hours, or were put on leave. The data below are national statistics because state and local numbers are not available yet. Indiana’s April unemployment statistics will be released on May 22.
Strictly looking at unemployment rate, the impact of the unemployment increase appears equal. However, unemployment is measured against the number of people in the labor force. During recessions, many people leave the labor force for reasons including long-term unemployment and the difficulty of finding a job during an economic contraction. These workers do not count in the unemployment rate. In combination, black workers have lost their jobs or left the labor force at a faster rate than whites between February and April.
Unemployment increased by 10 percentage points for white and black workers in April
U.S. unemployment rate by race (seasonally adjusted)
Source: Bureau of Labor Statistics
Labor force participation shrunk faster for black workers
U.S. labor force participation rate (seasonally adjusted)
Source: Bureau of Labor Statistics
Between February and April,
17% of black workers in U.S.
lost their job or left the labor force, compared to 15% of white workers.
Source: The SAVI Community Information System (savi.org), based on analysis by The Polis Center at IUPUI of data from Bureau of Labor Statistics
Housing insecurity
In addition to the impacts on mental and physical health, housing instability adds to the layers of economic impacts of COVID-19. For those who are paying more than 30% of their income on housing, even short-term unemployment can push those families into a financial crisis. During this pandemic, the state issued an executive order to freeze all evictions and foreclosures and an order to prevent utility shutoffs during this time. However, residents are still required to continue making rent and utility payments, which is a challenge for many, adding to their debt buildup and longer-term burden for families. This likely will impact more black families than white because 54% percent of black renters are housing cost burdened compared to 44% of white renters.
Educational attainment
When economic recovery begins, it will be difficult for those with less educational attainment to find jobs that pay well, or any job at all. Between 2013-2017, the average unemployment rate for Indianapolis workers with a bachelor’s degree was 2.8%, but it was 6.7% for those a with an associate’s degree and 9.6% for those with a high school diploma. Without a high school diploma, that rate rose to 13.2%. This matters to black workers because, while 35% of whites over age 25 have a bachelor’s degree, only 18% of black residents do. The result is less economic mobility.
Disparities in educational attainment are largely a result of historic policies dating back to the early half of the 1900s like segregation (Rothstein 2015) and practices such as linking school funding to property values (Ostrander 2015). These practices have led to generations of exclusion from education, healthcare access, and other resources largely monopolized in white communities (Rothsetein 2017). These legal forms of discrimination were eventually banned by the federal government, but states resisted enforcing federal bans through the 1970s (Massey & Denton 1993). And some racial practices such as redlining and mass incarceration continued well beyond this time, leaving lasting effects.
Black adults are half as likely as whites to have a bachelor's degree, putting them at higher risk for unemployment
Percent of adults 25 and older with a bachelor's degree
Source: The SAVI Community Information System (savi.org), based on analysis by The Polis Center at IUPUI of data from American Community Survey
- White 35%
- Black 18%
Economic Opportunity
These institutional and systemic barriers have led to wide disparities in economic opportunity by race, and the economic impact of COVID-19 will be felt more by those at a disadvantage. A national longitudinal study of 20 million children and their parents investigated racial disparities in income from 1989-2015. The findings show that black Americans have much lower upward mobility rates than whites, driven largely by income gaps between black men and white men. (Chetty, Hendren, Jones, and Porter 2019). When considering the neighborhood where the children grew up, black boys have lower incomes in adulthood than white boys from the same neighborhood in 99% of Census tracts across the U.S. In Marion County, a black male who grew in Marion County and had parents with low income earns on average $19,000 annually as an adult compared to $28,000 by their male white peers. The differences for females are $24,000 and $30,000 respectively (OpportunityAtlas.org). “Because of these differences in economic mobility, blacks…are ‘stuck in place’ across generations. Their positions in the income distribution are unlikely to change without efforts to increase their rates of upward mobility.”
Summary
As policy makers, nonprofits, health professionals, funders, and businesses are working to address the added challenges of COVID-19 on individuals, they also are planning for the period of recovery. These data underscore the importance of considering racial inequities, which already existed prior to COVID-19, as they plan resource allocations, policies, and guidelines moving forward.
The economic opportunities study suggests that policies and changes that are multi-generational and cross neighborhood and class lines, focusing on upward mobility for black men, will have the greatest impact in changing these economic disparities. This in turn will positively impact other outcomes such as health and wellness. Specific policy considerations include: mentoring programs for black boys, efforts to reduce racial bias among whites, interventions to reduce discrimination in criminal justice, and efforts to facilitate greater interaction across racial groups. (Chetty, Hendren, Jones, and Porter 2019).
Explore more data
You can explore more data on inequities in our SAVI profiles, including the Equity Profile and Health Profile.
You can explore data for your community using our SAVI Community Profiles.
More data about COVID-19 is available on SAVI’s Coronavirus Data Hub.
A summary of data used in this article
The table below contains all the data for Marion County that we used in this article. View it online or use the link at the bottom to download it.
Next Up
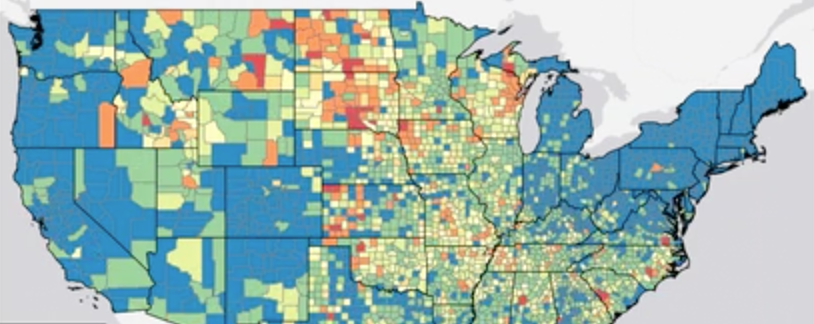 Animated Map of New U.S. COVID-19 Cases Over Time
 Indy Evictions May Reach 34,000 or More in 2020
An increase in unemployment claims could drive the eviction rate from 7 percent in 2016 to 20 percent in 2020, and informal evictions may be twice that.
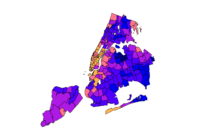 Socioeconomic factors explain why some New York ZIP codes were hit hardest by COVID-19
By comparing New York’s COVID-19 test results with demographic and socioeconomic factors by ZIP code, we found that low education levels, crowded housing, and a lack of health insurance are some of the strongest predictors of high COVID-19 positivity rates.
 Three Ways to Visualize COVID-19 Race and Gender Disparities
In Indiana, black individuals are 2.4 times more likely to test positive than whites. We look at three different ways to visualize COVID-19 disparities like this.