For a discussion of how we calculate income diversity and the policy implications of mixed-income neighborhoods, see this article. In short, we measured income diversity as the probability that, if you select two individuals from a neighborhood, they will be from different income groups. This results in a 0-100 scale, where zero is the lowest possible income diversity and 100 means residents are divided equally among all income categories. The typical tract in the region scored 61.
Researchers generally agree that mixed-income neighborhoods can have advantages for low-income residents in the form of place-based improvements, like better schools, safer neighborhoods, well-maintained infrastructure. But there is not much evidence for positive effects from low-income residents interacting with people from other socioeconomic classes. This study from the Urban Institute is a good introduction to the issue.
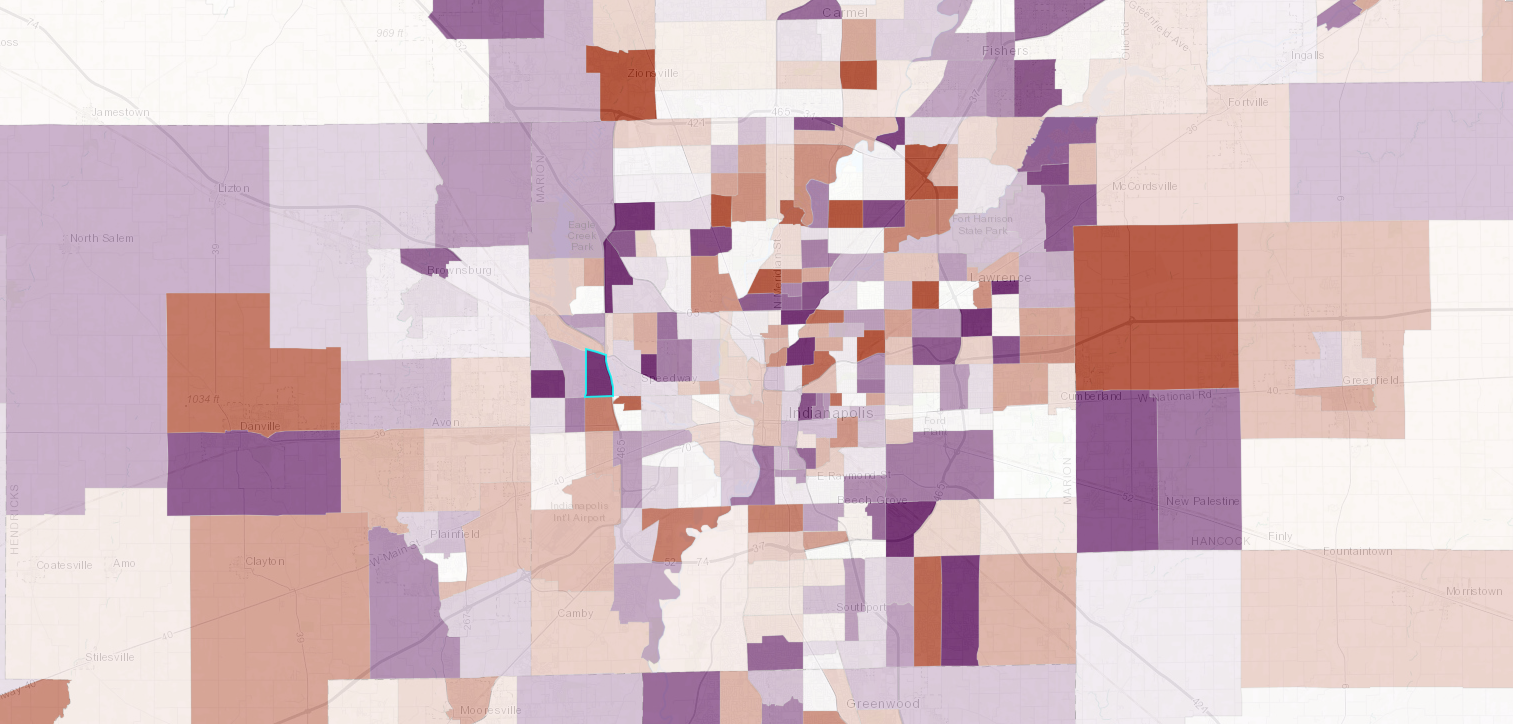
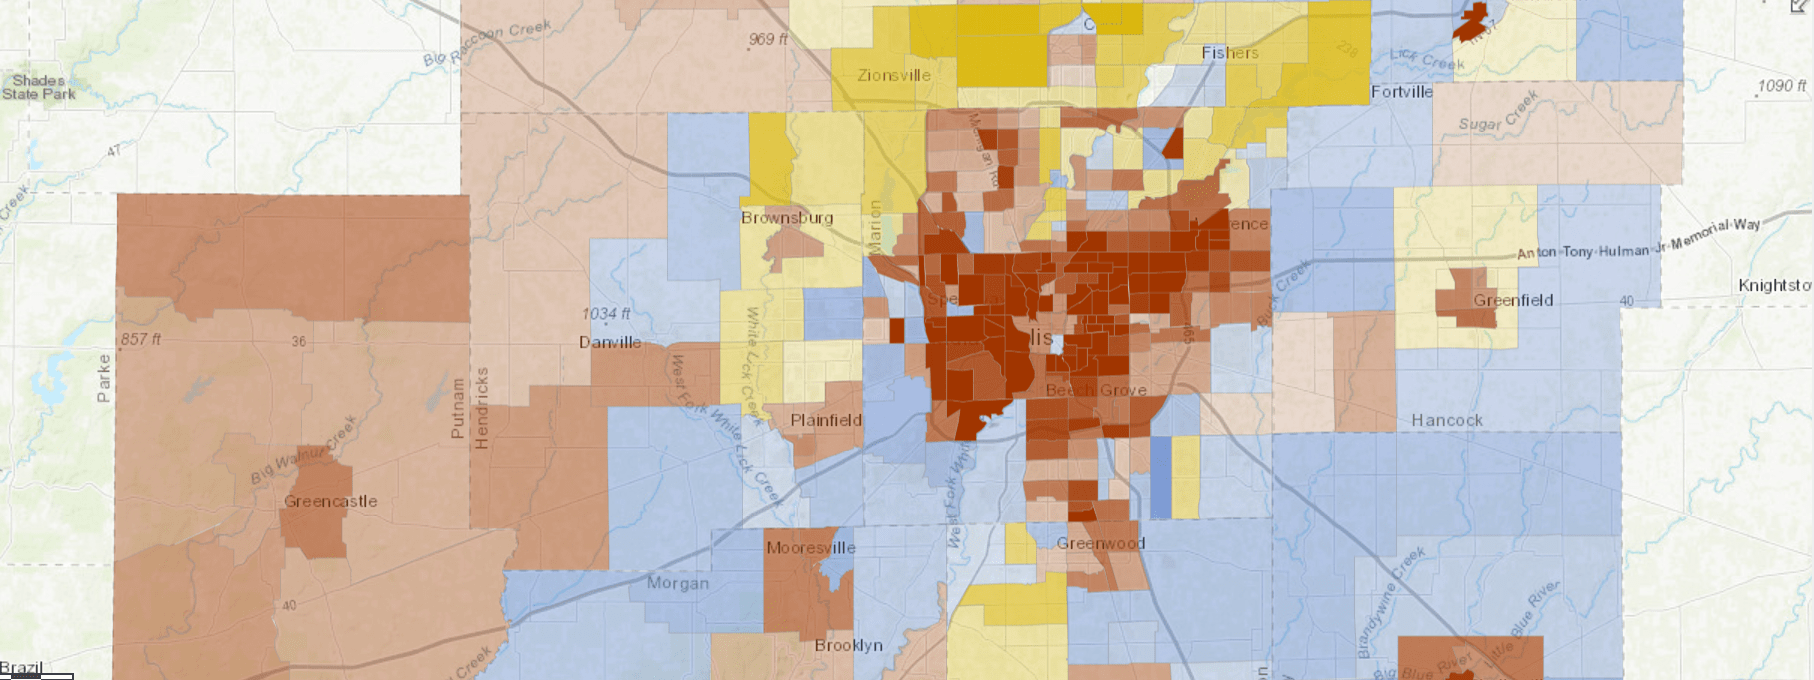
Increasing and Decreasing Income Diversity Across Indianapolis Region
Change in income diversity between 2011 and 2016, by census tract
Most Neighborhoods Became More Mixed-Income
There are 224 census tracts that were more income diverse in 2016 than in 2011, and 173 tracts that were less income diverse. The average neighborhood increased slightly in terms of income diversity between 2011 and 2016, with a score increase of 1.7. Tracts where income diversity is increasing quickly saw score increases of 17.9 or higher (two standard deviation above average). Tracts with significant decreases in income diversity experienced a drop of 14.5 points or more (two standard deviation below average).
Often, neighborhoods with increasing income diversity are adjacent to neighborhoods with decreasing income diversity. The overall amount of change (regardless of increase or decrease) tends to be concentrated in Indianapolis, especially the east, west, and north areas of the city. Parts of other towns and cities throughout the region have also experienced rapid change, such as Shelbyville, Anderson, Zionsville, Carmel and Noblesville. Rural areas that experienced rapid change include northwest Hancock County and northern Madison County.
These five areas have seen the largest increase in income diversity.
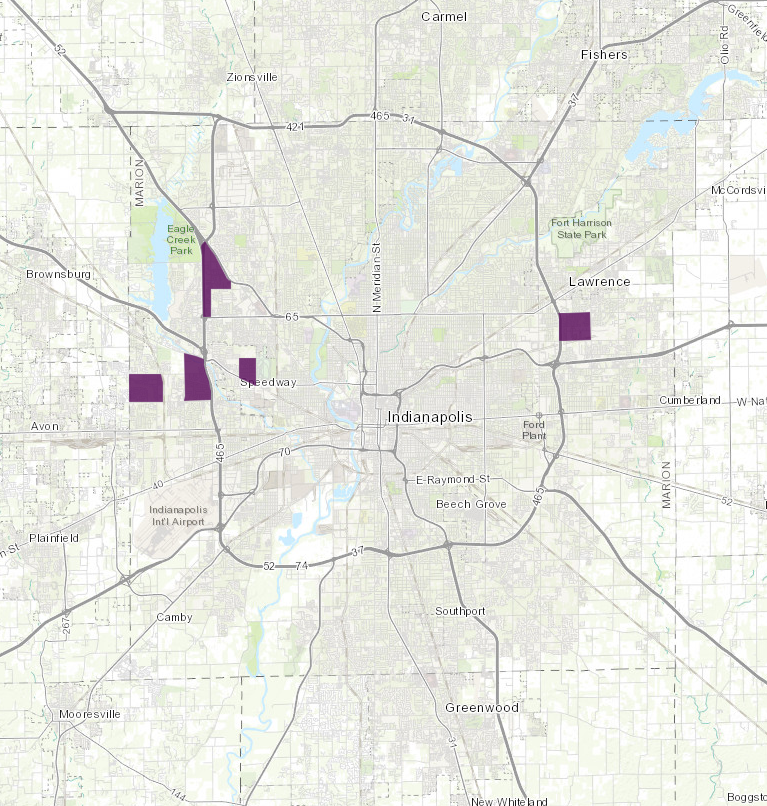
Some areas in the region had several neighborhoods that became more income diverse. The westside and northwest side of Indianapolis grew more income diverse, especially in parts of Speedway, Pike Township, and neighborhoods near Ben Davis High School. Parts of Franklin Township also become more income diverse, including southwest Beech Grove. On the eastside, neighborhoods near 38th Street and I-465 grew more income diverse since 2011. Four of the five neighborhoods with the highest increase in income diversity are located on the Far Westside, and one is located on the Far Eastside.
These five areas have seen the largest descrease in income diversity.
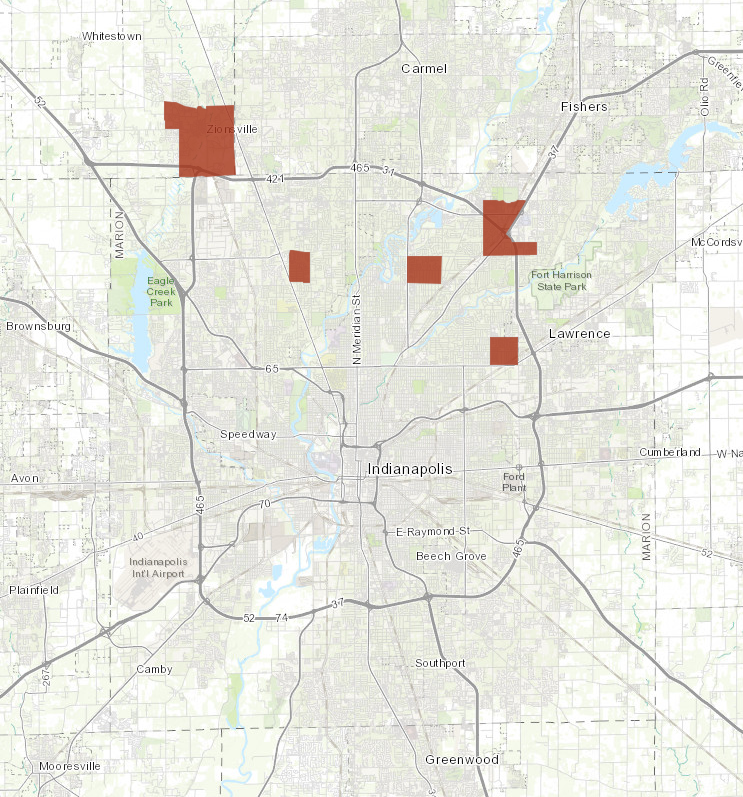
All five of the neighborhoods with the steepest decline in income diversity are in northern Marion County and southern Hamilton County, including portions of Lawrence, areas between 62nd Street and 82nd Street, and portions of Zionsville. The northeast corridor along I-70 had several tracts that experienced declining income diversity.
Grandview Had Biggest Decline in Income Diversity
The historically black suburb of Grandview (between Westlane Road, Grandview Drive, 63rd Street, and Township Line Road) experienced a drop in income diversity of 24 points. In 2011 it had above average income diversity (76 points out of 100) and in 2016 it had below average income diversity (52 points). Paul Mullins has done some excellent work researching this neighborhood.
The share of residents at the extreme ends of the income spectrum declined. This means incomes are now more concentrated in a few categories. In 2011, very poor households (earning less than $15,000) made up a fifth of Grandview residents. In 2016 that fell to a tenth. In 2011, 10.6 percent of households earned $100,000 or more, but that fell to only 3.3 percent in 2016. Now, almost nine in ten households earn between $15,000 and $100,000.
The neighborhood is only somewhat below average in terms of income diversity now, but the decline has been dramatic because it was so income diverse in 2011. The tract was more mixed-income than over 90 percent of the metro area. Interestingly, the area just south of Grandview is significantly more mixed-income than it was in 2011, illustrating that changes in income diversity do not tend to “cluster” or be grouped together in certain areas.
In Grandview, steep decline in income diversity caused by fewer high-income, very low-income residents
Income distribution (households), 2011 and 2016
Farley, Near Ben Davis, Had Biggest Increase in Income Diversity
The neighborhood just east of Ben Davis High School was one of the least mixed-income in the region in 2011, with a score of 39 out of 100. Almost 4 in 10 households were from one income group, earning $50,000-$75,000. This tract was an example of very concentrated middle class households, without many other income categories well-represented. In fact, only a third of households fell outside the $35,000-$100,000 income range.
By 2016, the neighborhood had increased in income diversity by 26 points. It is now more mixed income than the average tract. This was driven by a growth in lower and upper income categories. Specifically, the share of households earning $25,000-$35,000 grew by 10.1 percentage points. The share of households earning $75,000-$100,000 grew by 9.7 percentage points. This growth, combined with moderate increases in very low and very high income categories, evened out the distribution curve, making this neighborhood much more income diverse than in 2011.
In Farley, Growth in Upper and Lower Incomes Increased Diversity
Income distribution (households), 2011 and 2016
Next Up
 Indy’s Least Mixed-Income Neighborhoods
Explore neighborhoods where residents are highly concentrated into a few income groups. We dive into examples of concentrations of low-income residents, high-income residents, and middle-income residents.
 Indy’s Most Mixed-Income Neighborhoods
We measured income diversity in every neighborhood in the region, and the most mixed-income neighborhoods include the Old Northside, the tract containing Rocky Ripple and Crows Nest, and the area near Pike High School.
 Income Inequality High Where Golden Hill and Northwest Indianapolis Converge
In the area where wealthy Golden Hills converges with the working-class neighborhoods of Northwest Indianapolis, income inequality is high and increasing. The area is also experiencing a growth of white households above the median income.
 Changes in Indy’s Historic Black Neighborhoods
In the 1970s, 4,000 residents left this nearly all-black neighborhood. Why? An increasingly desegregated housing market and closure of one of the country’s first public housing projects.