Park Area per Capita
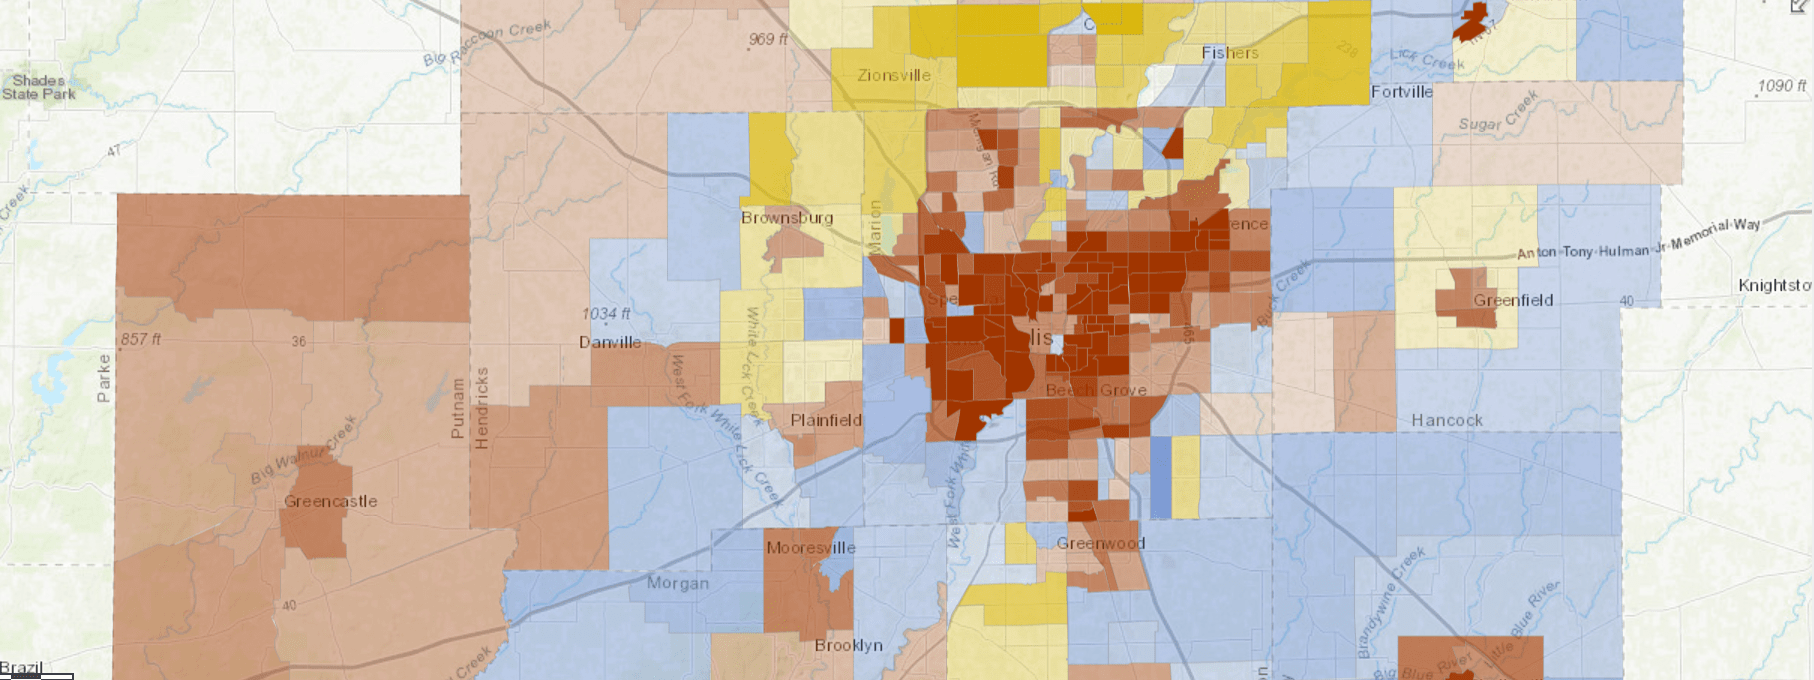
Median Assessed Value Differences
Properties Values are Lower among Properties Near Parks
Average of Median Assessed Values of Residential Properties by Tracts
Average of Median Assessed Values of Residential Properties by Municipalities
Prior studies (Crompton, 2001; Trust for Public Land, 2018) have established that parks tend to increase the value of nearby properties by up to 20%. However, we found that within tracts, the assessed value of properties near parks was an average of $5,000 less than other properties. This varies a lot from tract to tract. For example, for most tracts in Indianapolis, properties near parks are worth at least $1,000 more than other properties. Properties in Zionsville also tend to be worth more when near a park. The opposite is true in Carmel and Fishers. The largetst positive value difference is in a tract in Westfield, and the largest negative difference is in a tract in Lawerence. We should be clear that this difference in property value is not necessarily caused by the presence of a park. This analysis does not control for other factors that might effect property value. Assessed value has two components, the value of the land and the value of the improvements (or buildings on the land). In general, we found land near parks to be worth about $400 more than other land, while improvements were worth about $6,000 less.Median Assessed Value Differences by Tract
Data
For this blog, three different datasets were used via the SAVI information System:- Parks: This data comes from Indiana Department of Natural Resources Managed Lands dataset. This are natural and recreational areas which are owned or managed by IDNR as well as some lands that are owned by other state, federal, local agencies or non-profit organizations. This excludes parks managed by other organizations, like local neighborhood groups, for example.
- Population: This data comes from the 2016 American Community Survey 5-year estimates.
- Parcel boundaries: This data comes from the Indiana Geographic Information Officer.
- Parcel types and values: This data comes from the Indiana Department of Local Government Finance. This data was used to identify those properties that were residential and their current assessed values.
Methodology
Properties near parks are defined as those within a quarter mile of any IDNR manage lands parks. For each type of parcels (near-park and far-from-park), the median assessed value was calculated within tracts within municipalities. We did not use tracts where the entire tract was near a park or far from a park, as there would be no comparison possible within the same tract. Park area per person was calculated by counting the total area of parks that were countain within each boundary and divided by the population assigned to the tract/municipality.Next Up
 Indy’s Least Mixed-Income Neighborhoods
Explore neighborhoods where residents are highly concentrated into a few income groups. We dive into examples of concentrations of low-income residents, high-income residents, and middle-income residents.
 Story Map: Moving Out – Suburbanization Since 1970
Indianapolis and Anderson were the region’s urban centers in 1970. Three-quarters of the population lived in those counties. Now, just over half the population live there, and Hamilton County is the second largest urban center.
 Mortgage Activity Growing Fastest Among Middle- and Upper-Income Borrowers
There were 50 percent more Central Indiana home purchase loans in 2016 compared to 2012. Among upper-income borrowers, the number of new loans went up 80 percent.
 Indy Rezone Defines New Context Areas: Compact and Metro
Indianapolis adopted a new zoning ordinance called Indy Rezone, effective May 2016. A zoning ordinance generally consists of list of regulations defining what property owners are permitted to build in […]