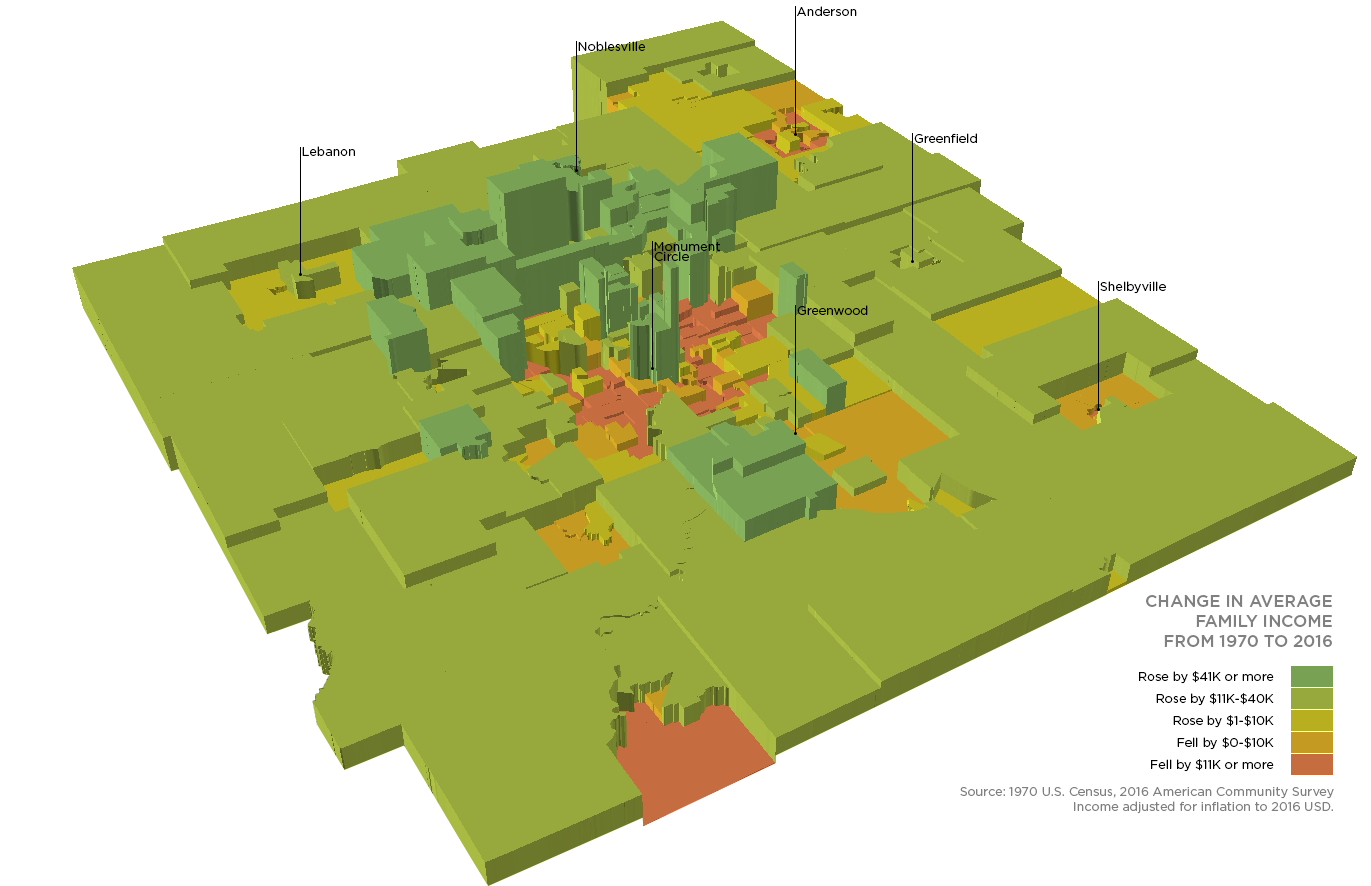
Since 1970, average family income has risen in half of the neighborhoods (census tracts) in the Indy metro. But 24 percent of census tracts have seen declines of more than $20,000. Most of these are located in Indianapolis’ urban core, particularly on the east, west, and south sides of the city.
As part of our research on neighborhood change, we analyzed change in five factors: race, income, education, population, and young adult population. In previous articles, we have taken a deep dive into race and population. Now we are examining changes in average family income.
The average family in the Indianapolis metro earned $68,975 in 1970. Incomes grew between 1980 and 2000, when the average family earned $89,917. However, incomes have been stagnant overall since then. In 2016, the average family earned $86,860.
From 1970 to 2000, job growth was strong compared to population growth. This meant that jobs per capita increased by 55 percent. Total jobs doubled from 405,175 in 1970 to 809,252 in 2000. However, by 2010 the Great Recession had erased some of those gains. The region lost nearly 45,000 jobs. Inflation-adjusted wages also fell in this period, from $47,670 in 2000 to $46,714 in 2010. The average annual wage is similar in 2016 ($46,798).
Average Family Income and Wages Stagnant Since 2000
Average Family Income, Jobs per Capita, and Average Annual Wage, 1970-2016 (Inflation Adjusted)
Inequality Between Neighborhoods on the Rise
Fifty years ago, the difference between a wealthy neighborhood and a low-income neighborhood was smaller than it is today. In a high-income neighborhood (80th percentile), the average family earned 38.8 percent more than a family in a low-income neighborhood (20th percentile). In 2016, the average family in a high-income neighborhood earned twice as much as—or 115.4 percent more than—a family in a low-income neighborhood.
The animation below illustrates that, while suburban and rural tracts experienced income gains in the 1970s, incomes declined in the core of Indianapolis. In the 1980s, downtown neighborhoods become wealthier, but for many other urban neighborhoods, incomes fall again in the 2000s.
When average family income rises in a neighborhood, there are two basic explanations. Either the people living in the neighborhood begin to earn more money, or people who earn more money move to the neighborhood. Aggregate neighborhood-level data like this does not give us enough information to know which trend is happening.
When we pair this information with trends in population migration, however, we can assume that people with higher incomes moved away from core neighborhoods and into suburban neighborhoods. We make that assumption because, from 1970 to 2010, there were extreme population losses in Center Township and population growth in other townships and counties.
Since 1970, Number of Rich and Poor Neighborhoods on the Rise
Average Family Income by Decade, 1970-2016 (Nine Indy Metro Counties)
This map shows how incomes grew and shrank over time in the nine counties of the Indy metro. Each shape represents a census tract. As it grows taller, its income increases. In 1970, the landscape was more “even,” meaning there was not a big difference between rich and poor neighborhoods. Since then, income has dropped in many urban neighborhoods and risen dramatically in suburban areas. In 1970, there 38 neighborhoods at the extreme ends of the spectrum (where the average family earned more than $100k or $40k or less). In 2016, there were 124 neighborhoods at the extreme ends of the spectrum.
Suburbs, Downtown Experiencing Income Growth
Real income has grown since 1970 in most rural and suburban tracts, particularly the suburban ring closest to Marion County. Outlying rural areas have seen modest income growth. The most dramatic growth is on the north side of the region. The west side of Carmel, near the Village of West Clay, experienced the highest growth in income. In 1970, it was already a high income neighborhood where the average family earned $97,000. By 2016, average family income had increased by $165,000.
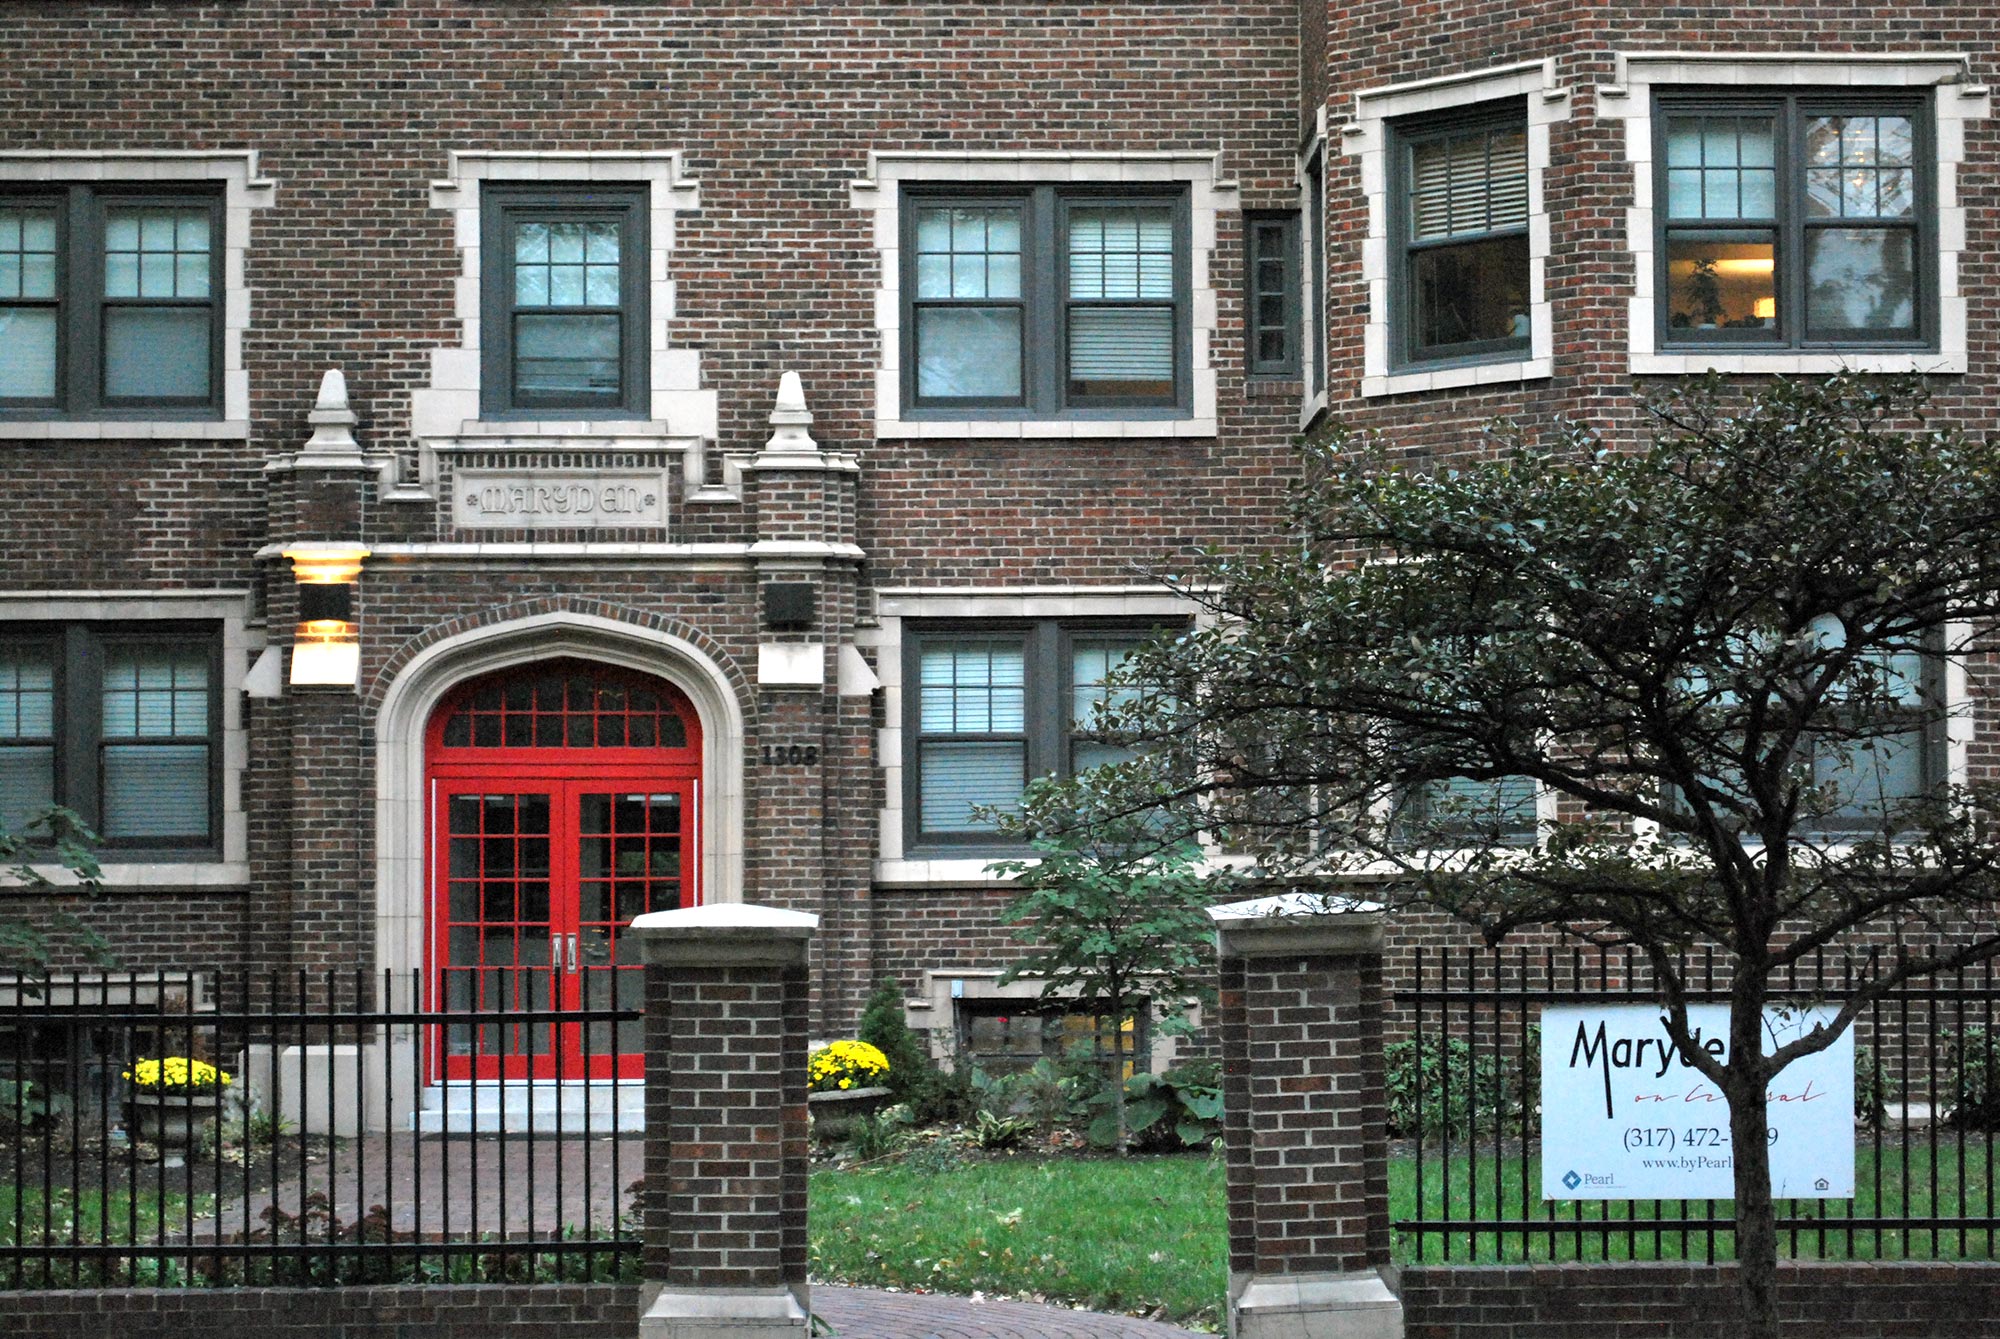
Downtown Indianapolis has also seen income growth. The average family here earned $42,300, but income began to increase in the 1980s. This growth spread to areas like Mass Ave, the Old North Side, and recently Fletcher Place. These areas all have average family incomes well above $100,000. Fletcher Place saw one the biggest income increases, second only to the Village of West Clay. Average family income increased by $161,000 from 1970 to 2016, when it reached $218,335.
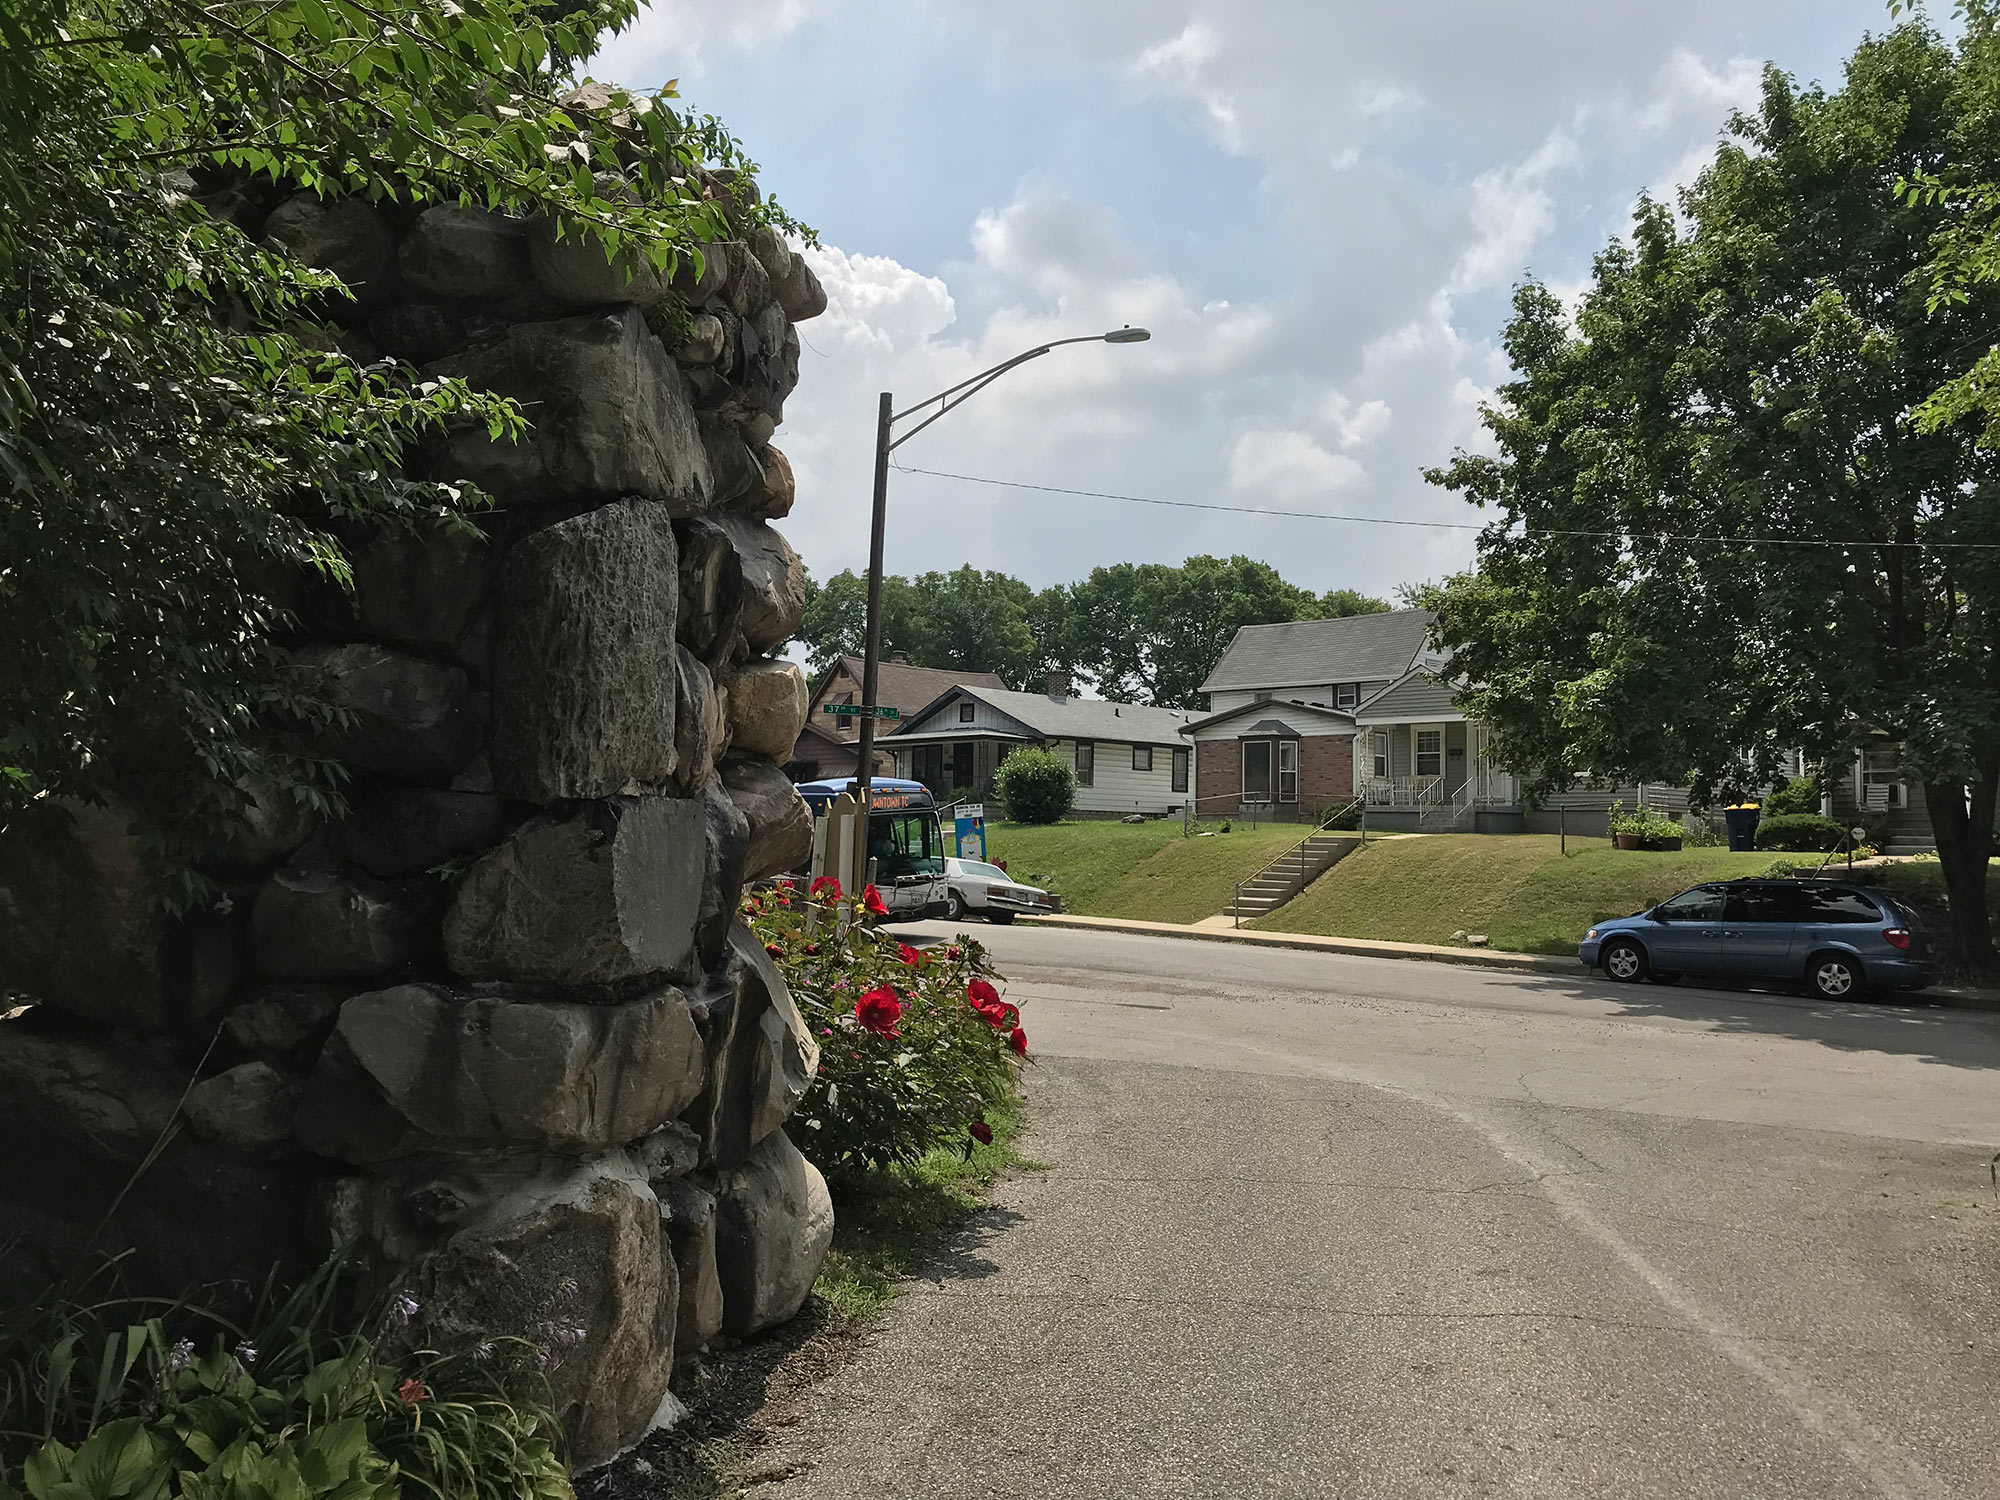
Meanwhile, many tracts in Indianapolis have seen income declines. As our report, Neighborhood Change 1970-2016, found, half of Indianapolis’ population lives in neighborhoods that have experienced income declines of 16 percent or more since 1970. There are 191 census tracts where income has declined since 1970. Of those, 79.1 percent are in Marion County and 11.5 percent are in Madison County.
Northside, Downtown Had Highest Income Growth, While Urban Areas Declined
Change in Average Family Income, 1970-2016 (Nine Indy Metro Counties)
As our economy recovers and strengthens after the Great Recession, it is necessary to continue to monitor these urban neighborhoods. As income rises in outlying areas, will it also rise in urban neighborhoods? Since 1970, this has not been the case. Some neighborhoods have received significant public and private investment and now have much wealthier populations than they did in the 1970s. It remains to be seen if these population increases will increase economic opportunity for the rest of the city.
See How Your Neighborhood Has Changed
Find more interactive content from our series on neighborhood change.
No Results Found
The page you requested could not be found. Try refining your search, or use the navigation above to locate the post.
Next Up
 Indy’s Most Mixed-Income Neighborhoods
We measured income diversity in every neighborhood in the region, and the most mixed-income neighborhoods include the Old Northside, the tract containing Rocky Ripple and Crows Nest, and the area near Pike High School.
 Income Inequality High Where Golden Hill and Northwest Indianapolis Converge
In the area where wealthy Golden Hills converges with the working-class neighborhoods of Northwest Indianapolis, income inequality is high and increasing. The area is also experiencing a growth of white households above the median income.
 Neighborhood Change Study in a Front Page IBJ Article
Matt Nowlin, Research Analyst, was interviewed for an article by Hayleigh Colombo in the Indianapolis Business Journal. This article showcases the change in neighborhoods like Martindale-Brightwood in Indianapolis since the […]
 What We’re Reading: January 14, 2018
This week, Chicago Policy Review looks at a paper that finds Atlanta’s low-income households moved to where transit is available, NPR highlights the work of an Indianapolis CDC, and Brookings provides an economic development dashboard.