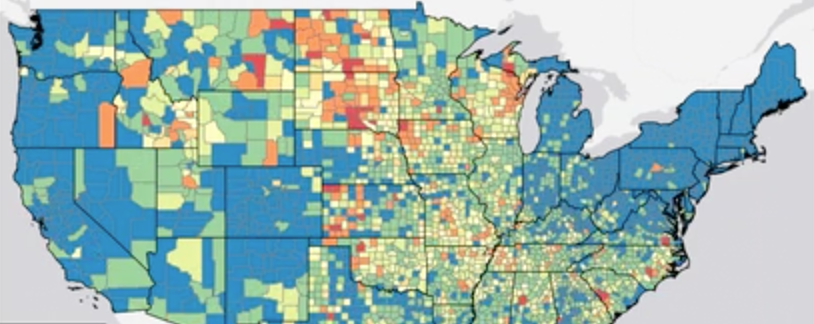
The incidence of new COVID-19 cases has not been the same over time throughout the country. This animated map shows the 7-day average of new COVID-19 cases per 100,000 people. This allows us to view the spread and incidence of the virus regardless of population density.
The COVID-19 data used in this animated map comes from USAFACTS at https://usafacts.org/visualizations/coronavirus-covid-19-spread-map/. Here are some basic statistics for values from March 1 through September 27, 2020:
- The values on the map represent the average number of new cases per day in the last seven days divided by the 2019 census estimate of county population.
- There are 3,142 counties in the United States. The map only shows those in the contiguous 48, but the statistics below include data for all 50 states.
- There are 662,962 values for all counties over this timeframe (3,142 counties over 211 days).
- 74% of the values are below 10 new cases per 100,000 residents.
- 88% of the values are below 20 new cases per 100,000 residents.
- 98% of the values are below 50 new cases per 100,000.
Looking at the animated map, we can clearly see the following geographic trends of the spread of COVID-19 across the continental United States. In March and April, The New York City area saw a large number of COVID-19 cases. In late March and April, a few other hot spots developed, notably in the New Orleans, LA and Albany, GA areas. Other localized outbreaks occurred throughout the country, especially in prisons and meat packing plants.
In April and May, we saw regional outbreaks, especially in the southeastern states of Mississippi, Alabama, and Georgia, eventually expanding to the Carolinas and Florida. The southwestern US also saw a significant increase in the number of cases starting in late May and early June with southern California, Arizona, and southern Texas particularly affected. In July, the epidemic was much more widespread with the southern US states, from California to the Carolinas seeing a significant increase in the COVID-19 cases.
We also saw an increase in cases in the northwestern US, mainly in Wyoming, Idaho, and Washington, along with a steady increase in cases in the north central states such as North Dakota and Iowa. In August, the Midwestern (mainly west of Ohio) and southeastern states were showing the largest growth in new cases. By September, the epidemic seemed to cool down slightly in the southeast but grew exponentially in the western Midwest and eastern Northwest states.
Next Up
 Indy Evictions May Reach 34,000 or More in 2020
An increase in unemployment claims could drive the eviction rate from 7 percent in 2016 to 20 percent in 2020, and informal evictions may be twice that.
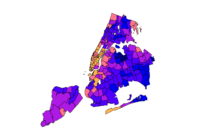 Socioeconomic factors explain why some New York ZIP codes were hit hardest by COVID-19
By comparing New York’s COVID-19 test results with demographic and socioeconomic factors by ZIP code, we found that low education levels, crowded housing, and a lack of health insurance are some of the strongest predictors of high COVID-19 positivity rates.
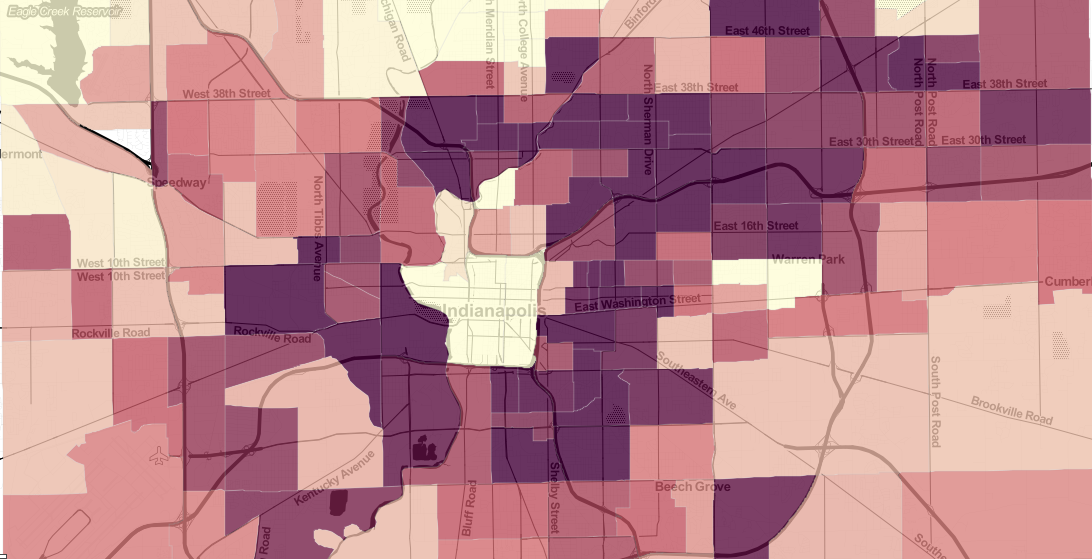
 The Inequalities Behind COVID-19 Disparities for African Americans in Indianapolis
COVID-19 positivity rate is 1.8 times higher for blacks than for whites. We explore how systemic inequities put many black individuals at higher risk for getting the virus, having a serious case, and suffering from the economic impacts compared to white residents.
 Three Ways to Visualize COVID-19 Race and Gender Disparities
In Indiana, black individuals are 2.4 times more likely to test positive than whites. We look at three different ways to visualize COVID-19 disparities like this.